ERLEC1
[ENSRNOP00000043115]
Main page
| | | Plot |
Mito |
Lyso |
|
Perox |
ER |
Golgi |
PM |
Cytosol |
Nucleus |
|
| Expt A |
 11
11
peptides |
27
spectra |
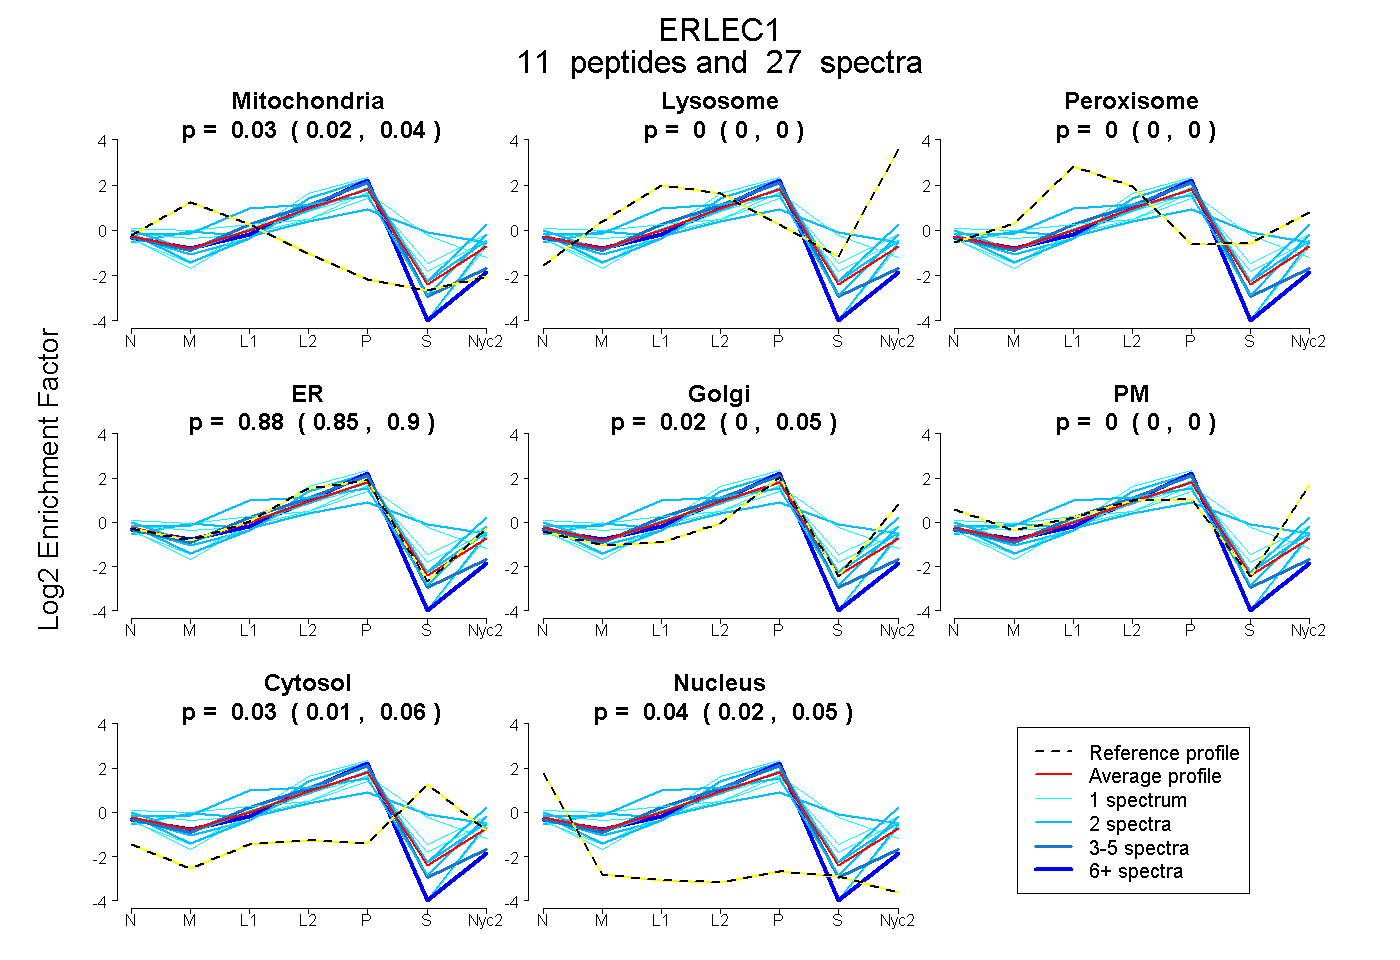 |
0.030
0.016 | 0.043 |
0.000
0.000 | 0.000 |
|
0.000
0.000 | 0.000 |
0.879
0.848 | 0.899 |
0.021
0.000 | 0.052 |
0.000
0.000 | 0.000 |
0.034
0.005 | 0.056 |
0.037
0.021 | 0.049 |
|
| | | Plot |
Mito |
|
Lyso or Perox |
|
ER |
Golgi |
PM |
Cytosol |
Nucleus |
|
| Expt B |
4
peptides |
9
spectra |
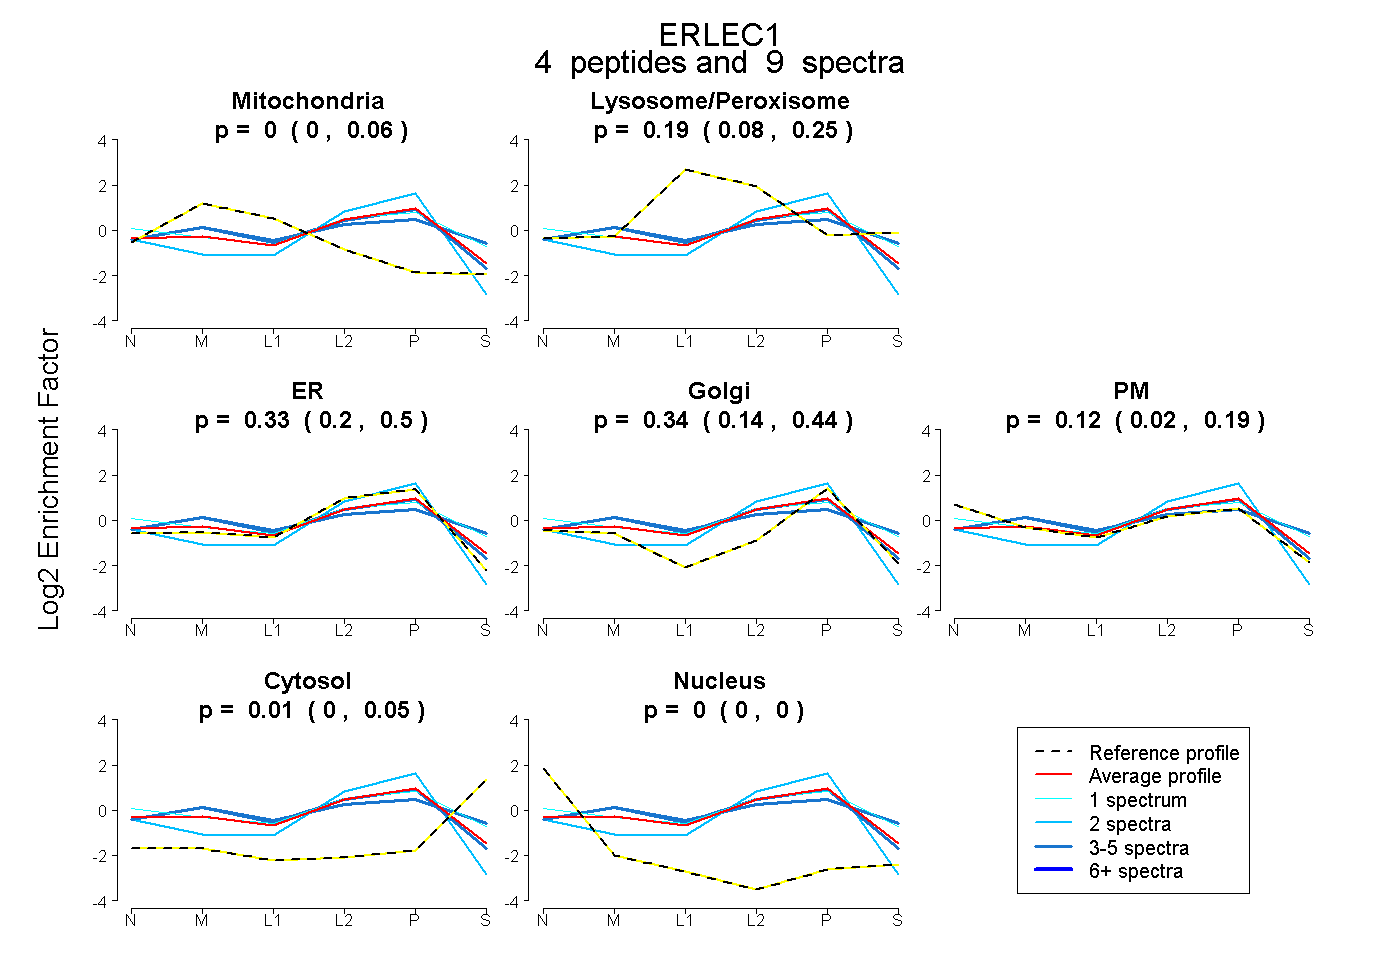 |
0.004
0.000 | 0.063 |
|
0.192
0.081 | 0.251 |
|
0.332
0.197 | 0.496 |
0.338
0.140 | 0.439 |
0.123
0.018 | 0.190 |
0.011
0.000 | 0.054 |
0.000
0.000 | 0.000 |
|
| 3 spectra, QLEQQEEILR |
0.117 |
|
0.127 |
|
0.457 |
0.231 |
0.068 |
0.000 |
0.000 |
|
| 2 spectra, ELLEPLFK |
0.000 |
|
0.000 |
|
0.894 |
0.097 |
0.000 |
0.000 |
0.010 |
|
| 1 spectrum, YEFCYGK |
0.000 |
|
0.283 |
|
0.017 |
0.344 |
0.307 |
0.050 |
0.000 |
|
| 3 spectra, AYHLQDDGTQTVR |
0.049 |
|
0.350 |
|
0.000 |
0.458 |
0.057 |
0.085 |
0.000 |
|
| | | Plot |
|
Lyso |
|
|
|
|
|
|
|
Other |
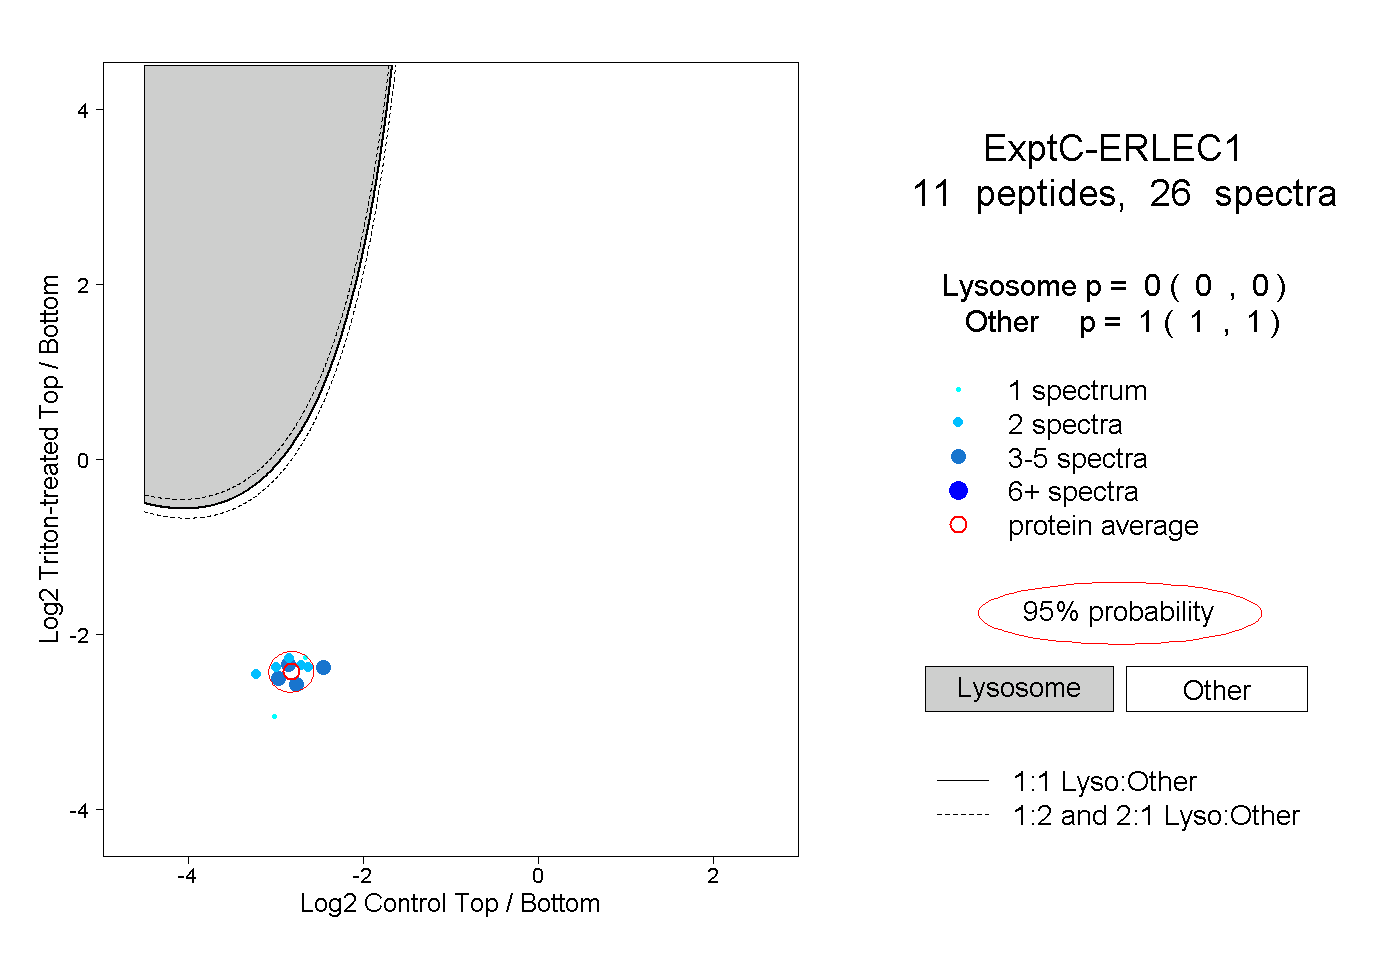
| Expt C |
11
peptides |
26
spectra |
 |
|
0.000
0.000 | 0.000 |
|
|
|
|
|
|
|
1.000
1.000 | 1.000 |
| | | Plot |
|
Lyso |
|
|
|
|
|
|
|
Other |
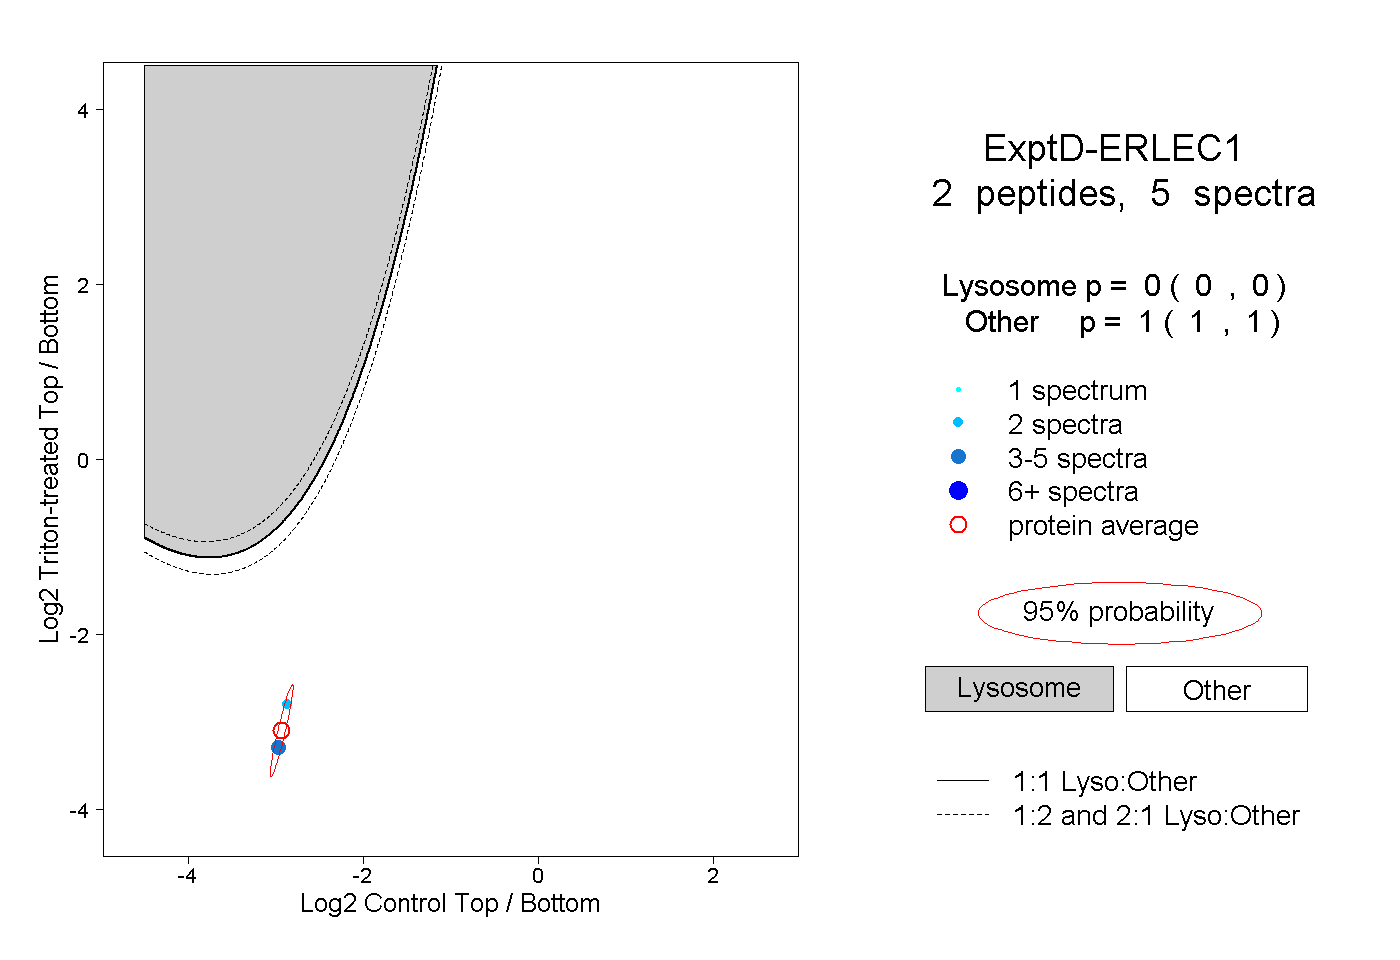
| Expt D |
2
peptides |
5
spectra |
 |
|
0.000
0.000 | 0.000 |
|
|
|
|
|
|
|
1.000
1.000 | 1.000 |