 11
11peptides
spectra
0.016 | 0.043
0.000 | 0.000
0.000 | 0.000
0.848 | 0.899
0.000 | 0.052
0.000 | 0.000
0.005 | 0.056
0.021 | 0.049
| Plot | Mito | Lyso | Perox | ER | Golgi | PM | Cytosol | Nucleus | |||||
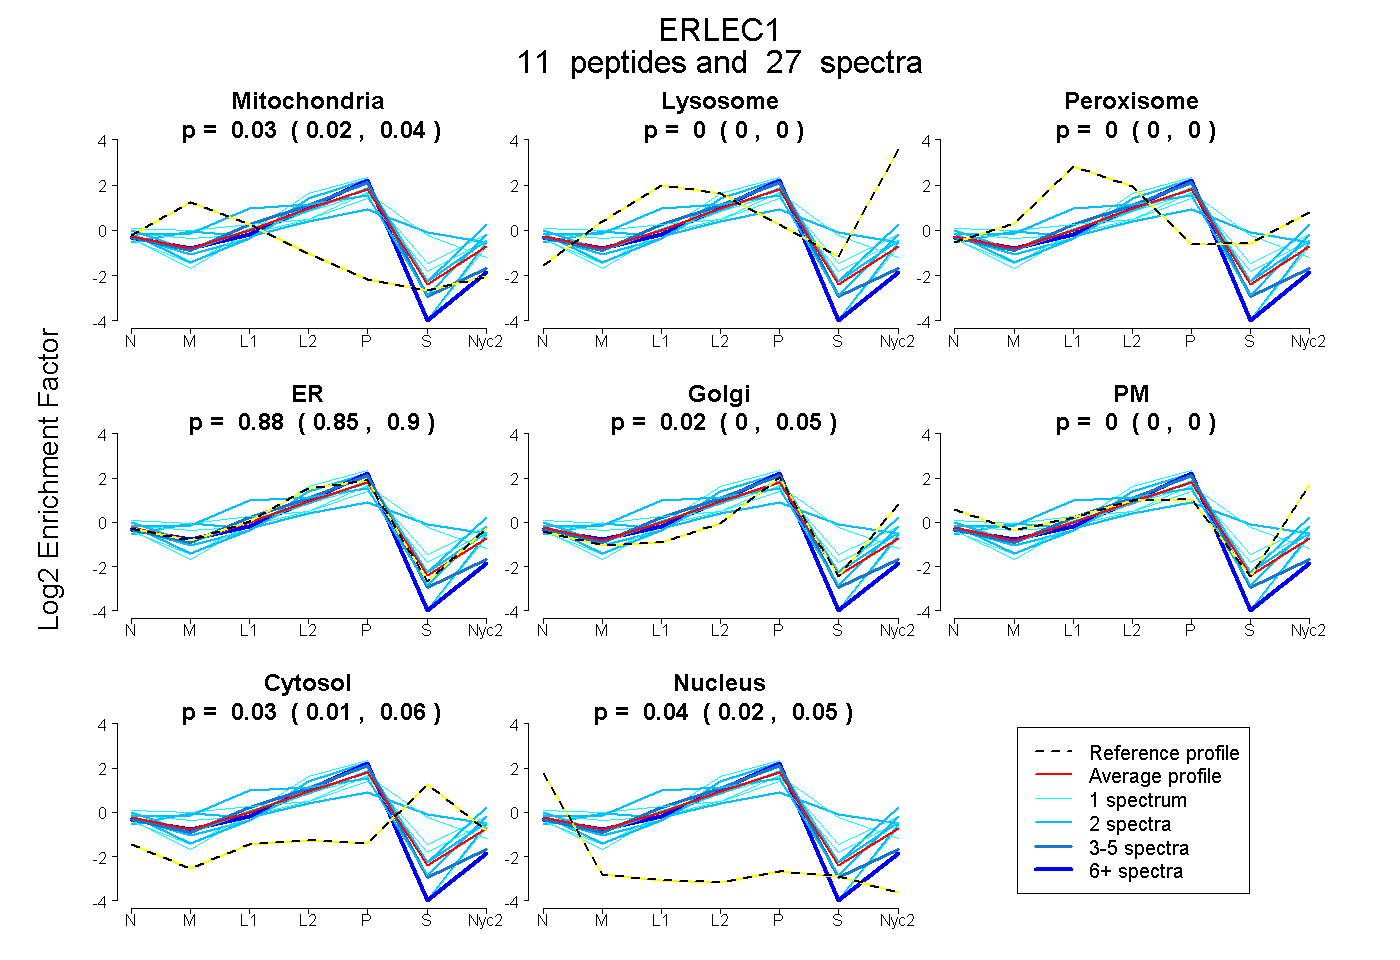
| Expt A |
11 peptides |
27 spectra |
|
0.030 0.016 | 0.043 |
0.000 0.000 | 0.000 |
0.000 0.000 | 0.000 |
0.879 0.848 | 0.899 |
0.021 0.000 | 0.052 |
0.000 0.000 | 0.000 |
0.034 0.005 | 0.056 |
0.037 0.021 | 0.049 |
| 3 spectra, SSTVMYICHPESK | 0.014 | 0.000 | 0.000 | 0.915 | 0.000 | 0.000 | 0.000 | 0.070 | ||
| 2 spectra, QYHEEK | 0.000 | 0.000 | 0.070 | 0.503 | 0.339 | 0.079 | 0.000 | 0.009 | ||
| 1 spectrum, EDNYIIMTTAHK | 0.000 | 0.000 | 0.000 | 0.619 | 0.000 | 0.000 | 0.381 | 0.000 | ||
| 1 spectrum, ELLEPLFK | 0.000 | 0.000 | 0.000 | 0.987 | 0.000 | 0.000 | 0.000 | 0.013 | ||
| 2 spectra, YEFCYGK | 0.084 | 0.003 | 0.116 | 0.734 | 0.000 | 0.063 | 0.000 | 0.000 | ||
| 10 spectra, QSSCSYR | 0.000 | 0.000 | 0.000 | 0.895 | 0.000 | 0.000 | 0.000 | 0.105 | ||
| 1 spectrum, MVSHFYGNGDICDITDKPR | 0.016 | 0.000 | 0.107 | 0.528 | 0.247 | 0.000 | 0.102 | 0.000 | ||
| 2 spectra, AYHLQDDGTQTVR | 0.038 | 0.000 | 0.201 | 0.325 | 0.122 | 0.000 | 0.314 | 0.000 | ||
| 2 spectra, ALPQLSDDIPFR | 0.000 | 0.000 | 0.000 | 0.969 | 0.000 | 0.000 | 0.000 | 0.031 | ||
| 2 spectra, SLLYEK | 0.000 | 0.000 | 0.000 | 0.794 | 0.133 | 0.000 | 0.046 | 0.027 | ||
| 1 spectrum, VNIHEYYLGNMLAK | 0.172 | 0.000 | 0.119 | 0.440 | 0.266 | 0.000 | 0.003 | 0.000 |
| Plot | Mito | Lyso or Perox | ER | Golgi | PM | Cytosol | Nucleus | ||||||
| Expt B |
4 peptides |
9 spectra |
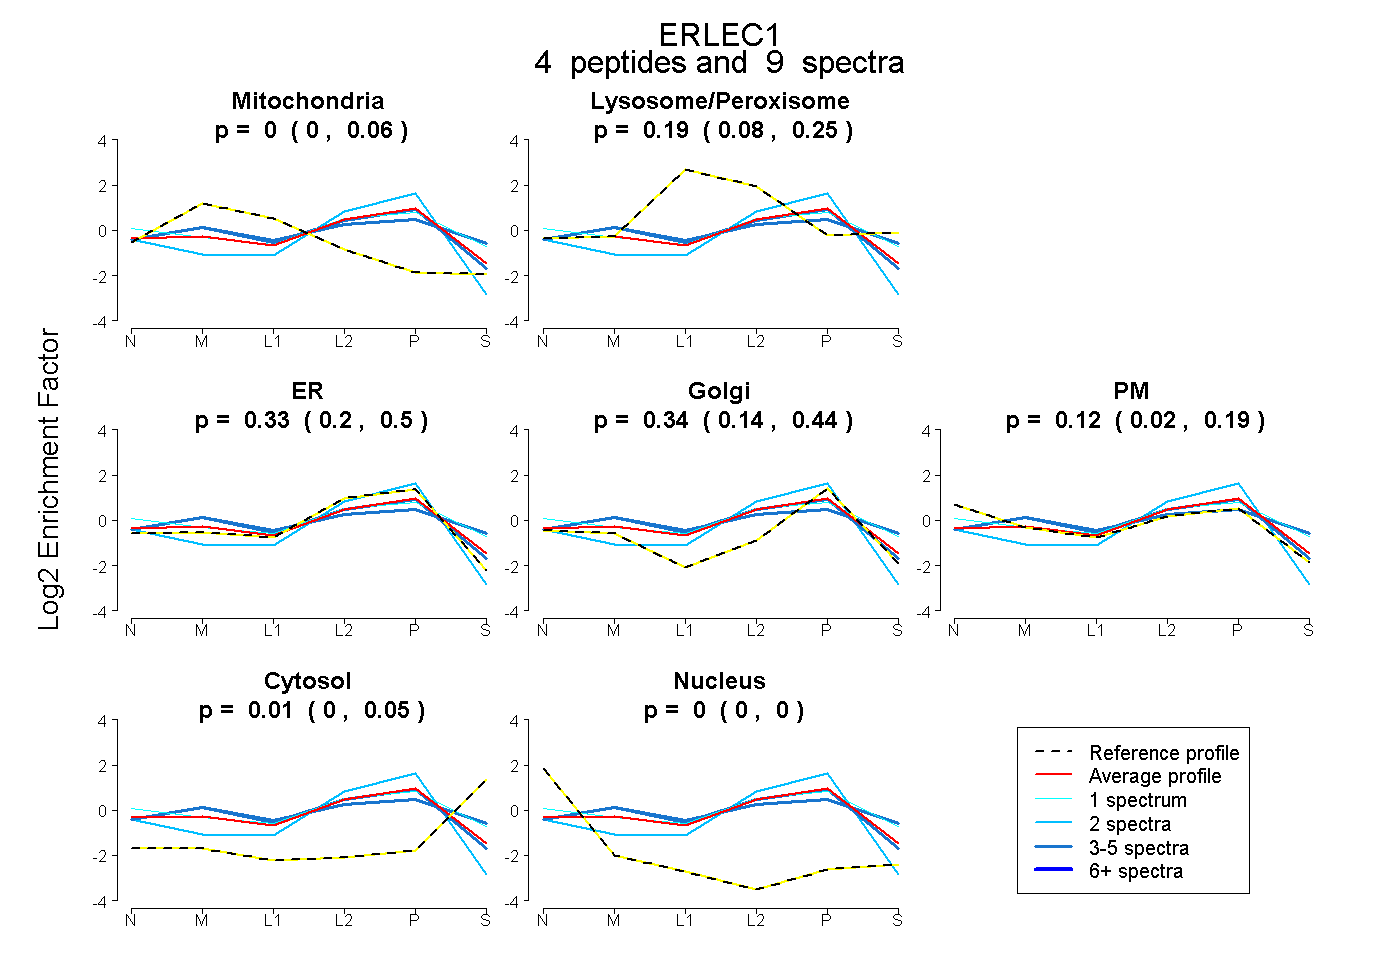 |
0.004 0.000 | 0.063 |
0.192 0.081 | 0.251 |
0.332 0.197 | 0.496 |
0.338 0.140 | 0.439 |
0.123 0.018 | 0.190 |
0.011 0.000 | 0.054 |
0.000 0.000 | 0.000 |
|||
| Plot | Lyso | Other | |||||||||||
| Expt C |
11 peptides |
26 spectra |
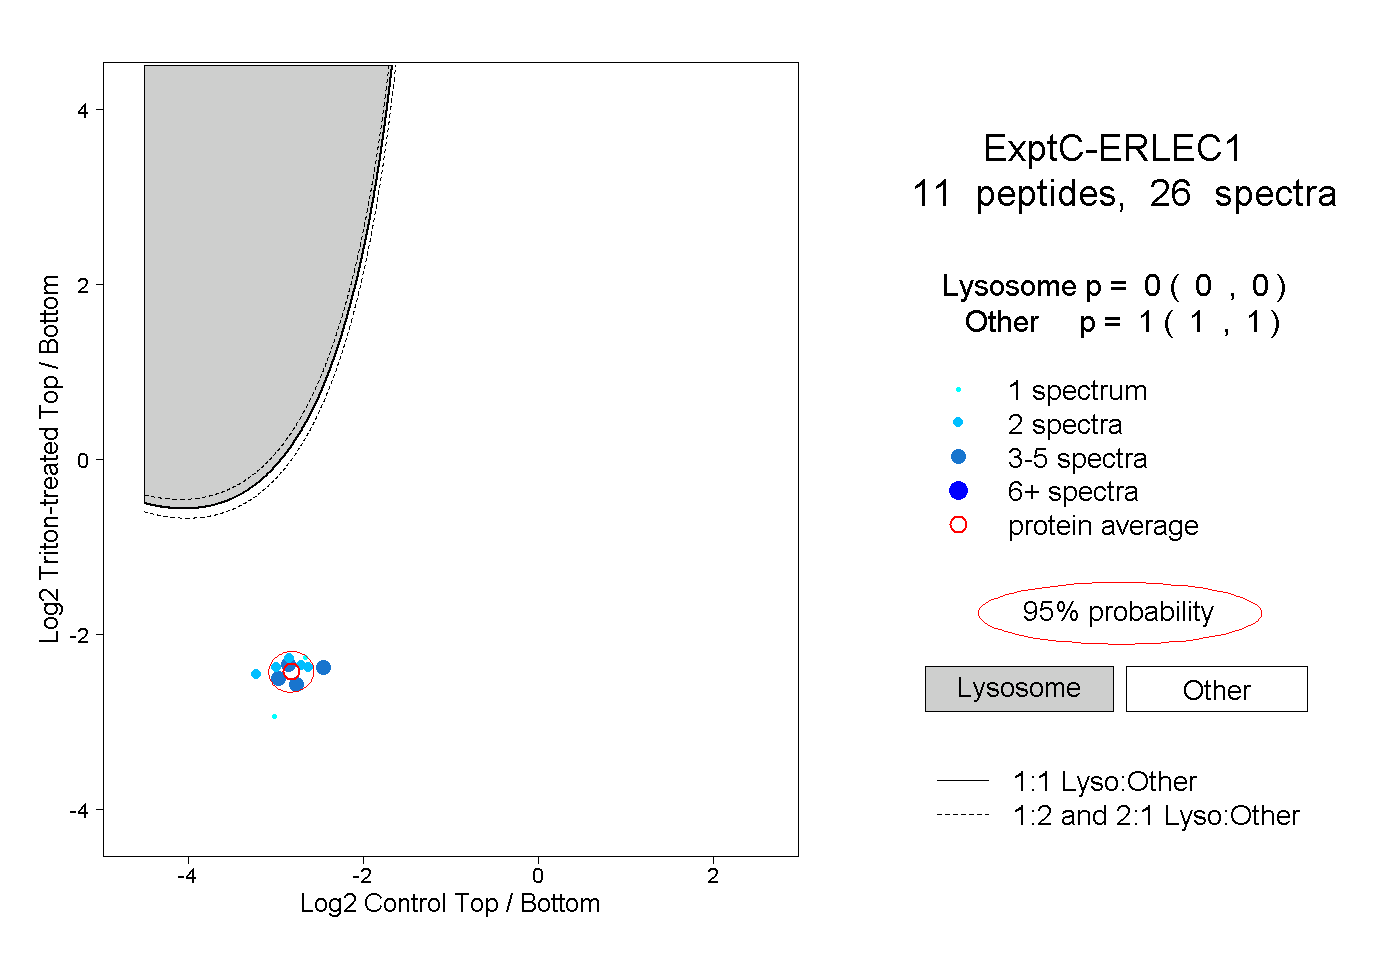 |
0.000 0.000 | 0.000 |
1.000 1.000 | 1.000 |
||||||||
| Plot | Lyso | Other | |||||||||||
| Expt D |
2 peptides |
5 spectra |
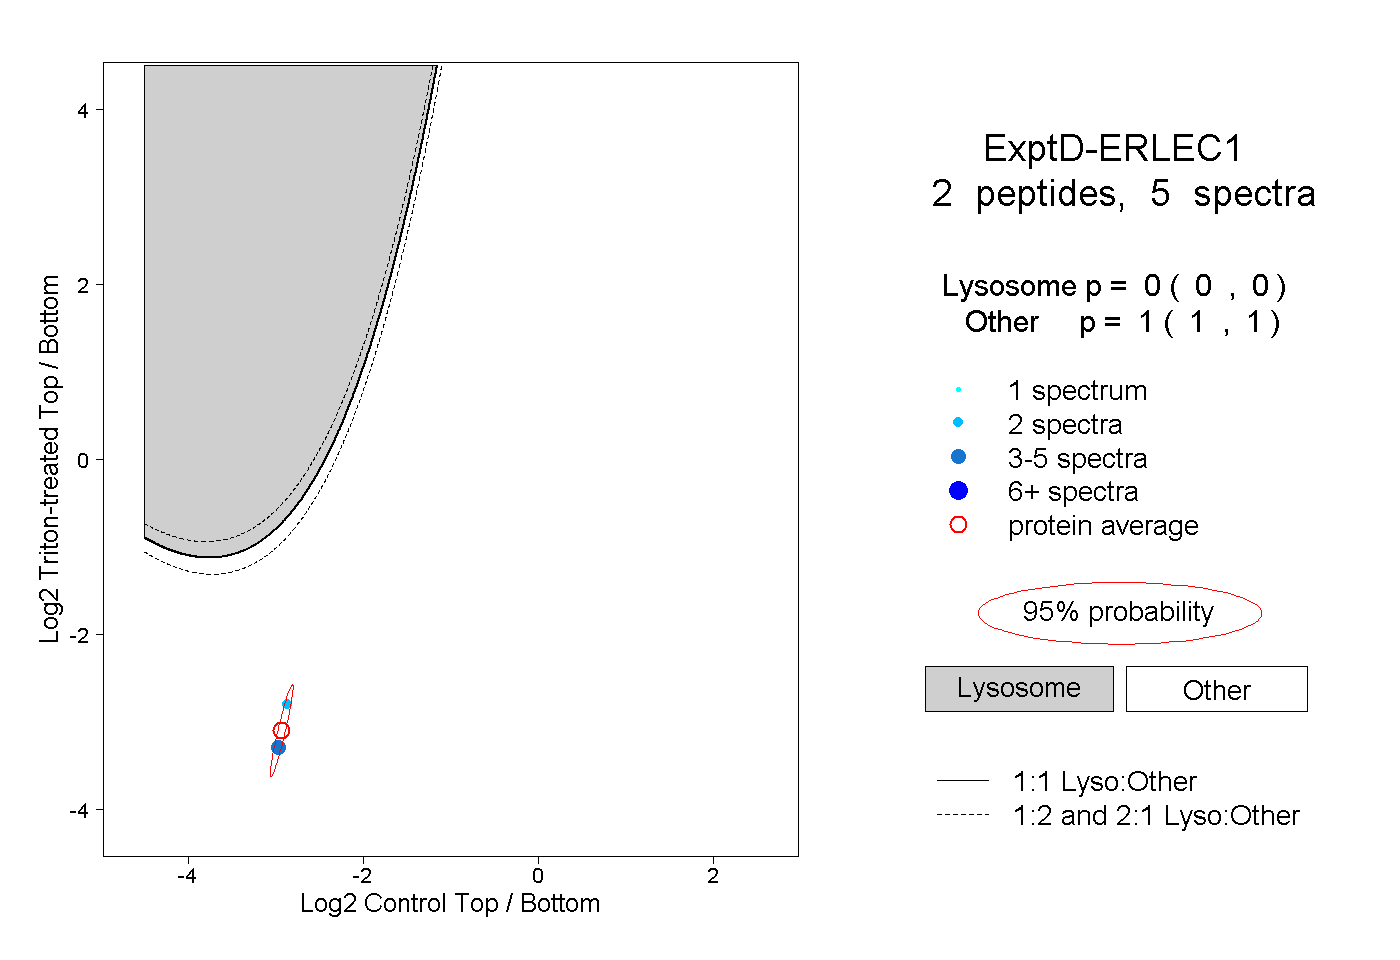 |
0.000 0.000 | 0.000 |
1.000 1.000 | 1.000 |