 17
17peptides
spectra
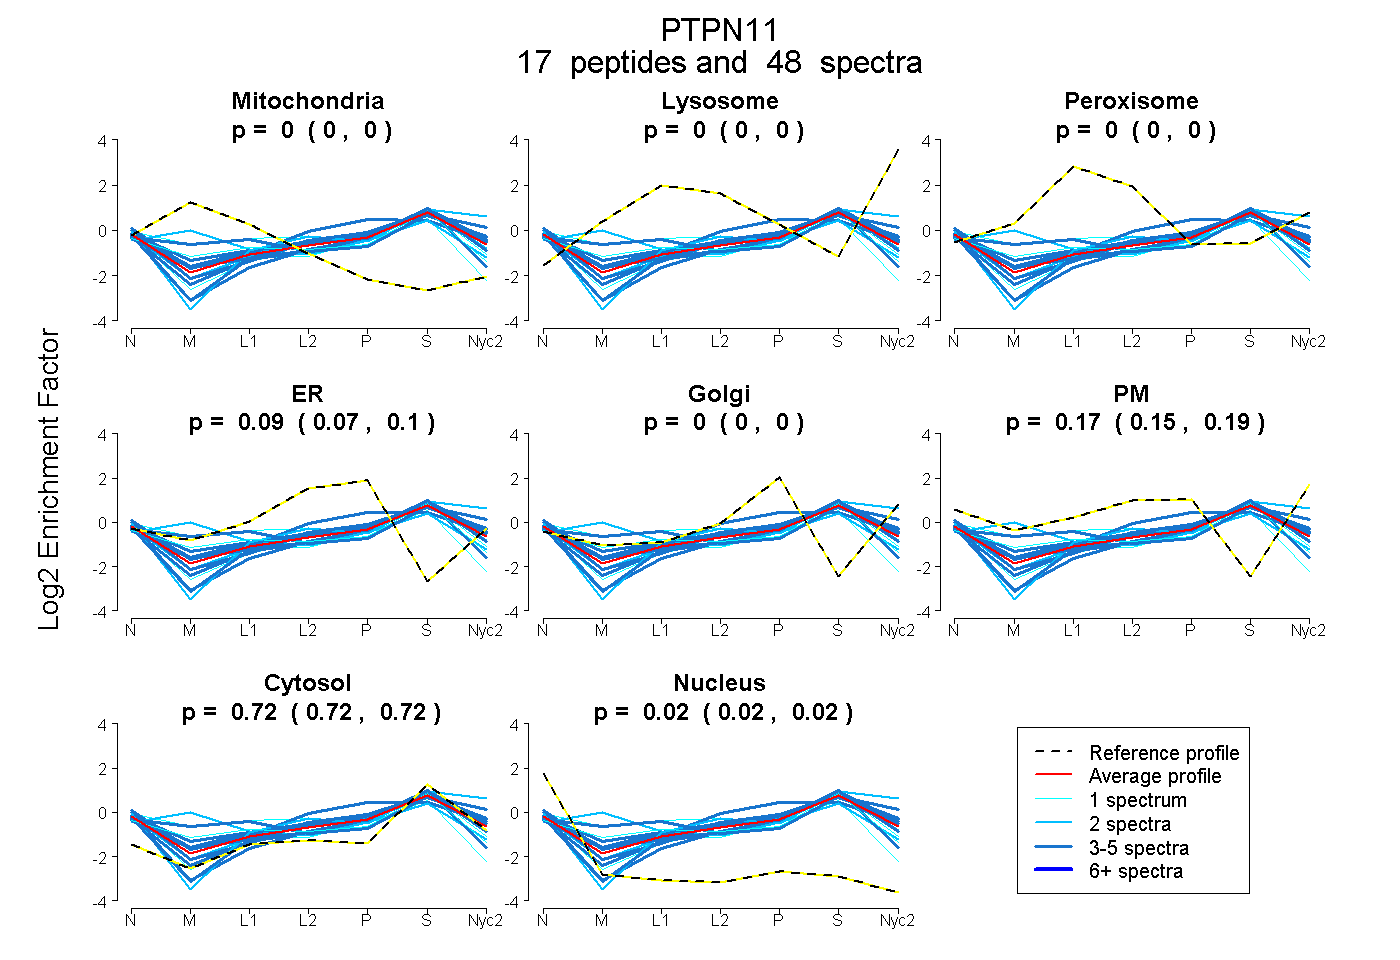
0.000 | 0.000
0.000 | 0.000
0.000 | 0.004
0.072 | 0.098
0.000 | 0.000
0.155 | 0.185
0.717 | 0.724
0.018 | 0.024
4peptides
spectra
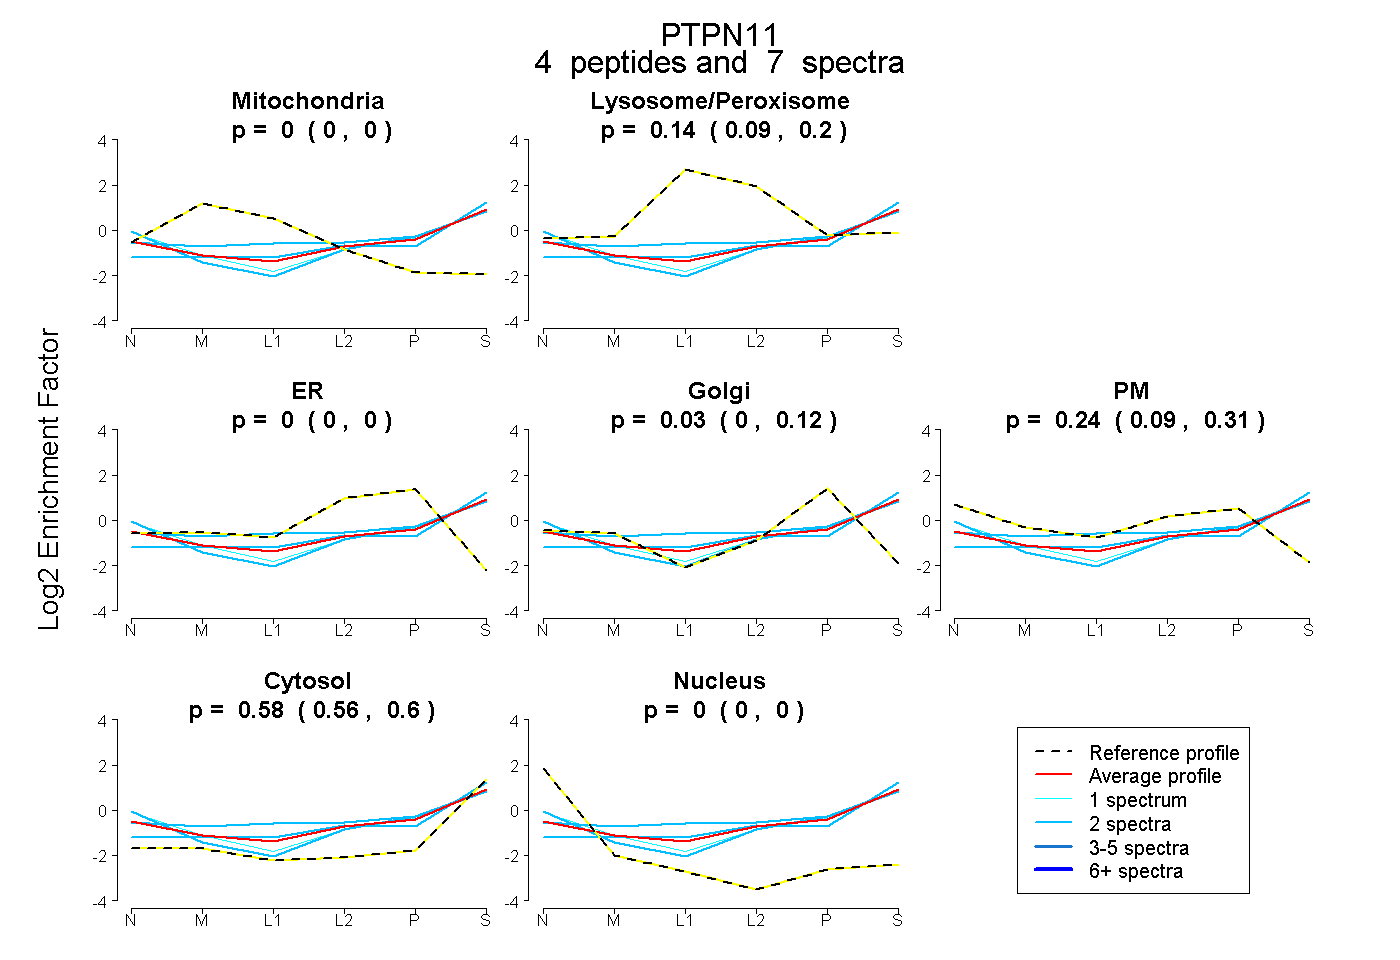
0.000 | 0.000
0.094 | 0.195
0.000 | 0.000
0.000 | 0.123
0.091 | 0.313
0.558 | 0.596
0.000 | 0.000
12peptides
spectra
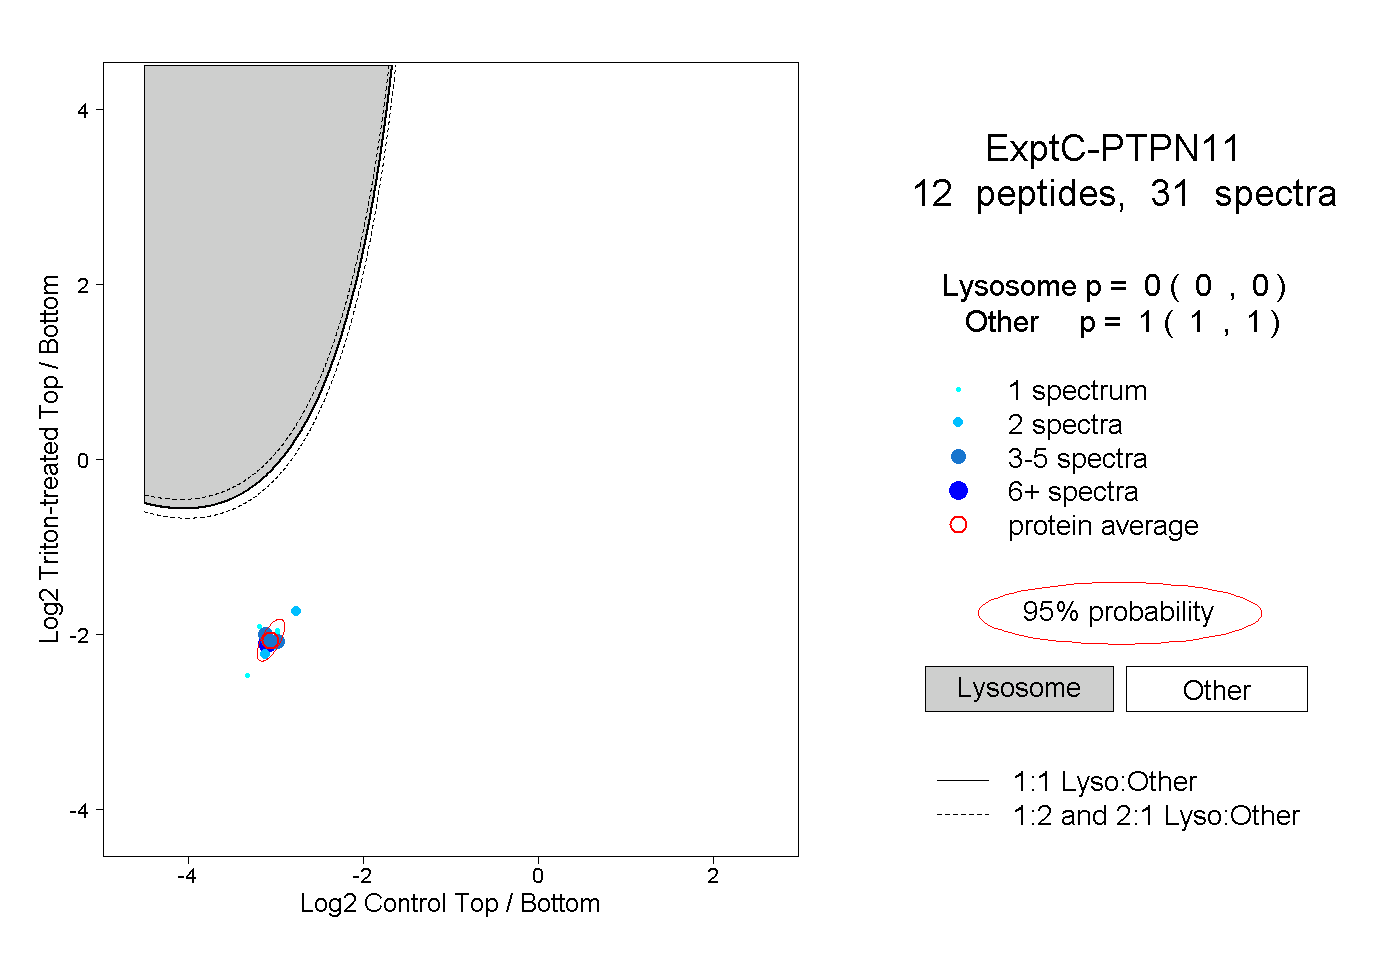
0.000 | 0.000
1.000 | 1.000
1peptide
spectrum
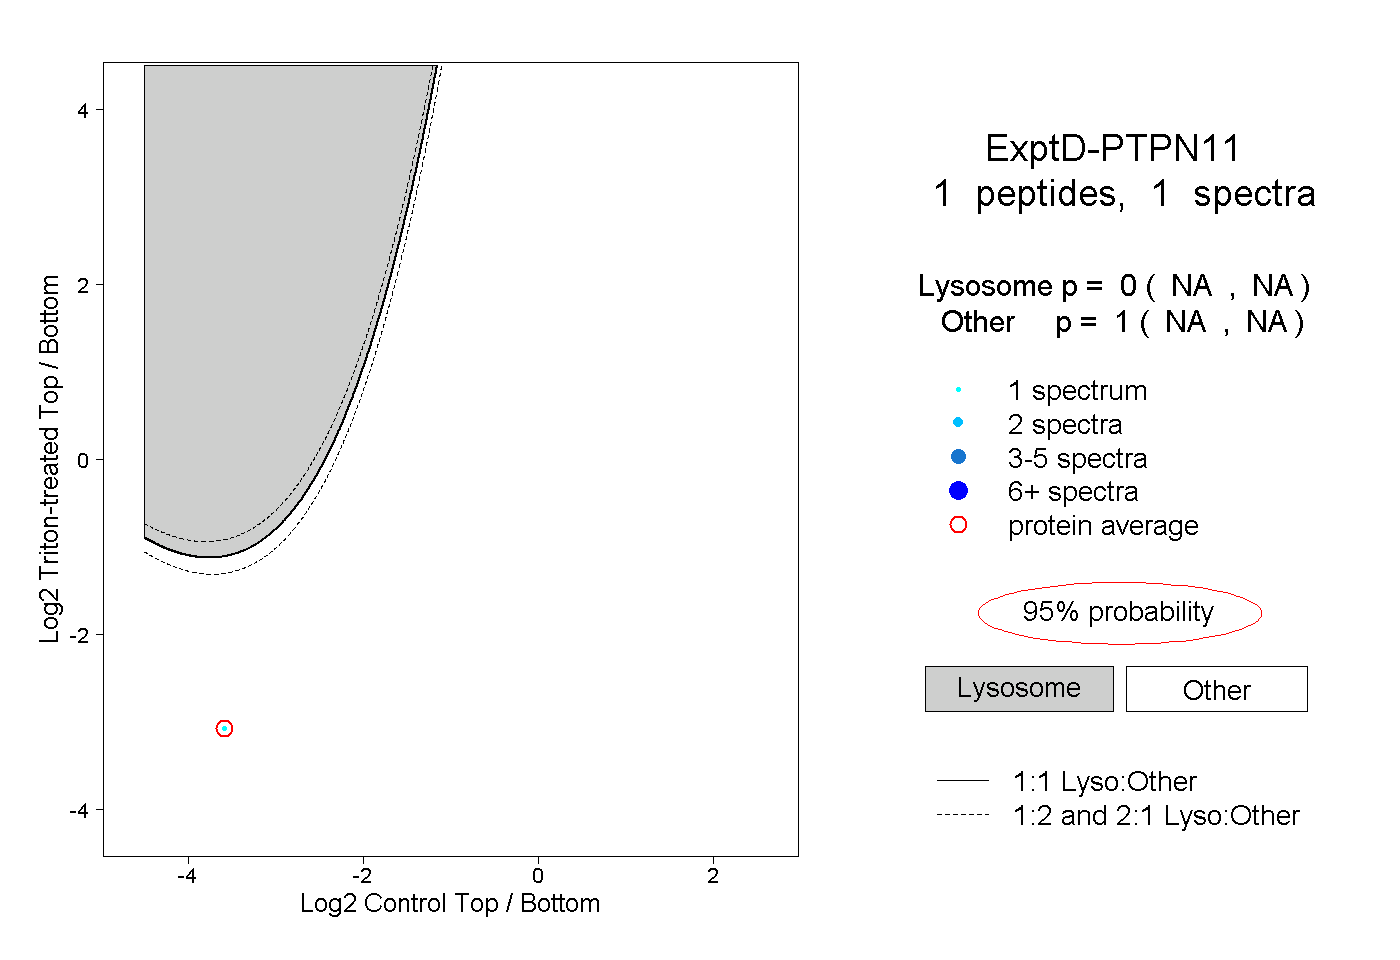
NA | NA
NA | NA