 17
17peptides
spectra
0.000 | 0.000
0.000 | 0.000
0.000 | 0.004
0.072 | 0.098
0.000 | 0.000
0.155 | 0.185
0.717 | 0.724
0.018 | 0.024
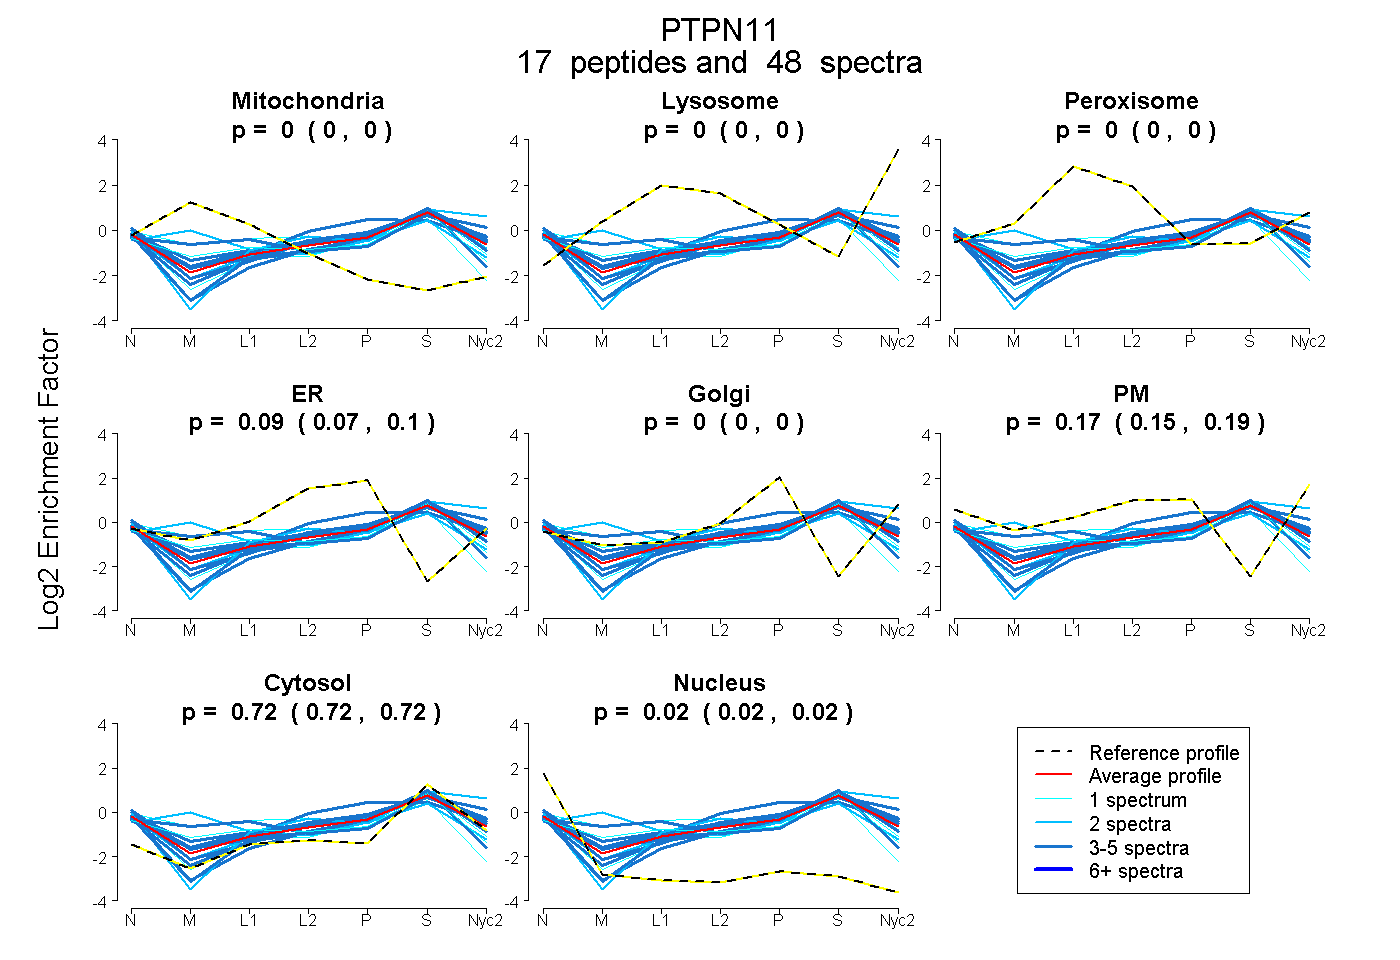
| Plot | Mito | Lyso | Perox | ER | Golgi | PM | Cytosol | Nucleus | |||||
| Expt A |
17 peptides |
48 spectra |
|
0.000 0.000 | 0.000 |
0.000 0.000 | 0.000 |
0.000 0.000 | 0.004 |
0.086 0.072 | 0.098 |
0.000 0.000 | 0.000 |
0.172 0.155 | 0.185 |
0.721 0.717 | 0.724 |
0.021 0.018 | 0.024 |
| 4 spectra, TVWQYHFR | 0.000 | 0.000 | 0.020 | 0.002 | 0.000 | 0.317 | 0.661 | 0.000 | ||
| 1 spectrum, LAETTDK | 0.000 | 0.000 | 0.000 | 0.000 | 0.083 | 0.120 | 0.770 | 0.028 | ||
| 5 spectra, SGMVQTEAQYR | 0.000 | 0.000 | 0.000 | 0.000 | 0.076 | 0.131 | 0.781 | 0.012 | ||
| 2 spectra, SNPGDFTLSVR | 0.310 | 0.000 | 0.051 | 0.000 | 0.130 | 0.000 | 0.510 | 0.000 | ||
| 4 spectra, QPLNTTR | 0.000 | 0.000 | 0.000 | 0.064 | 0.084 | 0.000 | 0.780 | 0.072 | ||
| 2 spectra, VIVMTTK | 0.000 | 0.000 | 0.000 | 0.000 | 0.000 | 0.255 | 0.745 | 0.000 | ||
| 4 spectra, VGQGNTER | 0.000 | 0.000 | 0.000 | 0.045 | 0.000 | 0.201 | 0.722 | 0.032 | ||
| 5 spectra, HGSFLVR | 0.000 | 0.000 | 0.032 | 0.004 | 0.000 | 0.275 | 0.689 | 0.000 | ||
| 4 spectra, VTHVMIR | 0.000 | 0.000 | 0.000 | 0.125 | 0.001 | 0.166 | 0.707 | 0.000 | ||
| 1 spectrum, GVDCDIDVPK | 0.000 | 0.000 | 0.000 | 0.118 | 0.017 | 0.023 | 0.770 | 0.073 | ||
| 2 spectra, MVFQENSR | 0.000 | 0.000 | 0.000 | 0.099 | 0.011 | 0.101 | 0.750 | 0.039 | ||
| 3 spectra, NGDVIELK | 0.000 | 0.000 | 0.000 | 0.247 | 0.005 | 0.163 | 0.584 | 0.000 | ||
| 1 spectrum, YWPDECALK | 0.145 | 0.000 | 0.069 | 0.100 | 0.000 | 0.000 | 0.676 | 0.010 | ||
| 3 spectra, YPLNCADPTSER | 0.000 | 0.000 | 0.000 | 0.134 | 0.000 | 0.000 | 0.772 | 0.094 | ||
| 3 spectra, FDSLTDLVEHYK | 0.000 | 0.000 | 0.009 | 0.000 | 0.000 | 0.290 | 0.701 | 0.000 | ||
| 3 spectra, YDVGGGER | 0.107 | 0.088 | 0.081 | 0.000 | 0.000 | 0.135 | 0.589 | 0.000 | ||
| 1 spectrum, ESAAHDYTLR | 0.237 | 0.000 | 0.103 | 0.130 | 0.000 | 0.000 | 0.500 | 0.030 |
| Plot | Mito | Lyso or Perox | ER | Golgi | PM | Cytosol | Nucleus | ||||||
| Expt B |
4 peptides |
7 spectra |
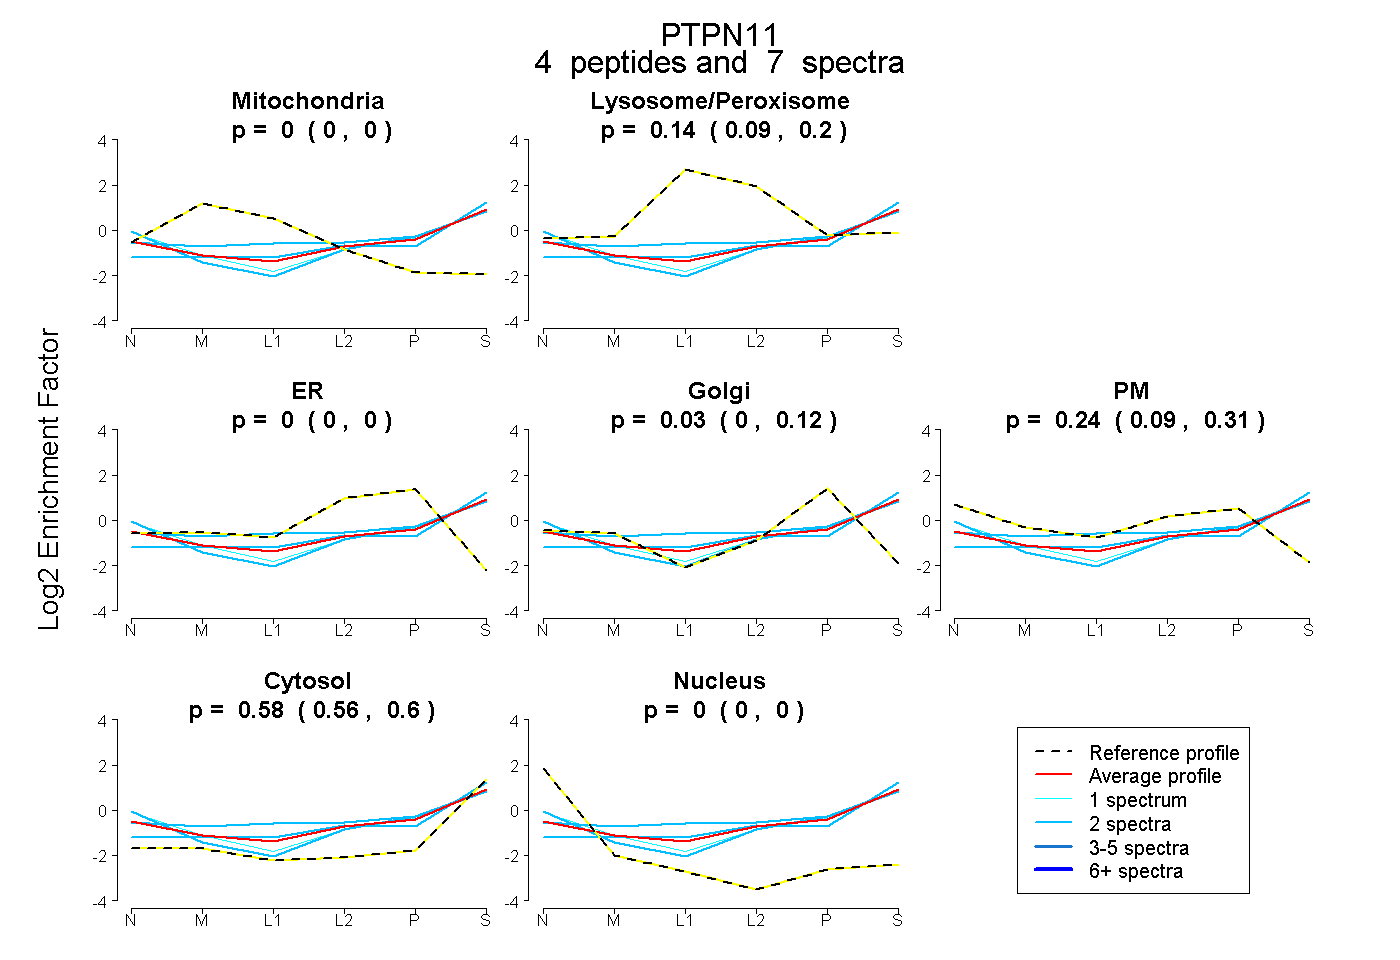 |
0.000 0.000 | 0.000 |
0.143 0.094 | 0.195 |
0.000 0.000 | 0.000 |
0.034 0.000 | 0.123 |
0.242 0.091 | 0.313 |
0.581 0.558 | 0.596 |
0.000 0.000 | 0.000 |
|||
| Plot | Lyso | Other | |||||||||||
| Expt C |
12 peptides |
31 spectra |
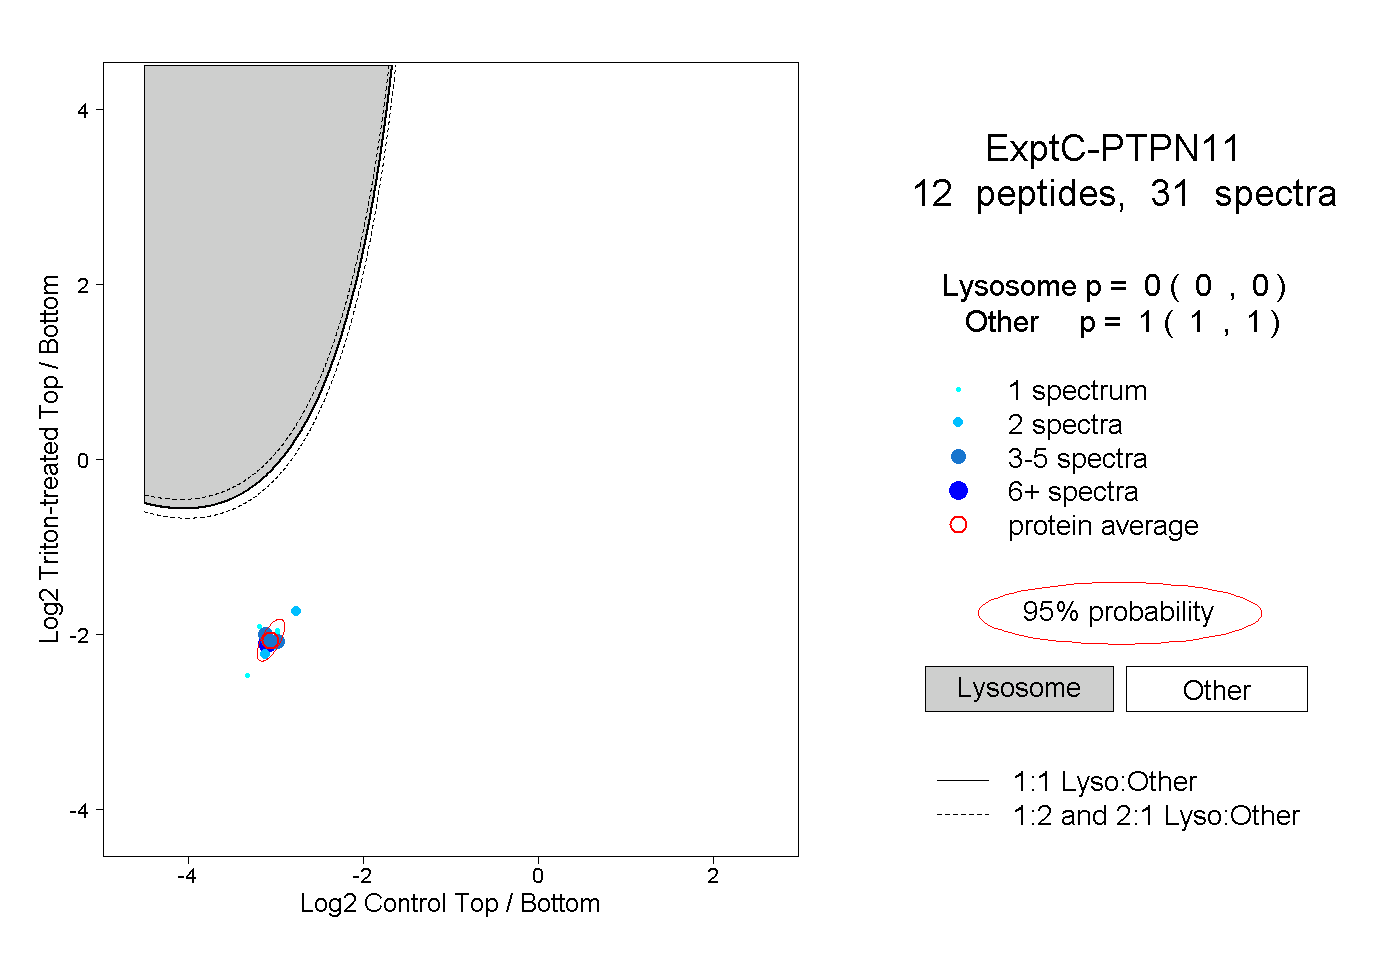 |
0.000 0.000 | 0.000 |
1.000 1.000 | 1.000 |
||||||||
| Plot | Lyso | Other | |||||||||||
| Expt D |
1 peptide |
1 spectrum |
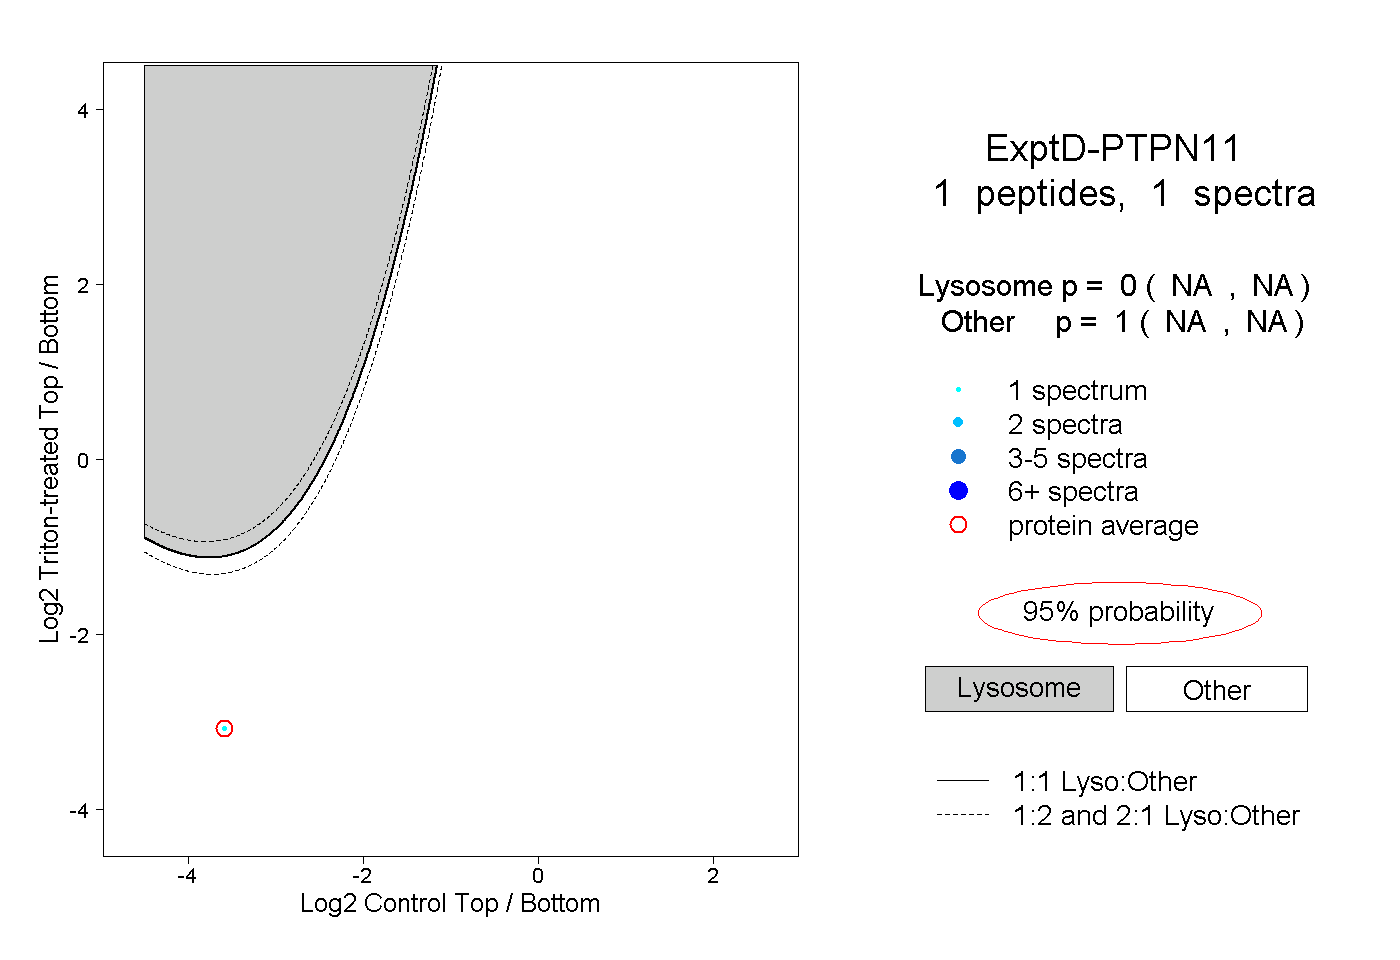 |
0.000 NA | NA |
1.000 NA | NA |