PTPN11
[ENSRNOP00000041842]
Main page
| | | Plot |
Mito |
Lyso |
|
Perox |
ER |
Golgi |
PM |
Cytosol |
Nucleus |
|
| Expt A |
 17
17
peptides |
48
spectra |
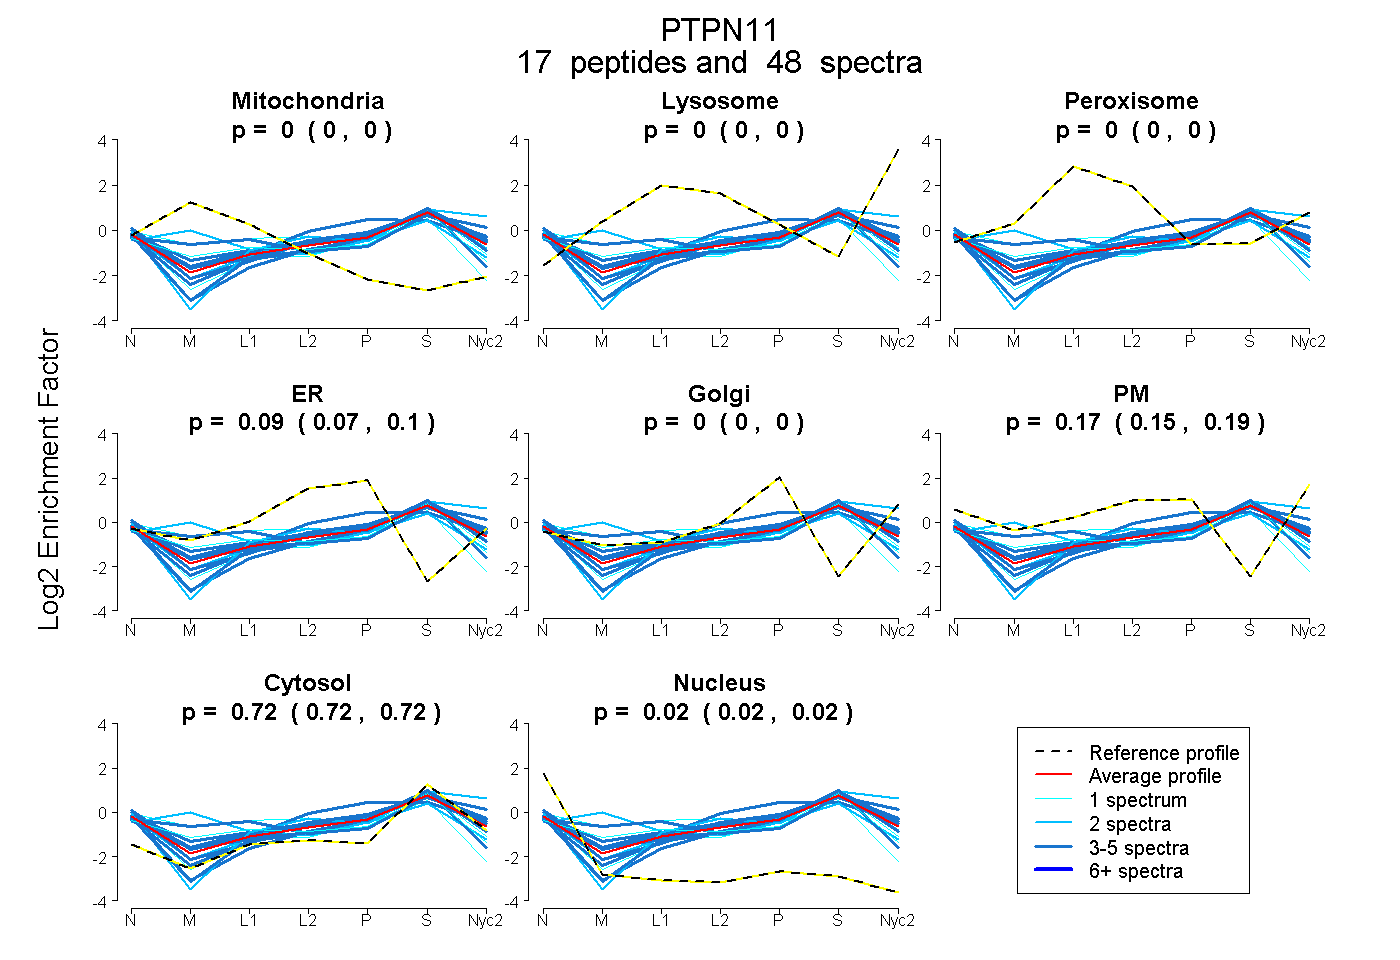 |
0.000
0.000 | 0.000 |
0.000
0.000 | 0.000 |
|
0.000
0.000 | 0.004 |
0.086
0.072 | 0.098 |
0.000
0.000 | 0.000 |
0.172
0.155 | 0.185 |
0.721
0.717 | 0.724 |
0.021
0.018 | 0.024 |
|
| | | Plot |
Mito |
|
Lyso or Perox |
|
ER |
Golgi |
PM |
Cytosol |
Nucleus |
|
| Expt B |
4
peptides |
7
spectra |
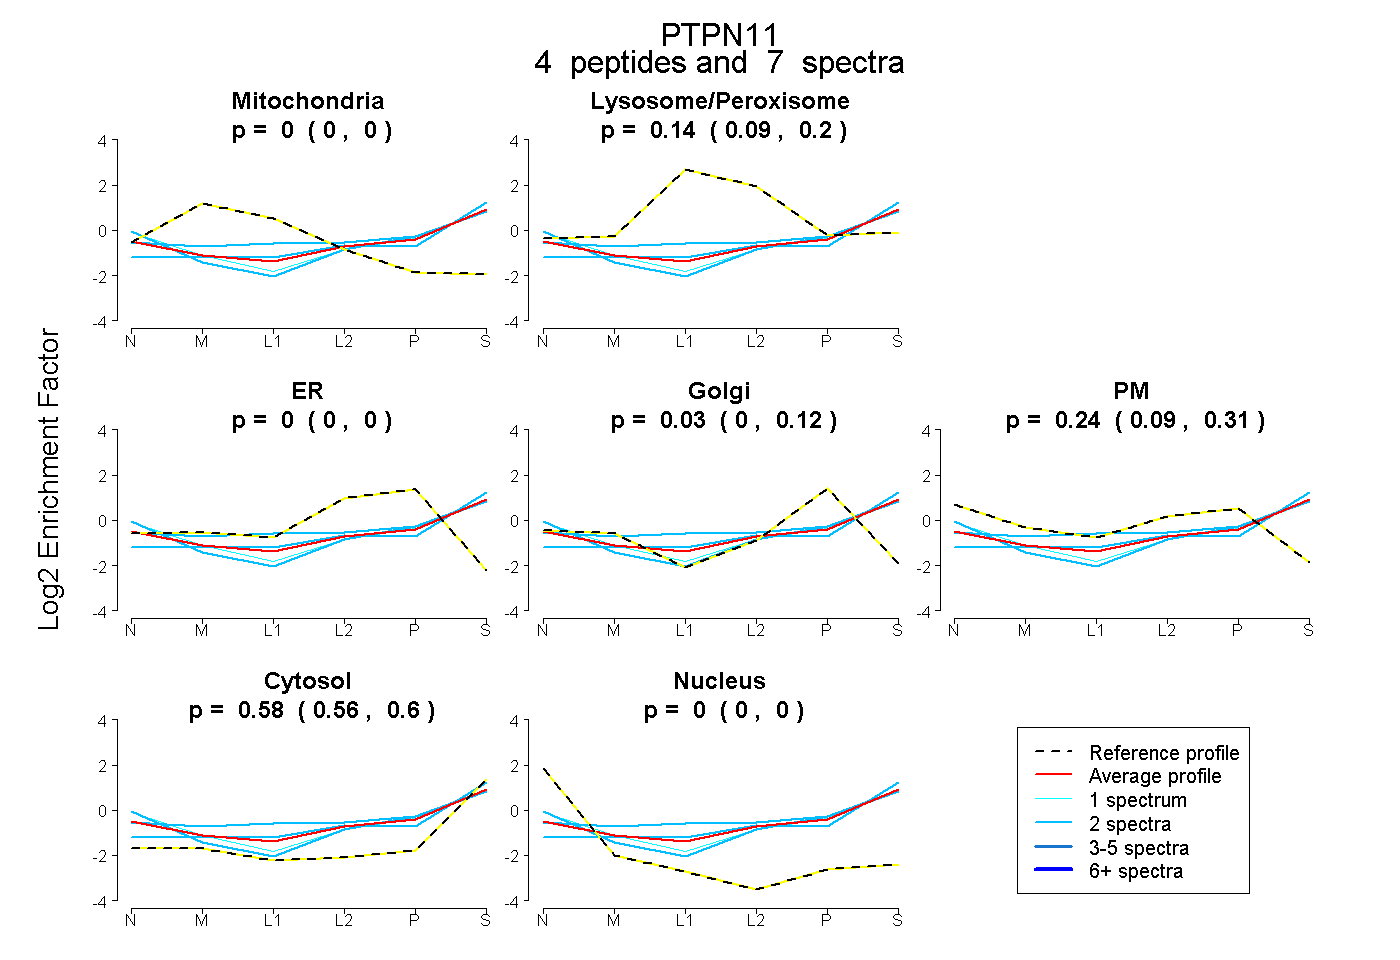 |
0.000
0.000 | 0.000 |
|
0.143
0.094 | 0.195 |
|
0.000
0.000 | 0.000 |
0.034
0.000 | 0.123 |
0.242
0.091 | 0.313 |
0.581
0.558 | 0.596 |
0.000
0.000 | 0.000 |
|
| 2 spectra, QPLNTTR |
0.000 |
|
0.000 |
|
0.000 |
0.000 |
0.409 |
0.591 |
0.000 |
|
| 1 spectrum, INAAEIESR |
0.000 |
|
0.021 |
|
0.000 |
0.000 |
0.404 |
0.575 |
0.000 |
|
| 2 spectra, NILPFDHTR |
0.000 |
|
0.322 |
|
0.000 |
0.132 |
0.072 |
0.473 |
0.000 |
|
| 2 spectra, VTHVMIR |
0.000 |
|
0.225 |
|
0.075 |
0.020 |
0.000 |
0.680 |
0.000 |
|
| | | Plot |
|
Lyso |
|
|
|
|
|
|
|
Other |
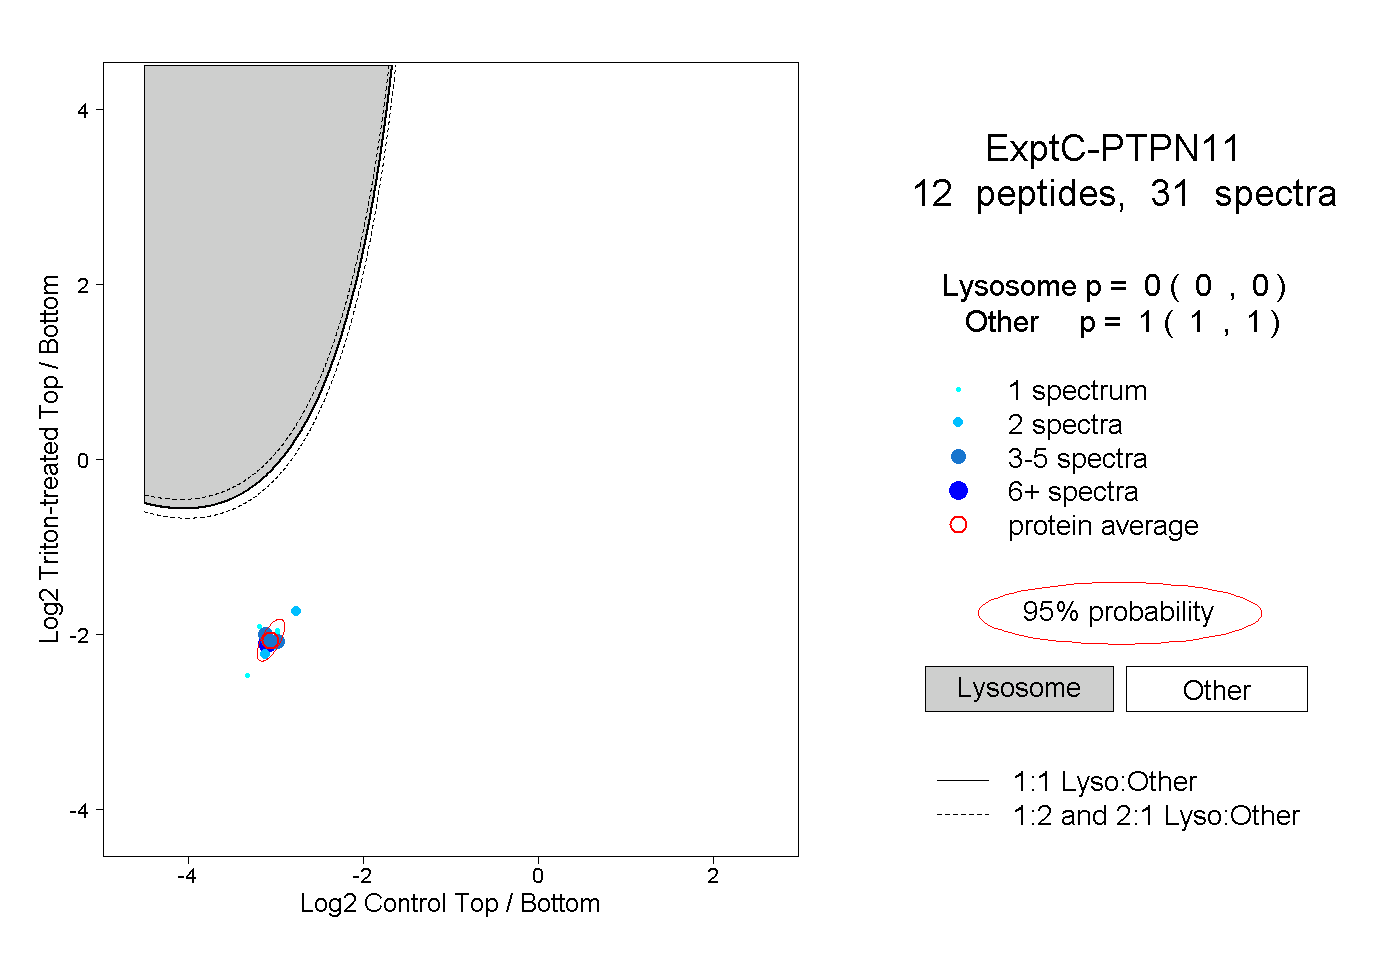
| Expt C |
12
peptides |
31
spectra |
 |
|
0.000
0.000 | 0.000 |
|
|
|
|
|
|
|
1.000
1.000 | 1.000 |
| | | Plot |
|
Lyso |
|
|
|
|
|
|
|
Other |
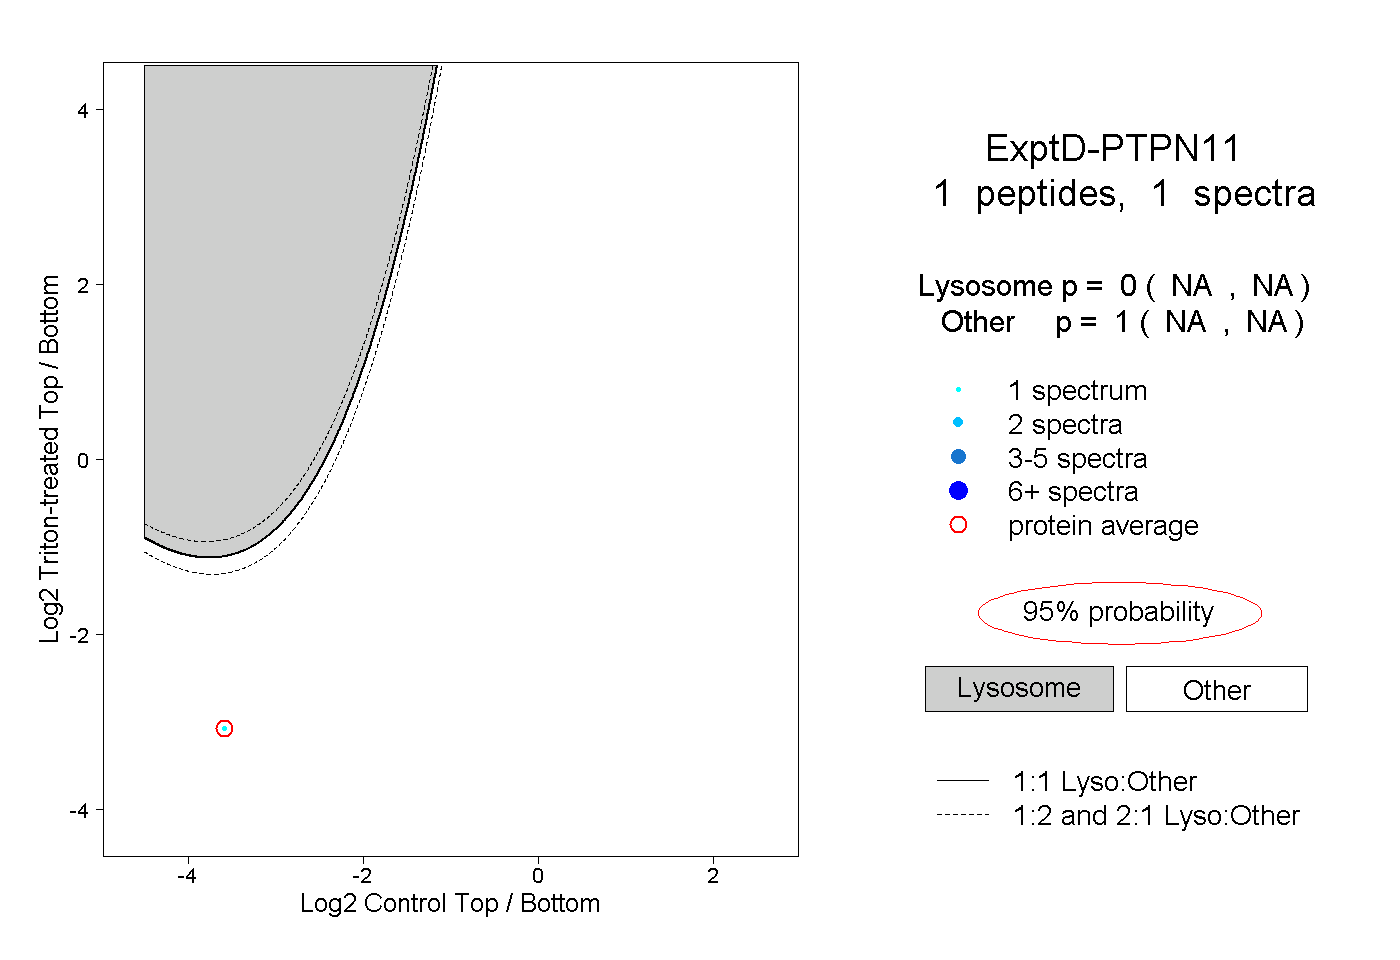
| Expt D |
1
peptide |
1
spectrum |
 |
|
0.000
NA | NA |
|
|
|
|
|
|
|
1.000
NA | NA |