 40
40peptides
spectra
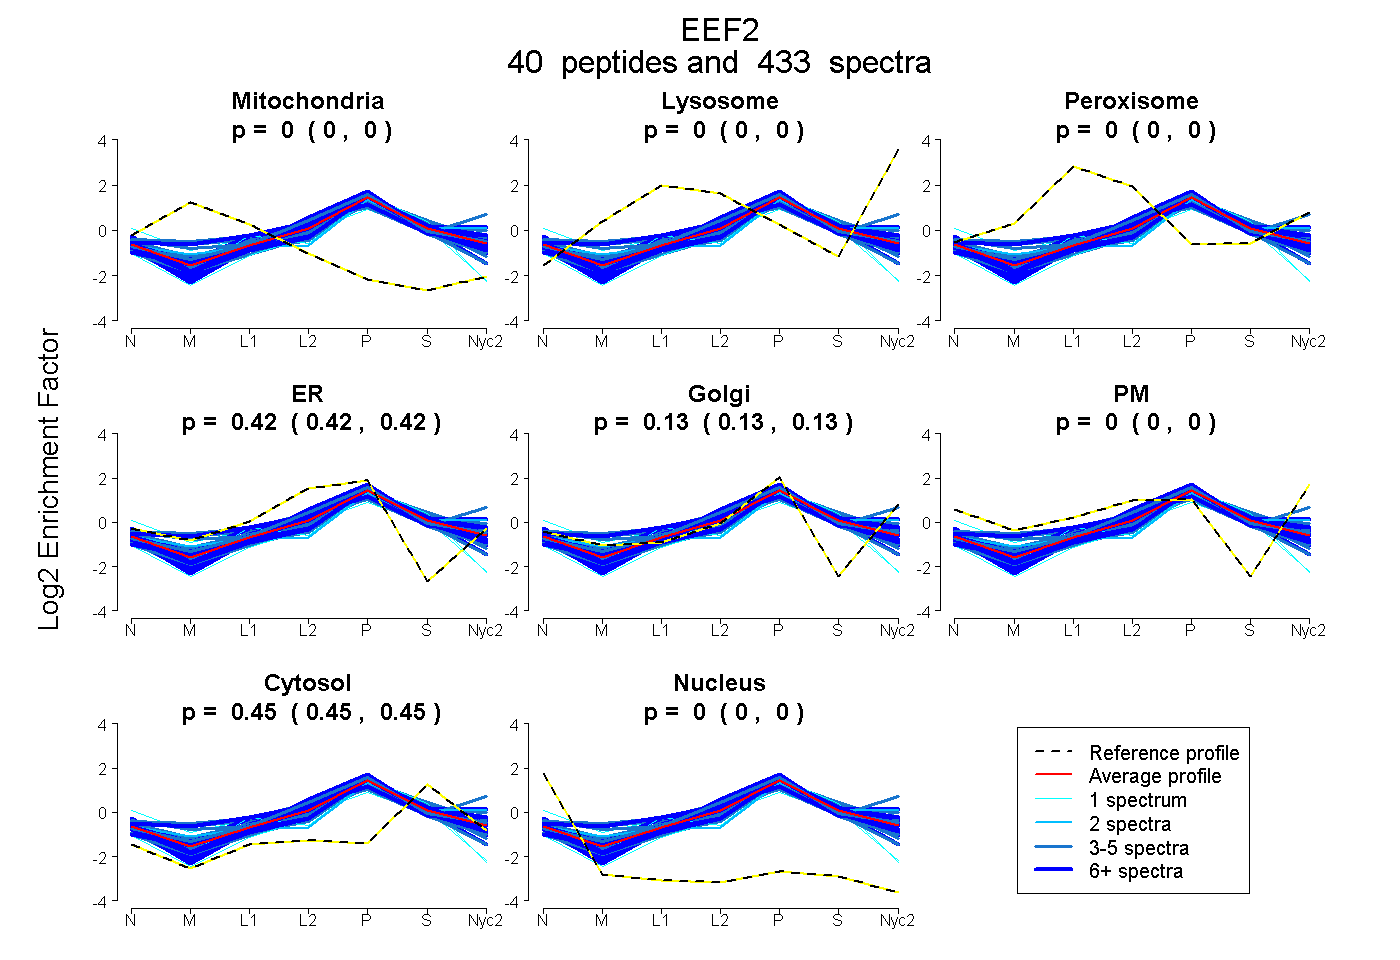
0.000 | 0.000
0.000 | 0.000
0.000 | 0.000
0.417 | 0.421
0.127 | 0.132
0.000 | 0.000
0.450 | 0.451
0.000 | 0.000
31peptides
spectra
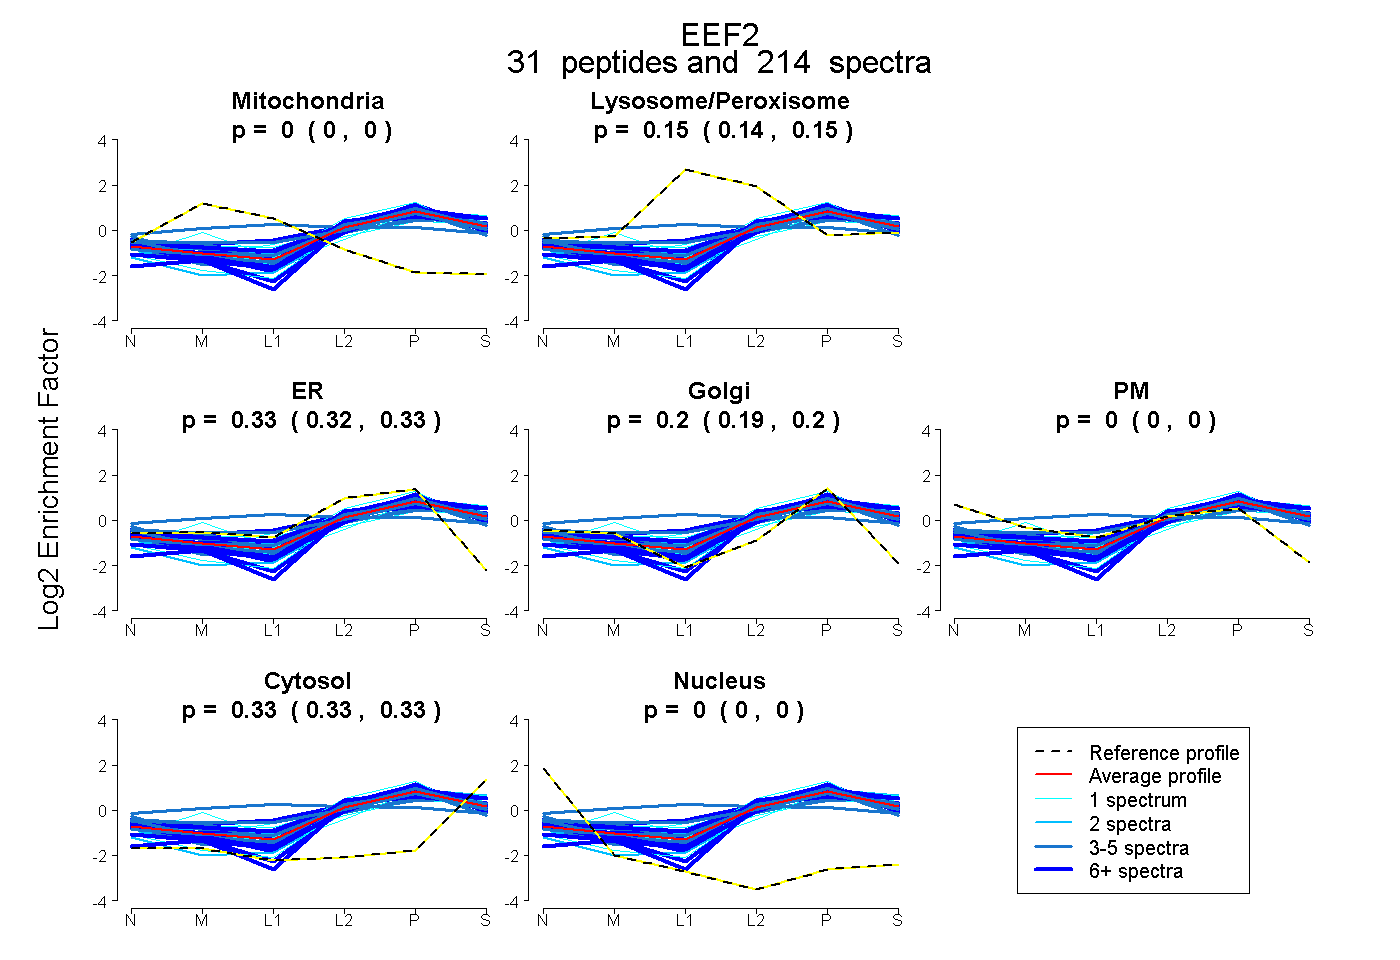
0.000 | 0.000
0.144 | 0.152
0.318 | 0.332
0.191 | 0.203
0.000 | 0.000
0.326 | 0.331
0.000 | 0.000
39peptides
spectra
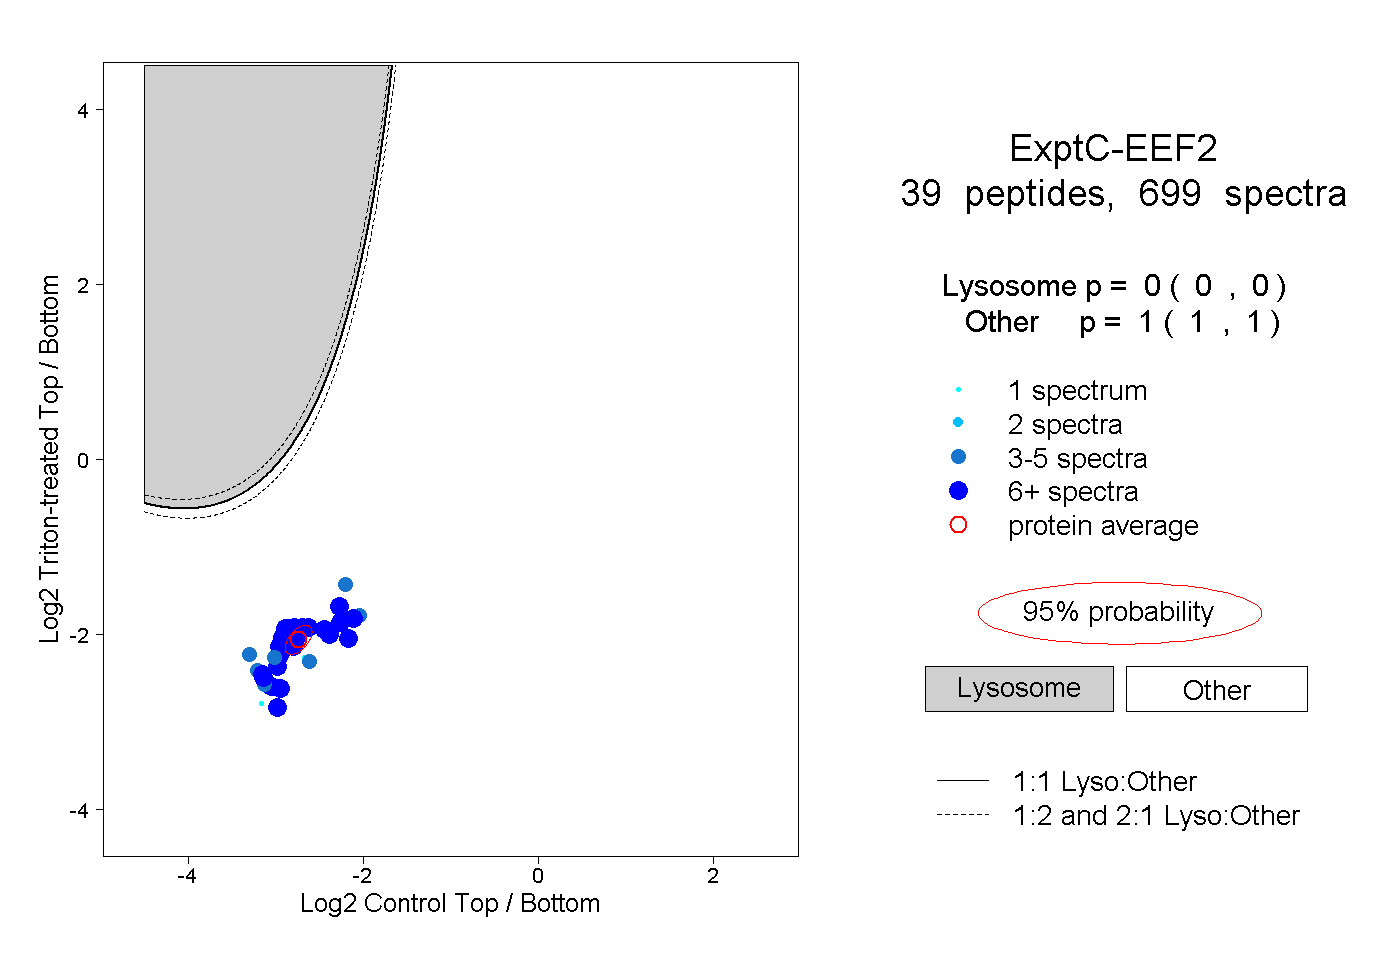
0.000 | 0.000
1.000 | 1.000
23peptides
spectra
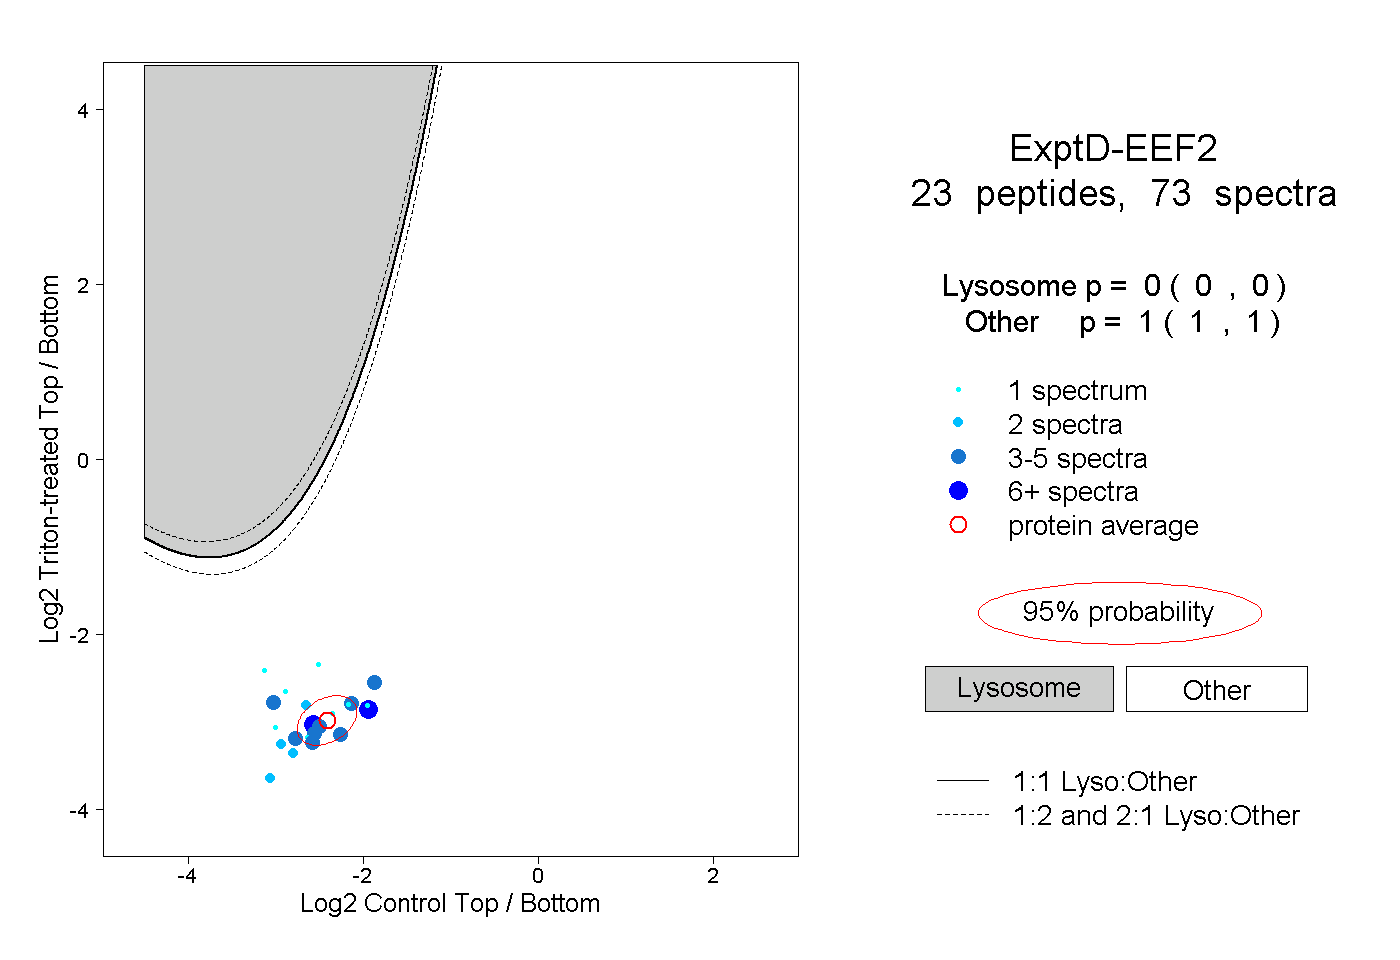
0.000 | 0.000
1.000 | 1.000