 12
12peptides
spectra
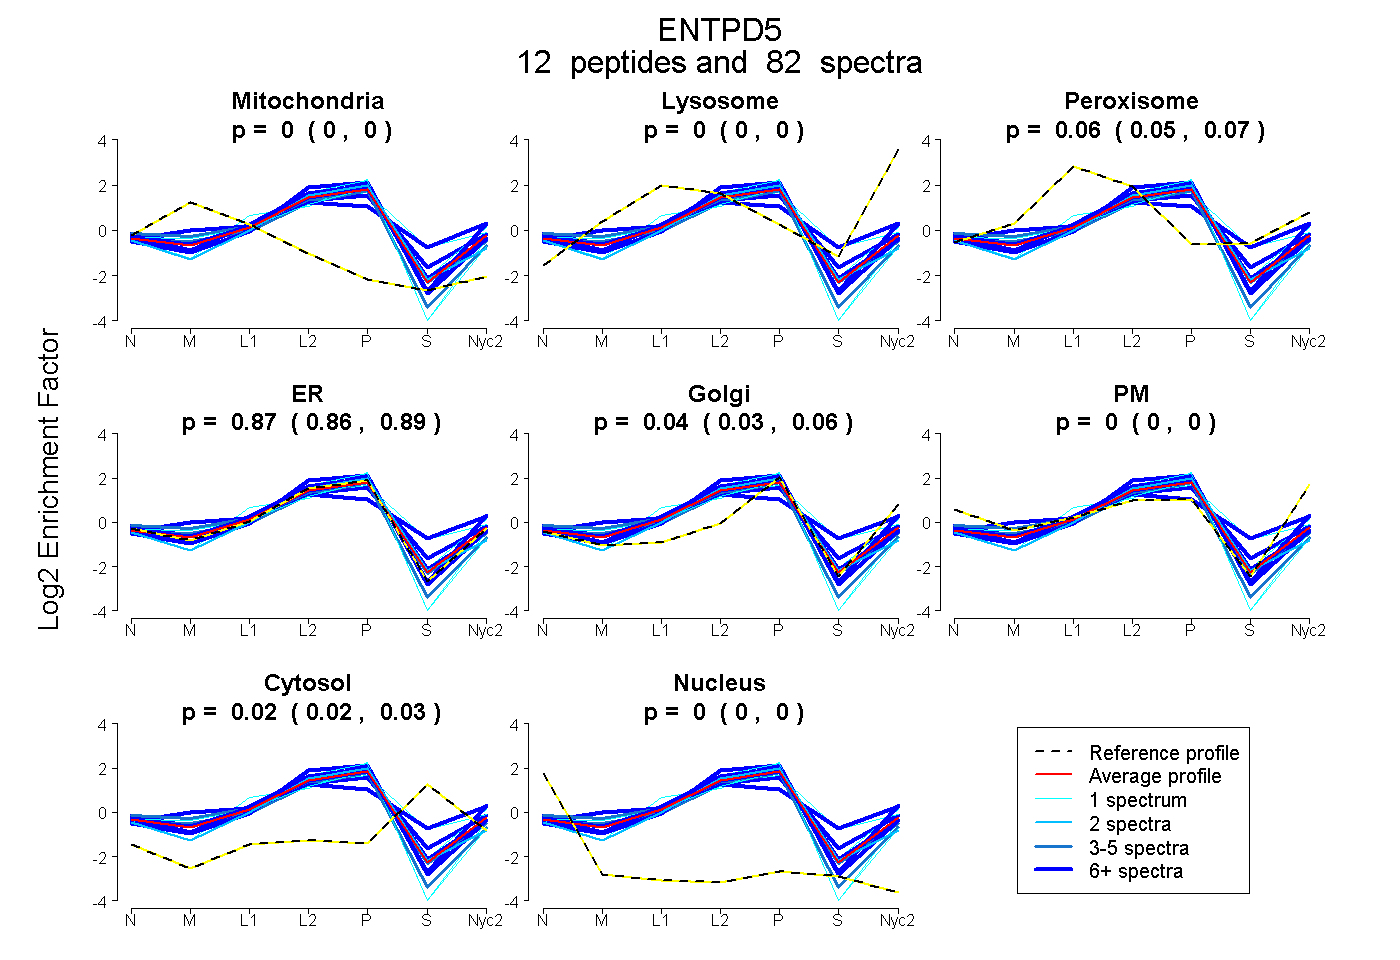
0.000 | 0.000
0.000 | 0.000
0.054 | 0.065
0.856 | 0.885
0.032 | 0.056
0.000 | 0.000
0.015 | 0.027
0.000 | 0.000
13peptides
spectra
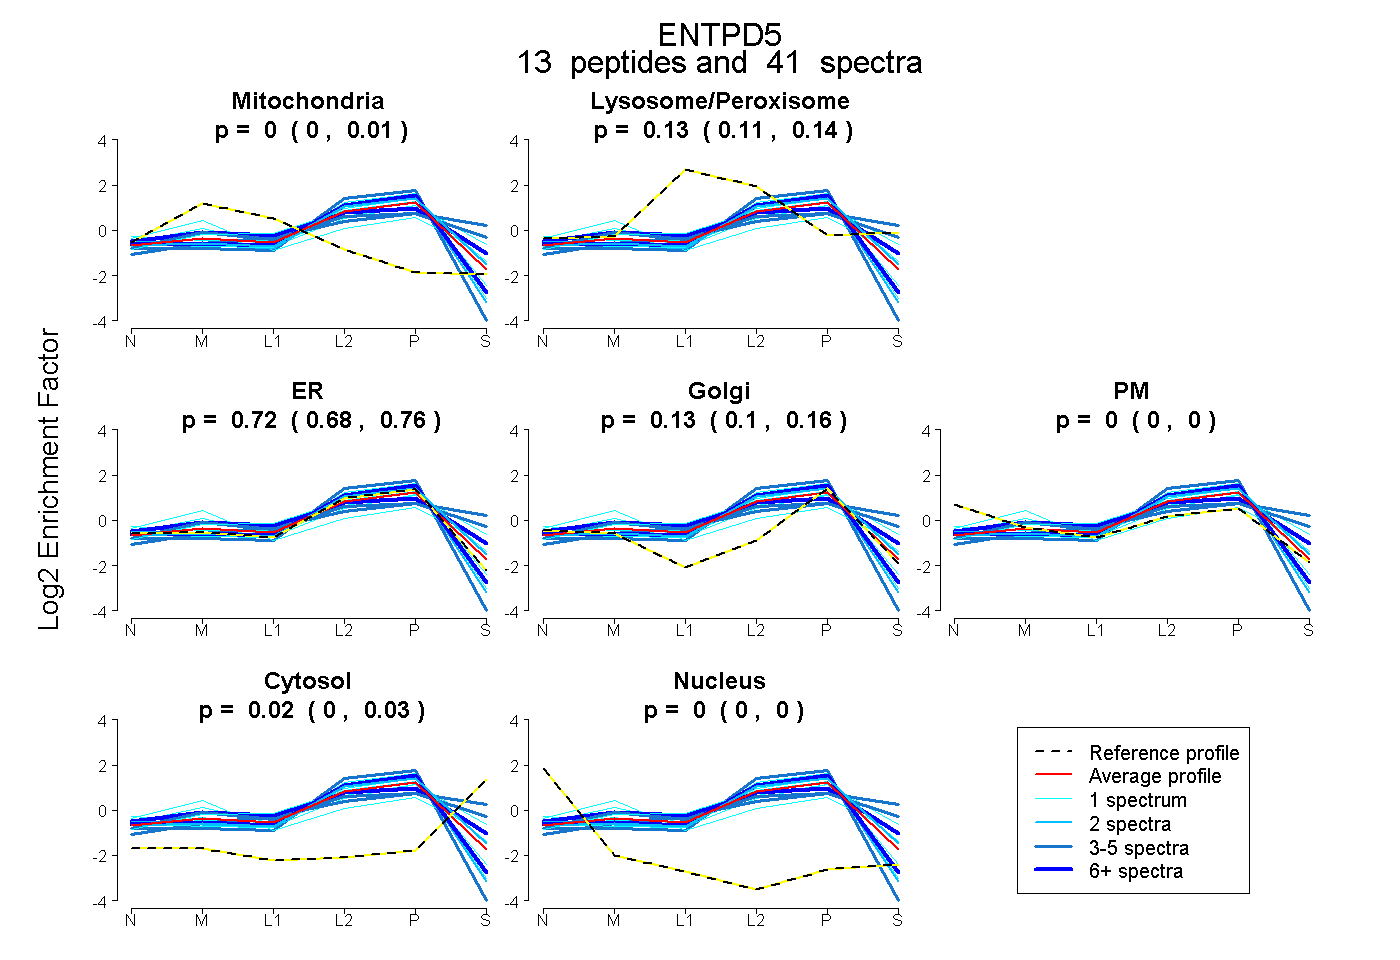
0.000 | 0.008
0.105 | 0.141
0.682 | 0.760
0.102 | 0.157
0.000 | 0.000
0.004 | 0.025
0.000 | 0.000
12peptides
spectra
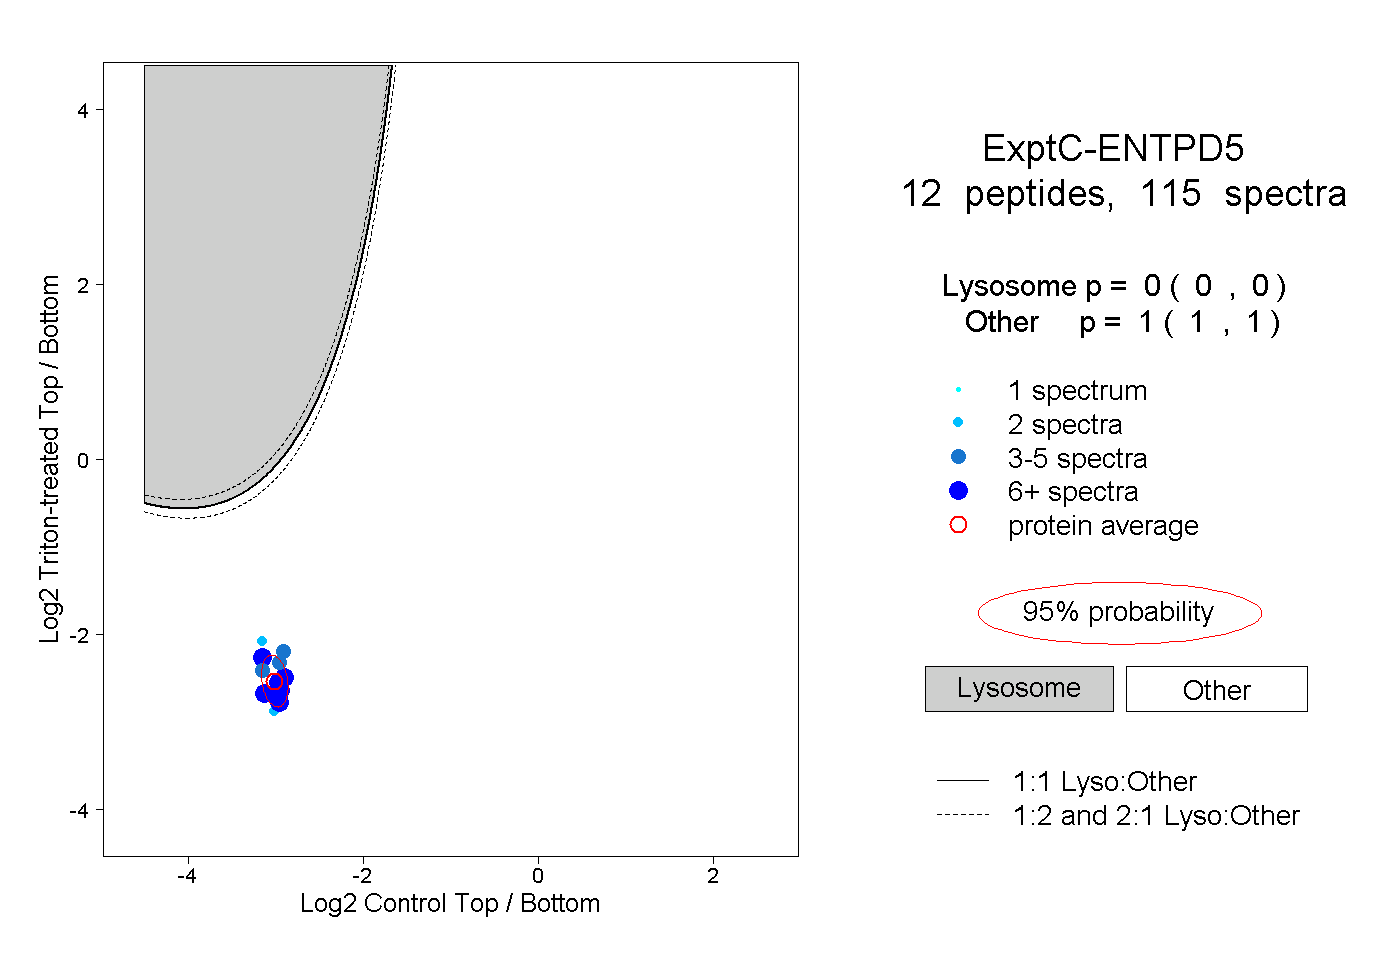
0.000 | 0.000
1.000 | 1.000
7peptides
spectra
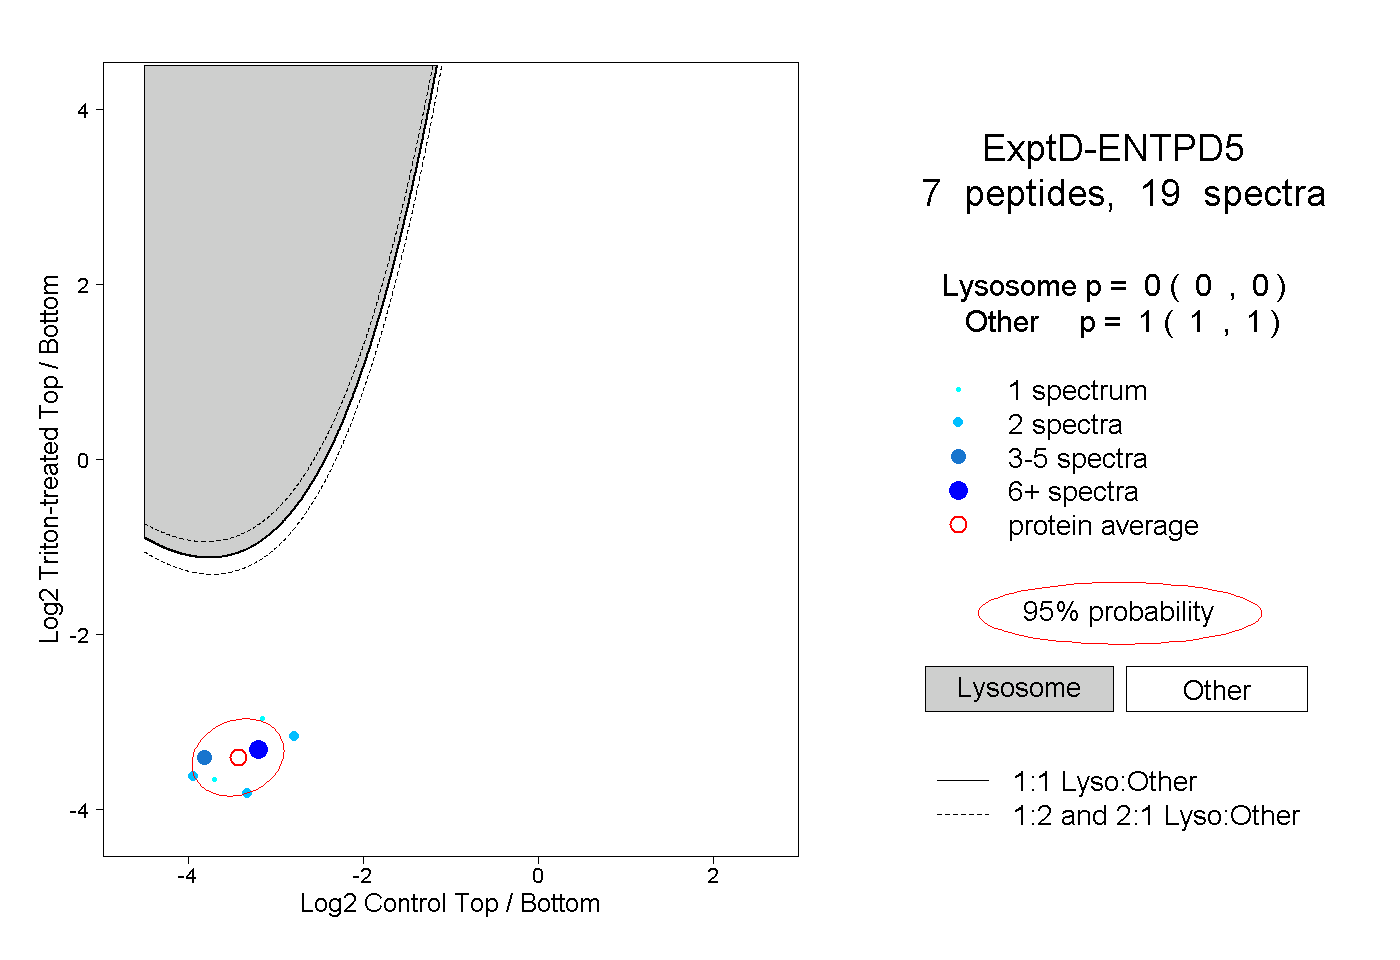
0.000 | 0.000
1.000 | 1.000