 13
13peptides
spectra
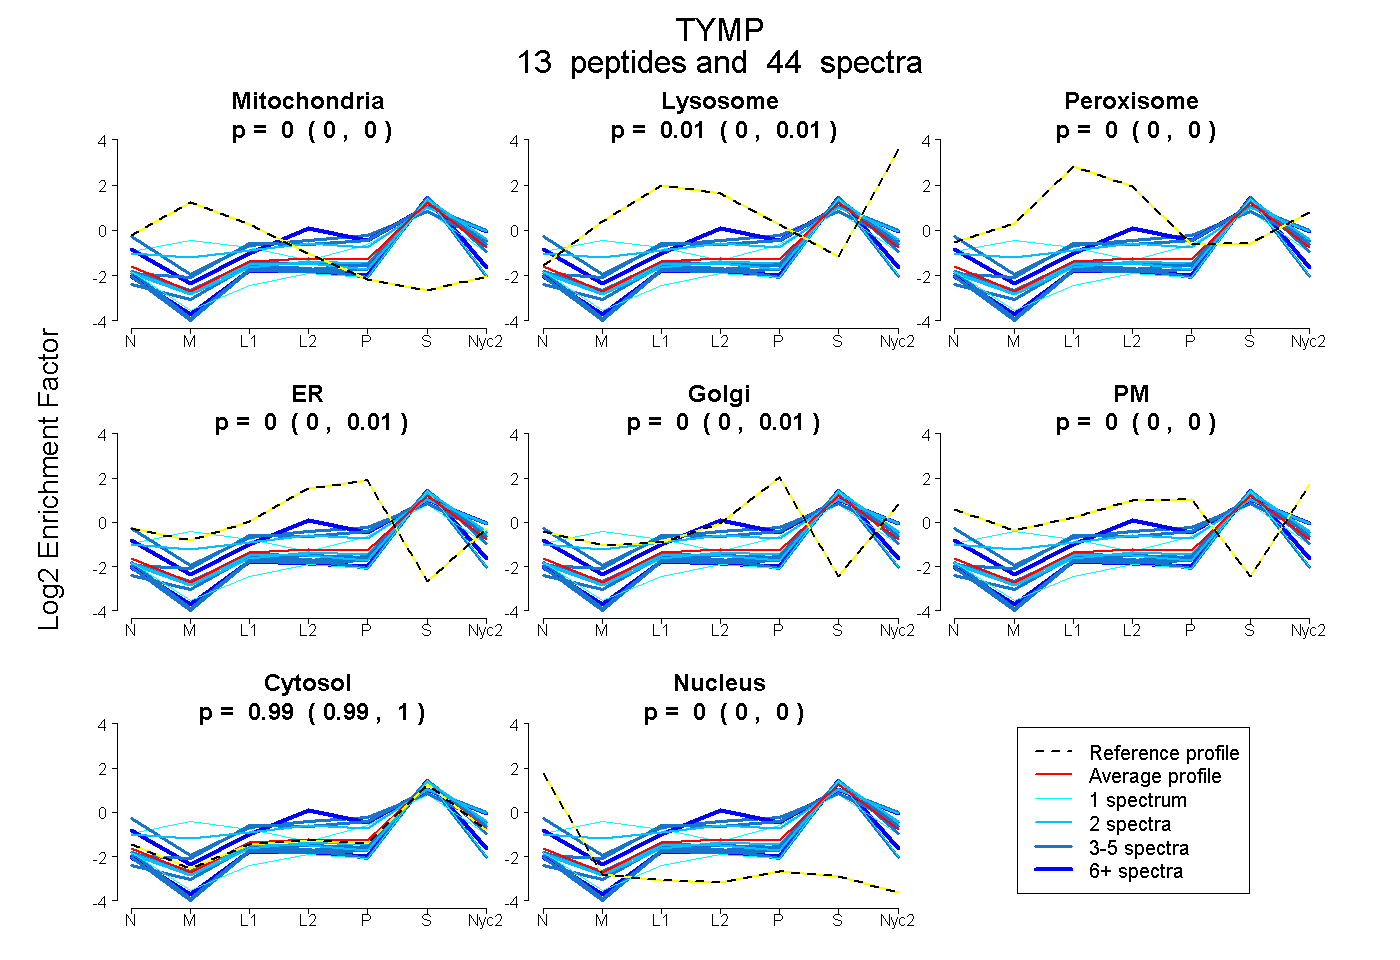
0.000 | 0.000
0.000 | 0.012
0.000 | 0.000
0.000 | 0.006
0.000 | 0.005
0.000 | 0.000
0.985 | 0.998
0.000 | 0.000
9peptides
spectra
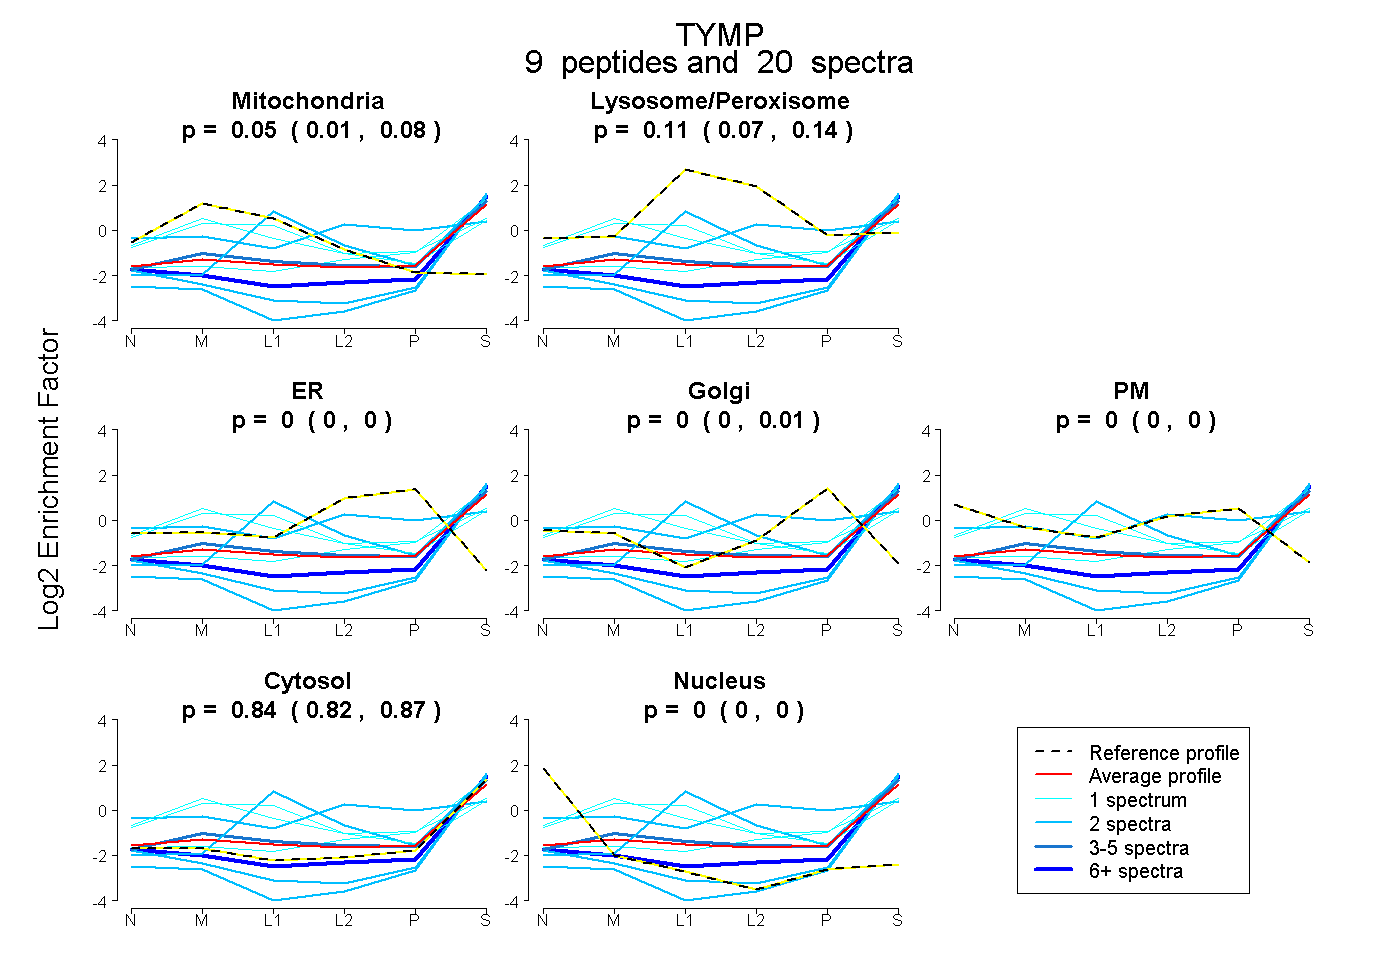
0.011 | 0.077
0.071 | 0.139
0.000 | 0.001
0.000 | 0.014
0.000 | 0.000
0.815 | 0.866
0.000 | 0.000
8peptides
spectra
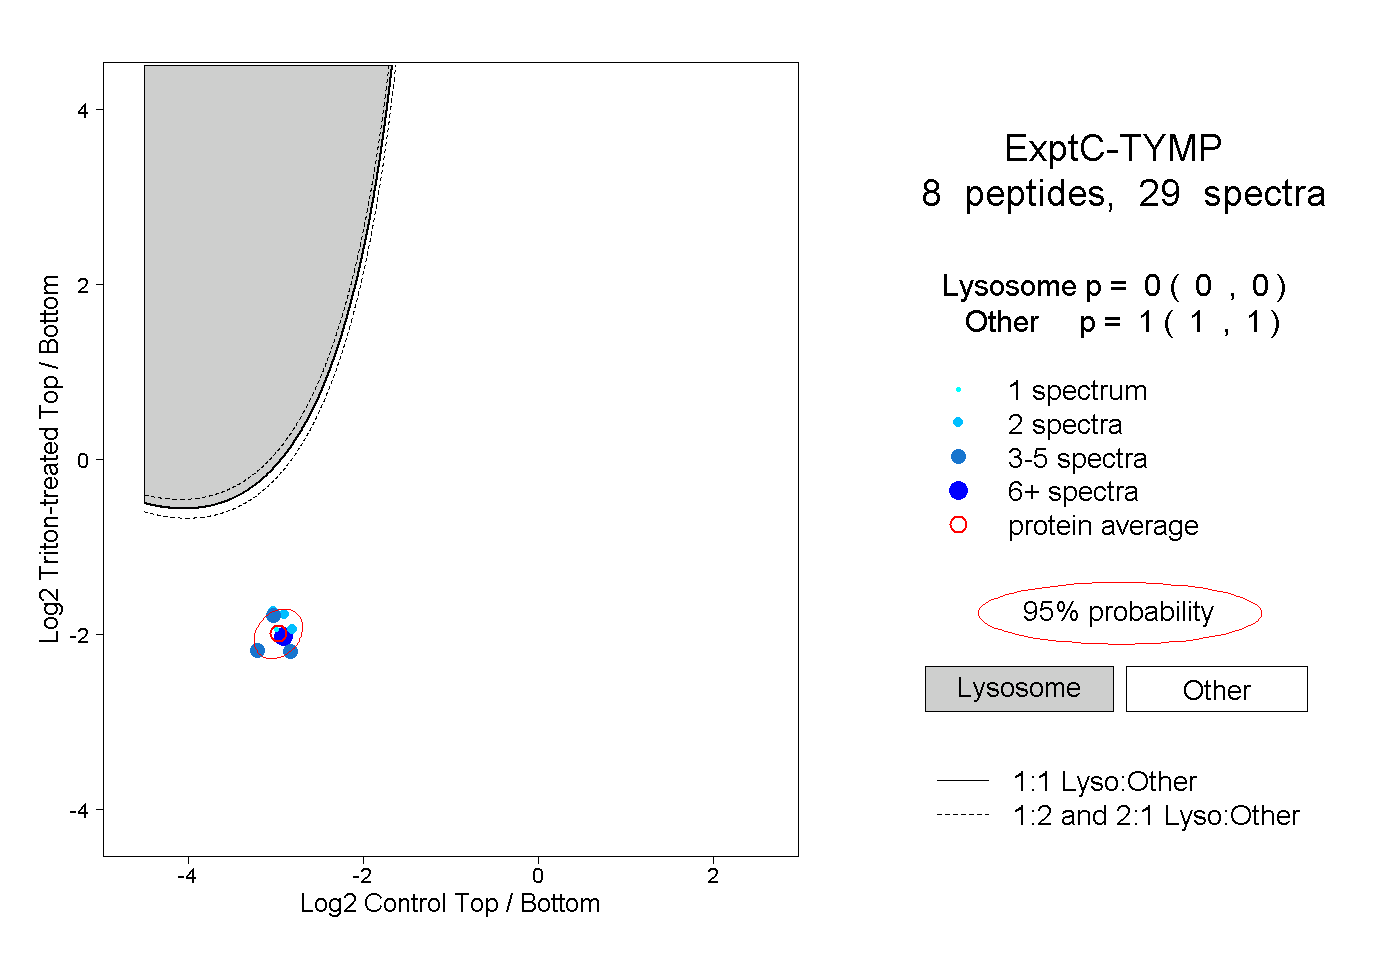
0.000 | 0.000
1.000 | 1.000
1peptide
spectrum
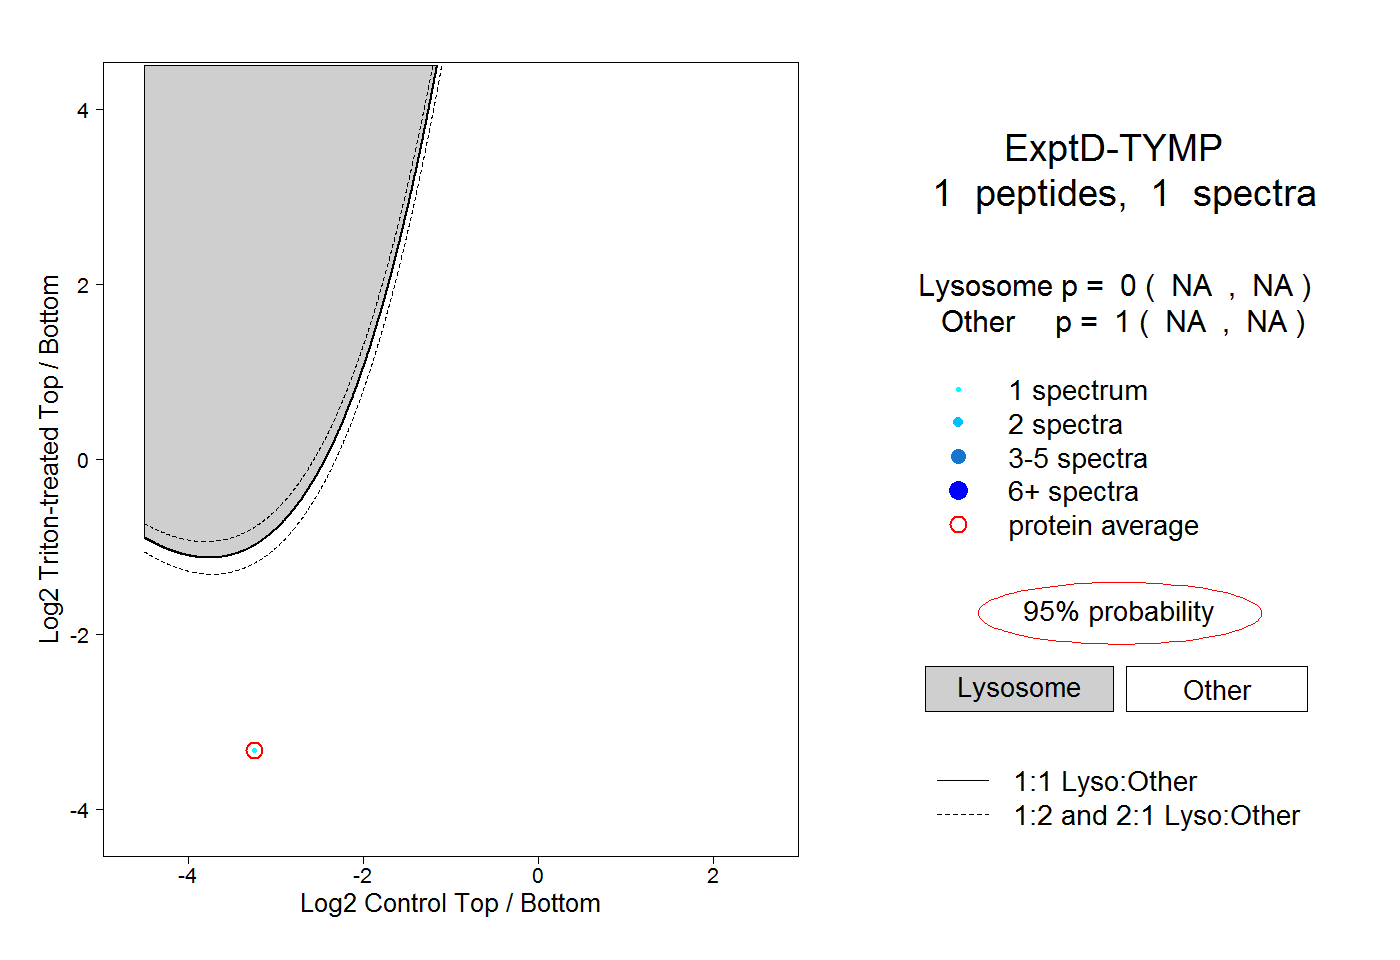
NA | NA
NA | NA