 13
13peptides
spectra
0.000 | 0.000
0.000 | 0.012
0.000 | 0.000
0.000 | 0.006
0.000 | 0.005
0.000 | 0.000
0.985 | 0.998
0.000 | 0.000
| Plot | Mito | Lyso | Perox | ER | Golgi | PM | Cytosol | Nucleus | |||||
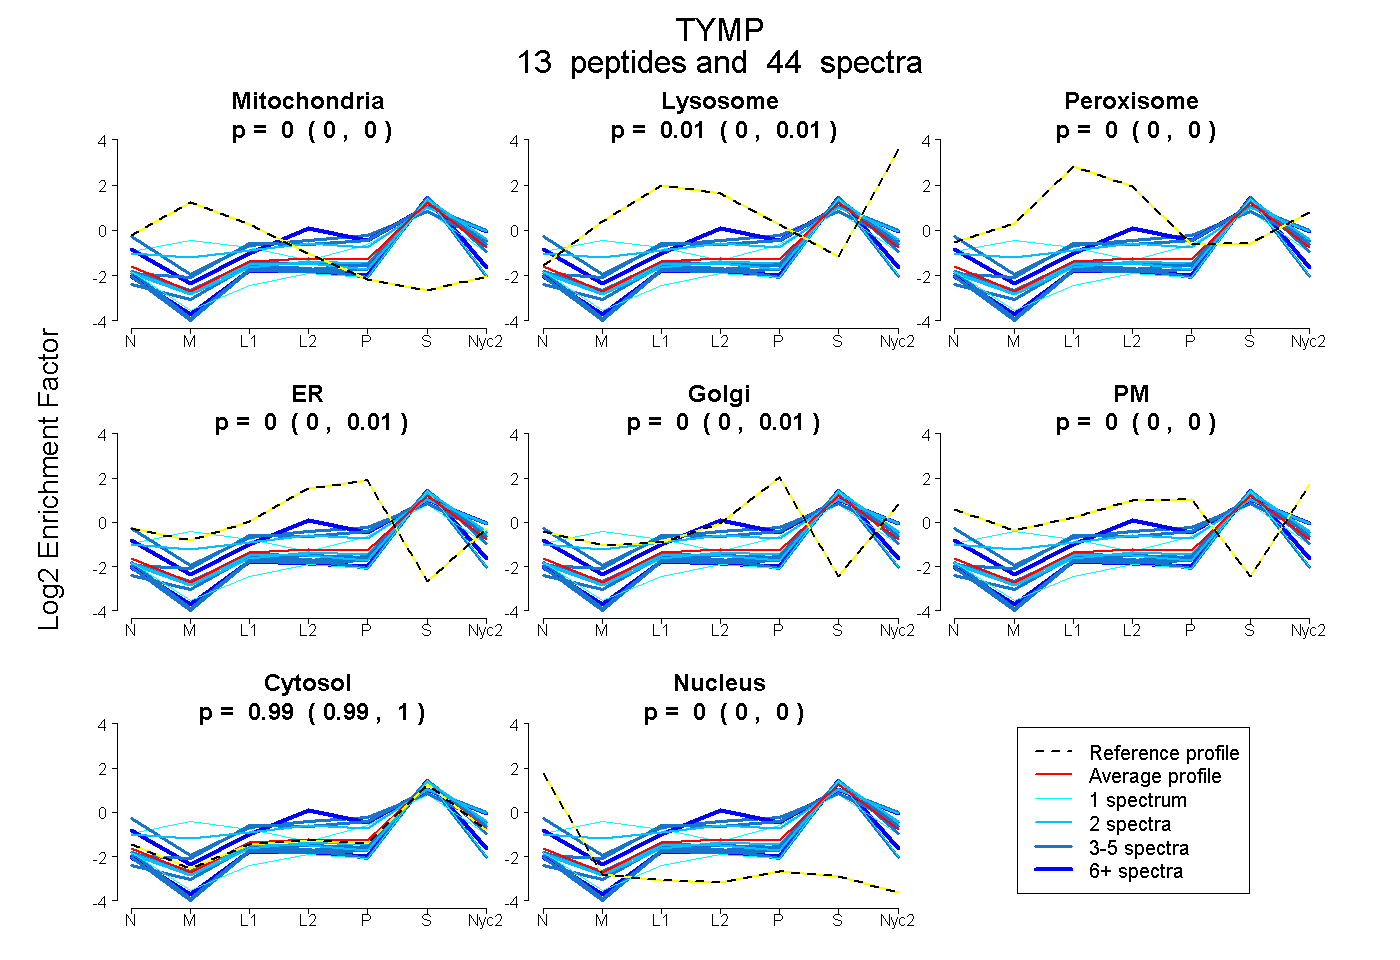
| Expt A |
13 peptides |
44 spectra |
|
0.000 0.000 | 0.000 |
0.007 0.000 | 0.012 |
0.000 0.000 | 0.000 |
0.000 0.000 | 0.006 |
0.000 0.000 | 0.005 |
0.000 0.000 | 0.000 |
0.993 0.985 | 0.998 |
0.000 0.000 | 0.000 |
| 1 spectrum, VSLVLAPALAACGCK | 0.000 | 0.000 | 0.000 | 0.000 | 0.000 | 0.000 | 0.880 | 0.120 | ||
| 2 spectra, NGGHLSEADIR | 0.000 | 0.000 | 0.000 | 0.000 | 0.000 | 0.000 | 1.000 | 0.000 | ||
| 4 spectra, GTPWLR | 0.000 | 0.003 | 0.000 | 0.000 | 0.000 | 0.000 | 0.997 | 0.000 | ||
| 8 spectra, ALCSGSPTQR | 0.000 | 0.000 | 0.000 | 0.000 | 0.000 | 0.000 | 0.950 | 0.050 | ||
| 3 spectra, HSTGGVGDK | 0.000 | 0.000 | 0.071 | 0.087 | 0.000 | 0.145 | 0.696 | 0.000 | ||
| 2 spectra, TLLGALVLSDR | 0.000 | 0.000 | 0.000 | 0.000 | 0.000 | 0.000 | 1.000 | 0.000 | ||
| 4 spectra, QLPELIR | 0.000 | 0.000 | 0.000 | 0.000 | 0.000 | 0.000 | 1.000 | 0.000 | ||
| 3 spectra, QLLPHAR | 0.000 | 0.198 | 0.000 | 0.017 | 0.000 | 0.000 | 0.785 | 0.000 | ||
| 1 spectrum, APSPFAELVLPPTTP | 0.219 | 0.000 | 0.077 | 0.000 | 0.068 | 0.000 | 0.636 | 0.000 | ||
| 2 spectra, VAAALDDGSALHR | 0.015 | 0.124 | 0.056 | 0.000 | 0.000 | 0.072 | 0.733 | 0.000 | ||
| 4 spectra, ALPLACVLHELGAGR | 0.000 | 0.000 | 0.000 | 0.000 | 0.000 | 0.000 | 0.929 | 0.071 | ||
| 7 spectra, NFVHALMDGR | 0.000 | 0.079 | 0.017 | 0.112 | 0.000 | 0.049 | 0.743 | 0.000 | ||
| 3 spectra, AQDTQIGAMLMAIR | 0.000 | 0.000 | 0.000 | 0.000 | 0.000 | 0.000 | 1.000 | 0.000 |
| Plot | Mito | Lyso or Perox | ER | Golgi | PM | Cytosol | Nucleus | ||||||
| Expt B |
9 peptides |
20 spectra |
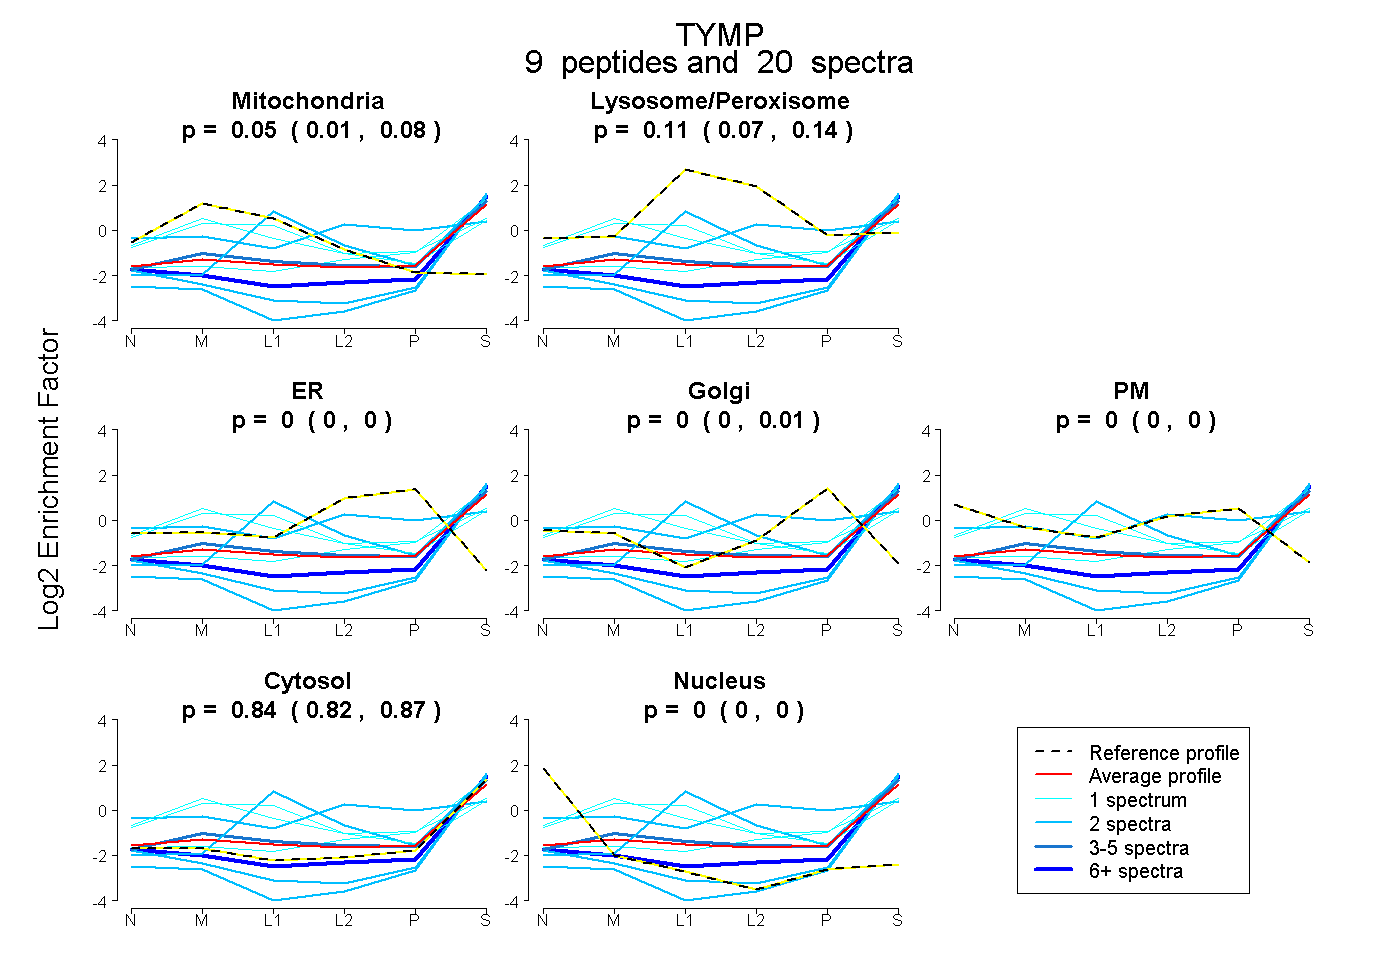 |
0.050 0.011 | 0.077 |
0.108 0.071 | 0.139 |
0.000 0.000 | 0.001 |
0.000 0.000 | 0.014 |
0.000 0.000 | 0.000 |
0.842 0.815 | 0.866 |
0.000 0.000 | 0.000 |
|||
| Plot | Lyso | Other | |||||||||||
| Expt C |
8 peptides |
29 spectra |
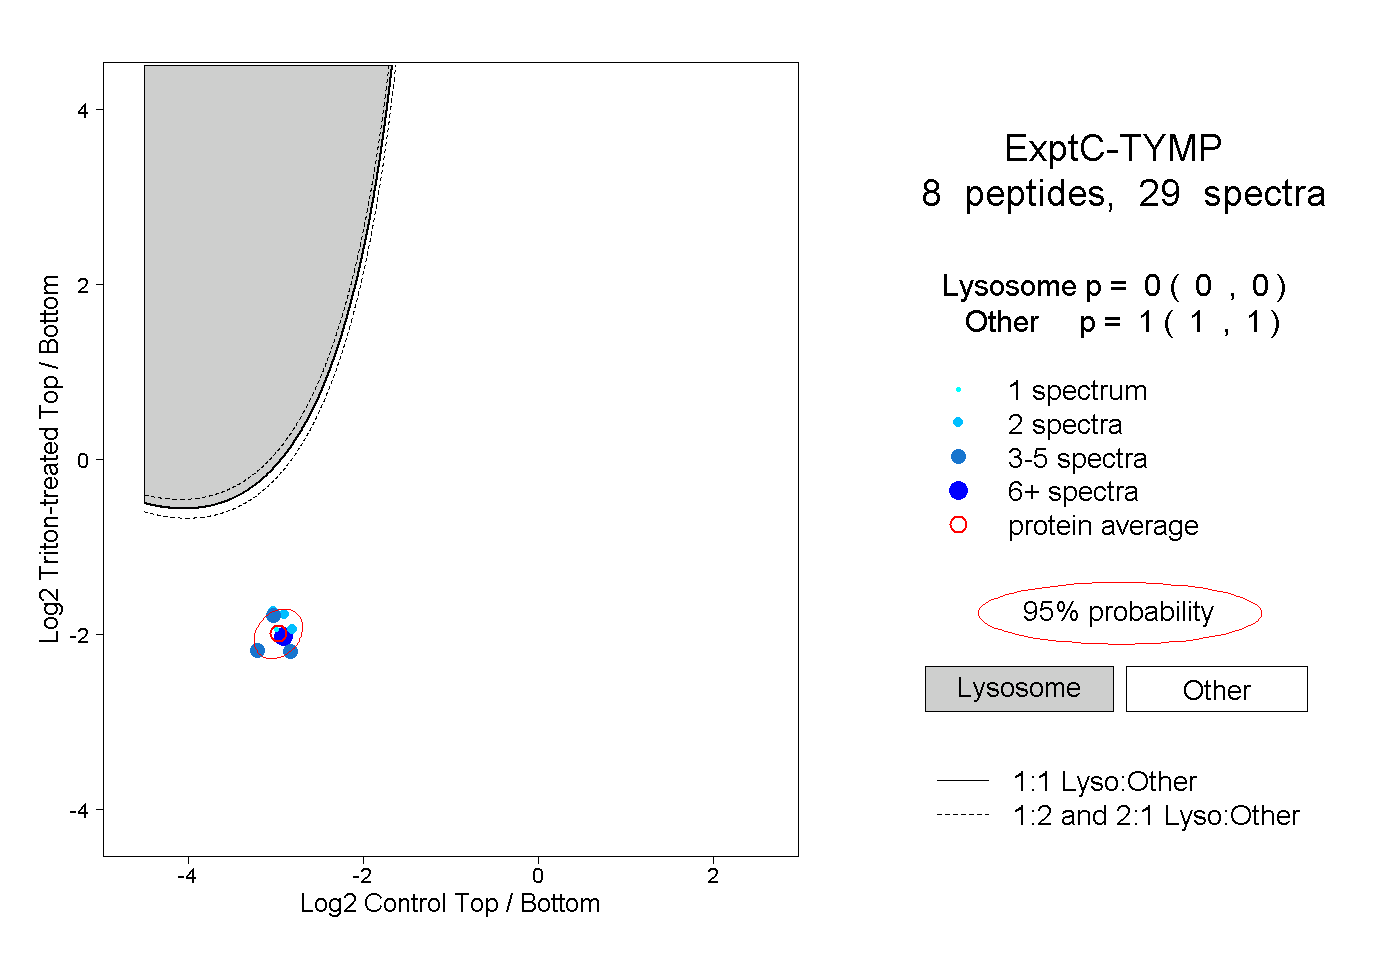 |
0.000 0.000 | 0.000 |
1.000 1.000 | 1.000 |
||||||||
| Plot | Lyso | Other | |||||||||||
| Expt D |
1 peptide |
1 spectrum |
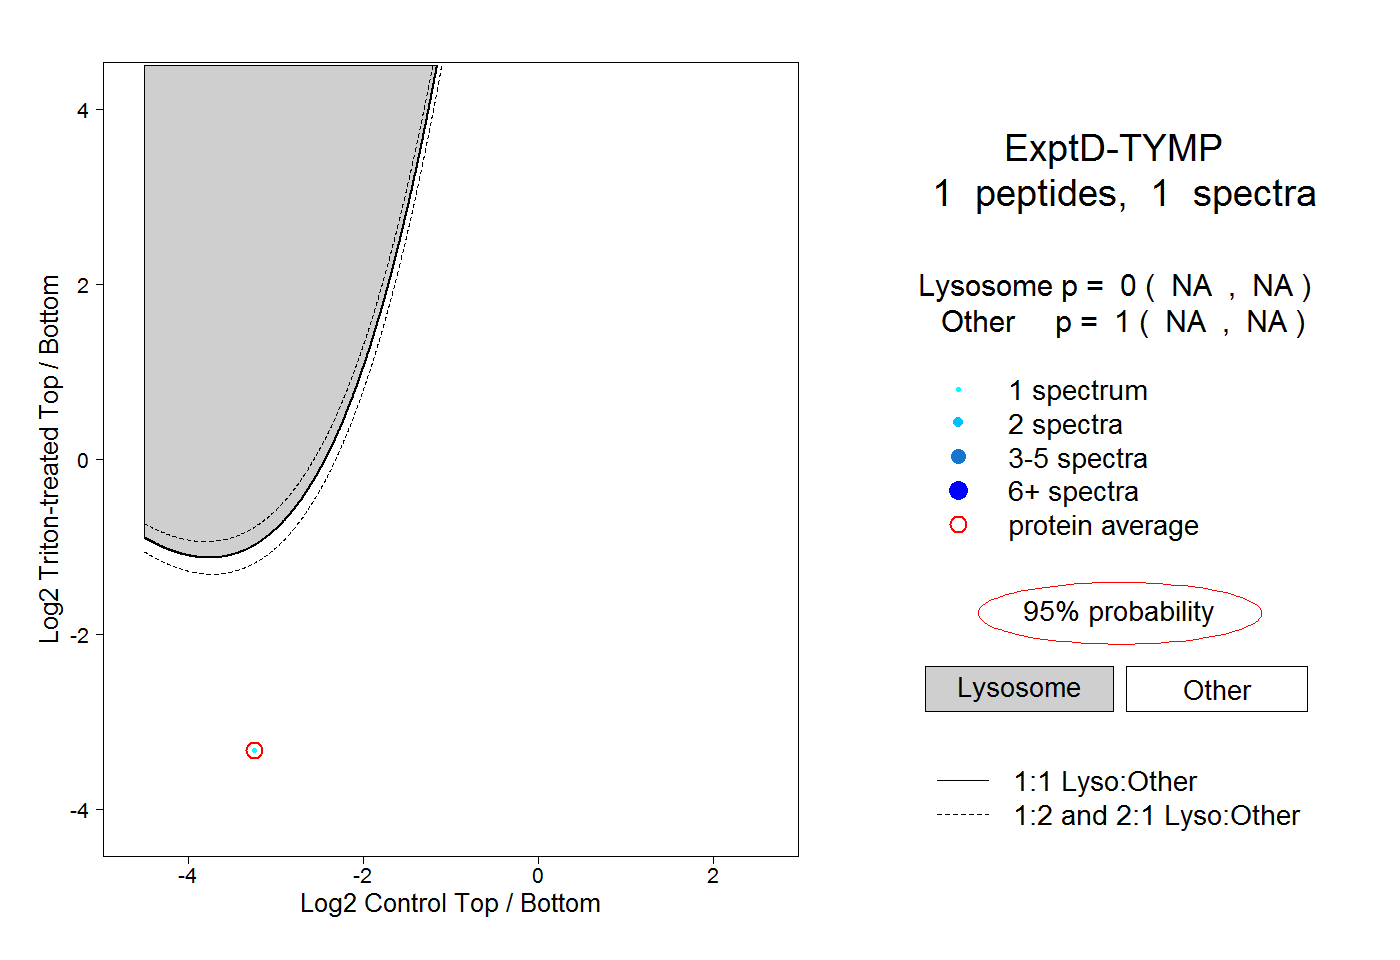 |
0.000 NA | NA |
1.000 NA | NA |