 22
22peptides
spectra
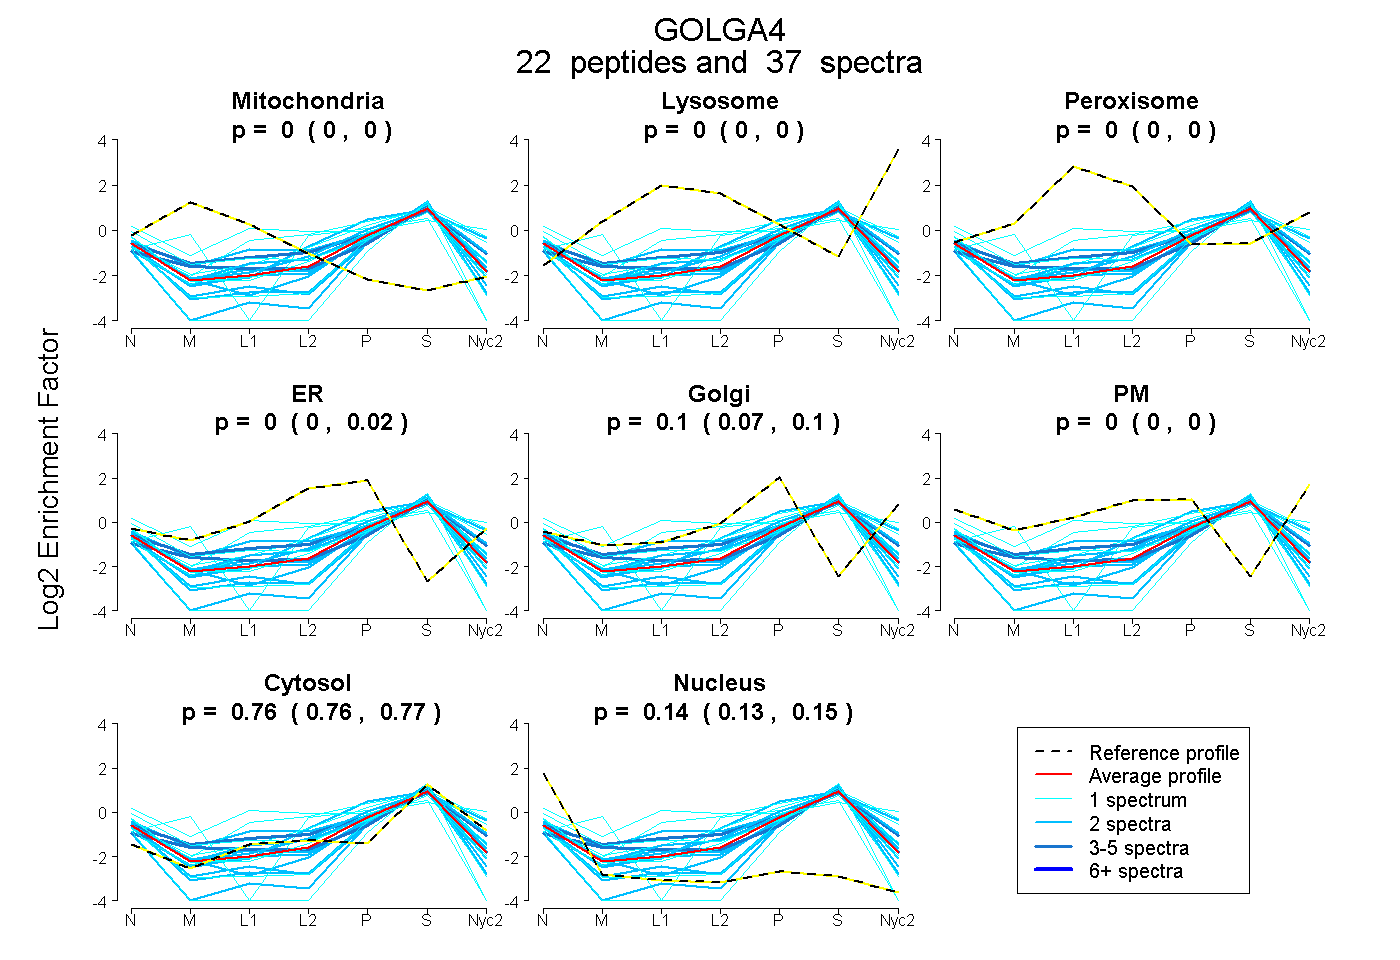
0.000 | 0.000
0.000 | 0.000
0.000 | 0.000
0.000 | 0.021
0.070 | 0.102
0.000 | 0.000
0.758 | 0.766
0.134 | 0.147
5peptides
spectra
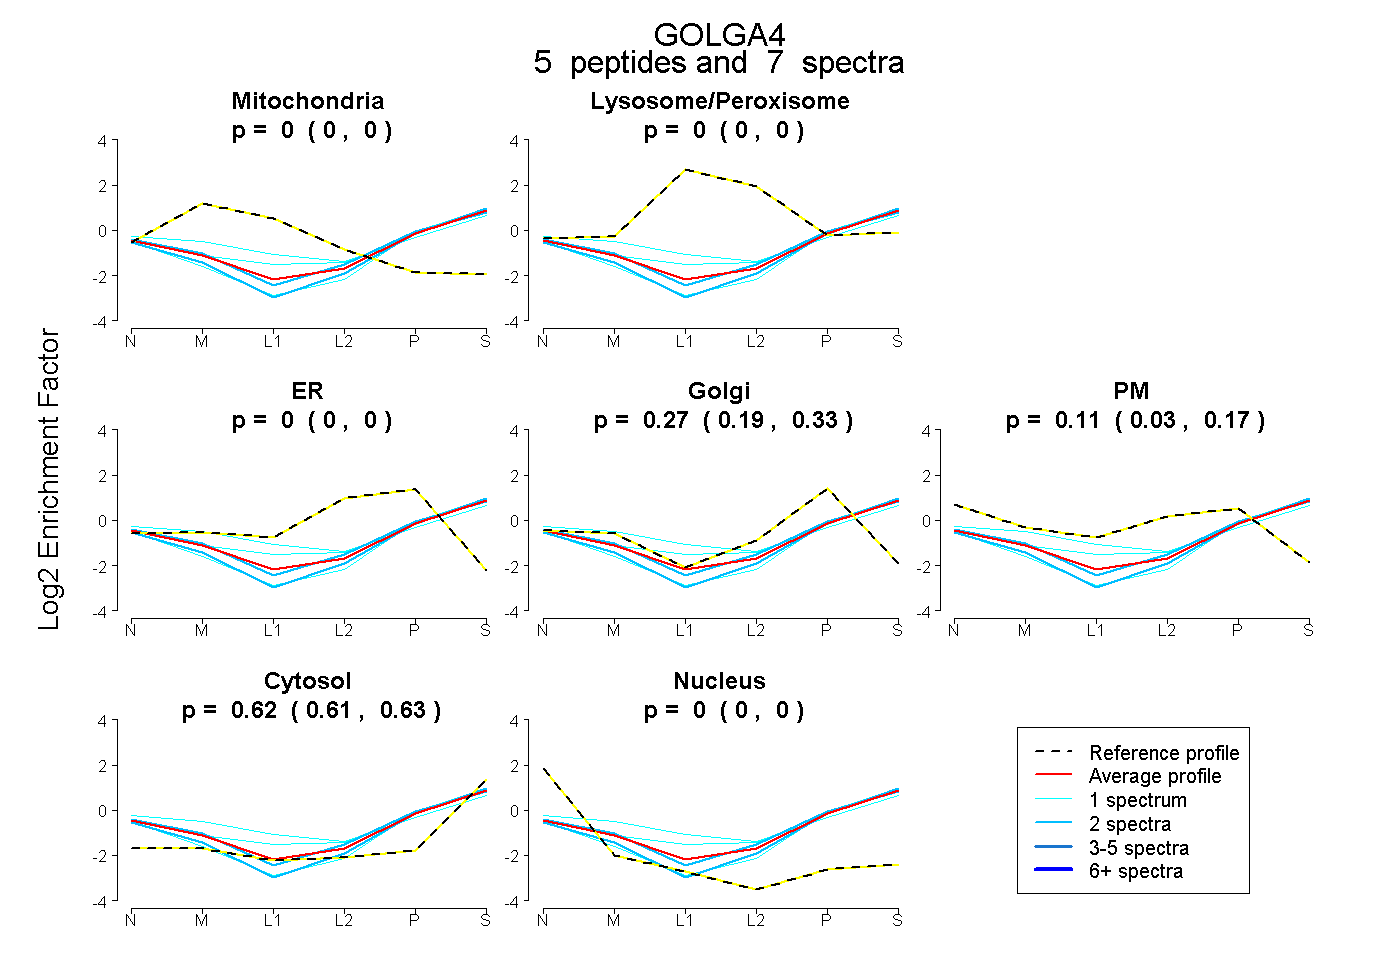
0.000 | 0.000
0.000 | 0.000
0.000 | 0.000
0.195 | 0.335
0.030 | 0.173
0.611 | 0.630
0.000 | 0.000
21peptides
spectra
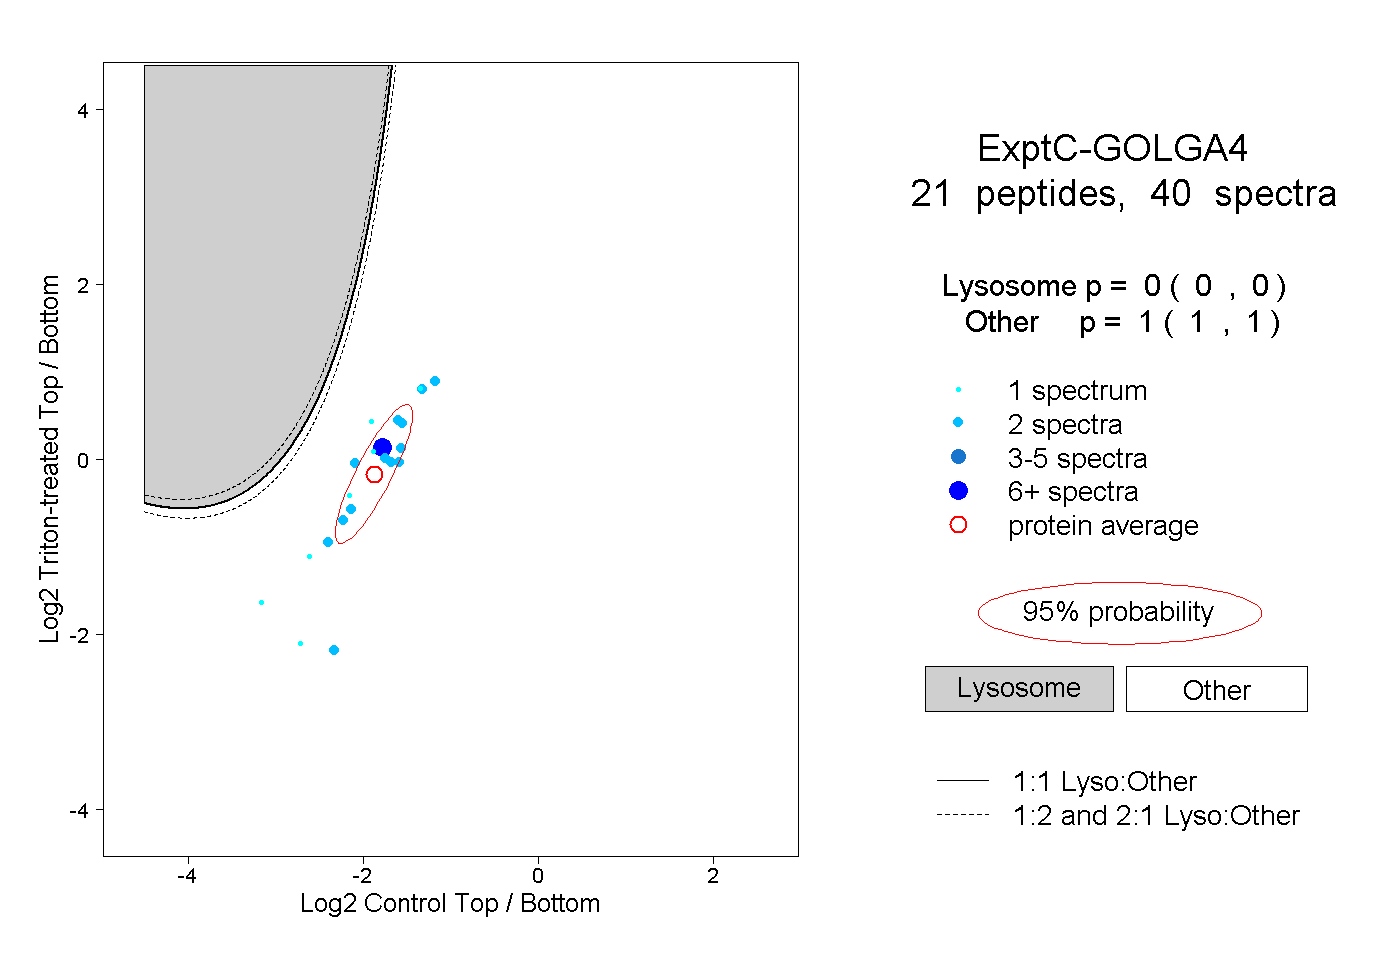
0.000 | 0.000
1.000 | 1.000
3peptides
spectra

0.000 | 0.002
0.998 | 1.000