GOLGA4
[ENSRNOP00000039533]
Main page
| | | Plot |
Mito |
Lyso |
|
Perox |
ER |
Golgi |
PM |
Cytosol |
Nucleus |
|
| Expt A |
 22
22
peptides |
37
spectra |
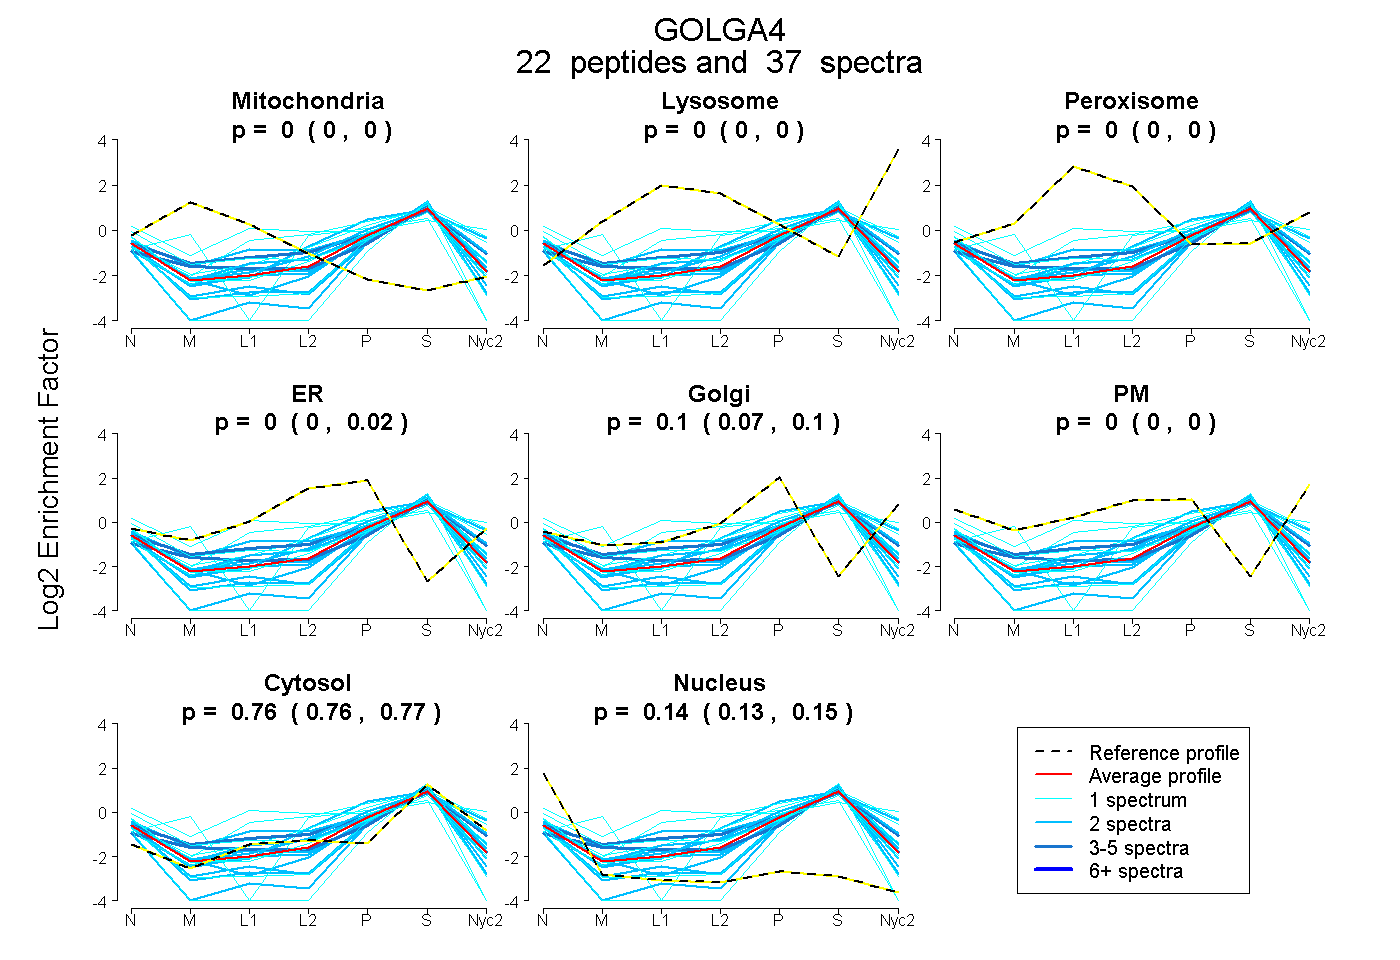 |
0.000
0.000 | 0.000 |
0.000
0.000 | 0.000 |
|
0.000
0.000 | 0.000 |
0.000
0.000 | 0.021 |
0.097
0.070 | 0.102 |
0.000
0.000 | 0.000 |
0.762
0.758 | 0.766 |
0.141
0.134 | 0.147 |
|
| | | Plot |
Mito |
|
Lyso or Perox |
|
ER |
Golgi |
PM |
Cytosol |
Nucleus |
|
| Expt B |
5
peptides |
7
spectra |
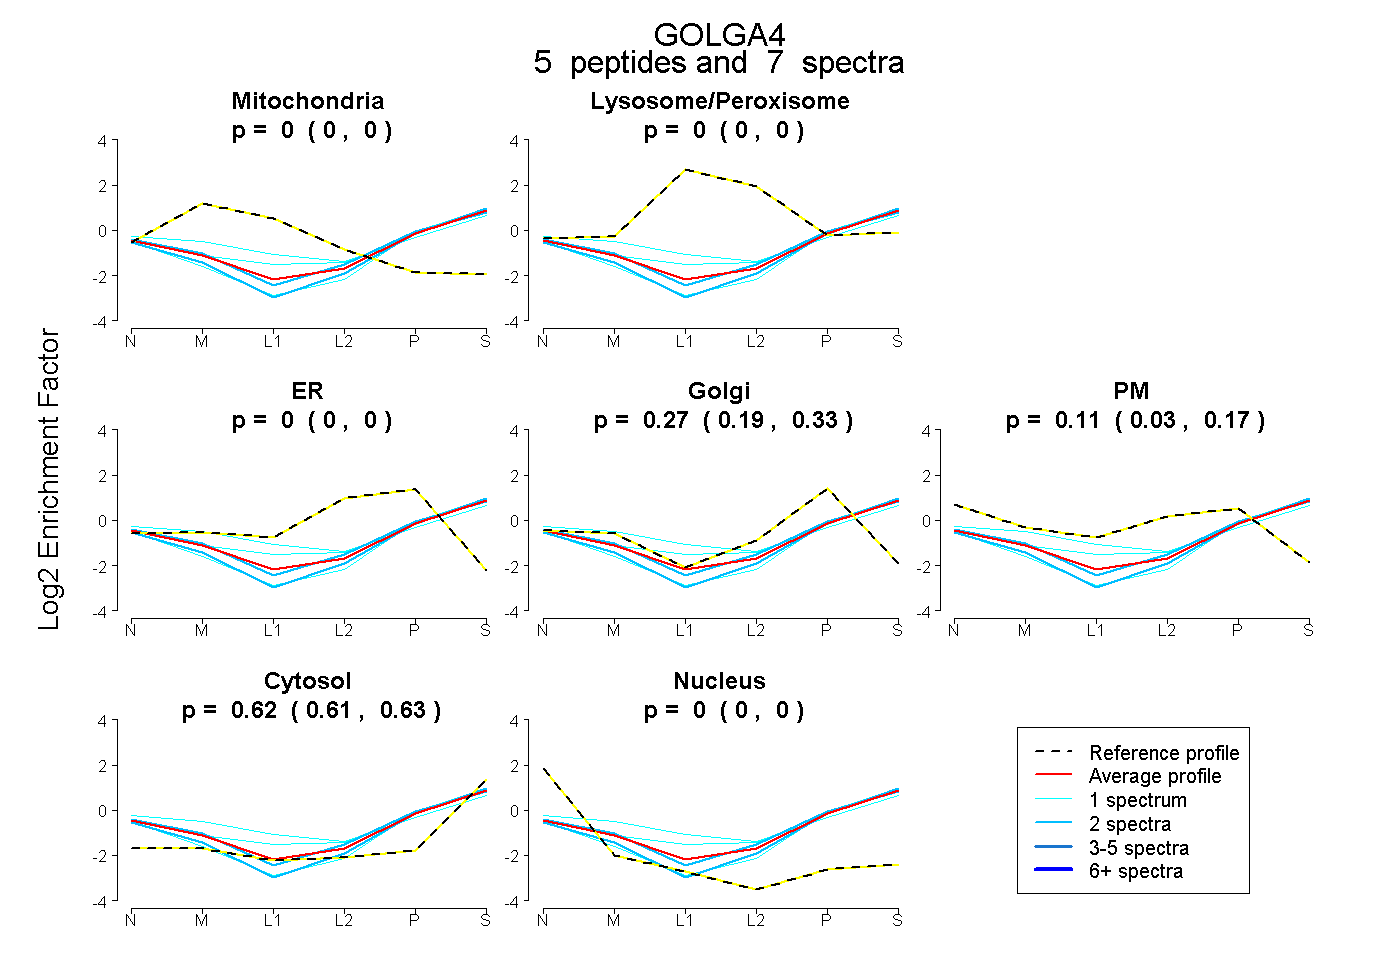 |
0.000
0.000 | 0.000 |
|
0.000
0.000 | 0.000 |
|
0.000
0.000 | 0.000 |
0.268
0.195 | 0.335 |
0.111
0.030 | 0.173 |
0.621
0.611 | 0.630 |
0.000
0.000 | 0.000 |
|
| | | Plot |
|
Lyso |
|
|
|
|
|
|
|
Other |
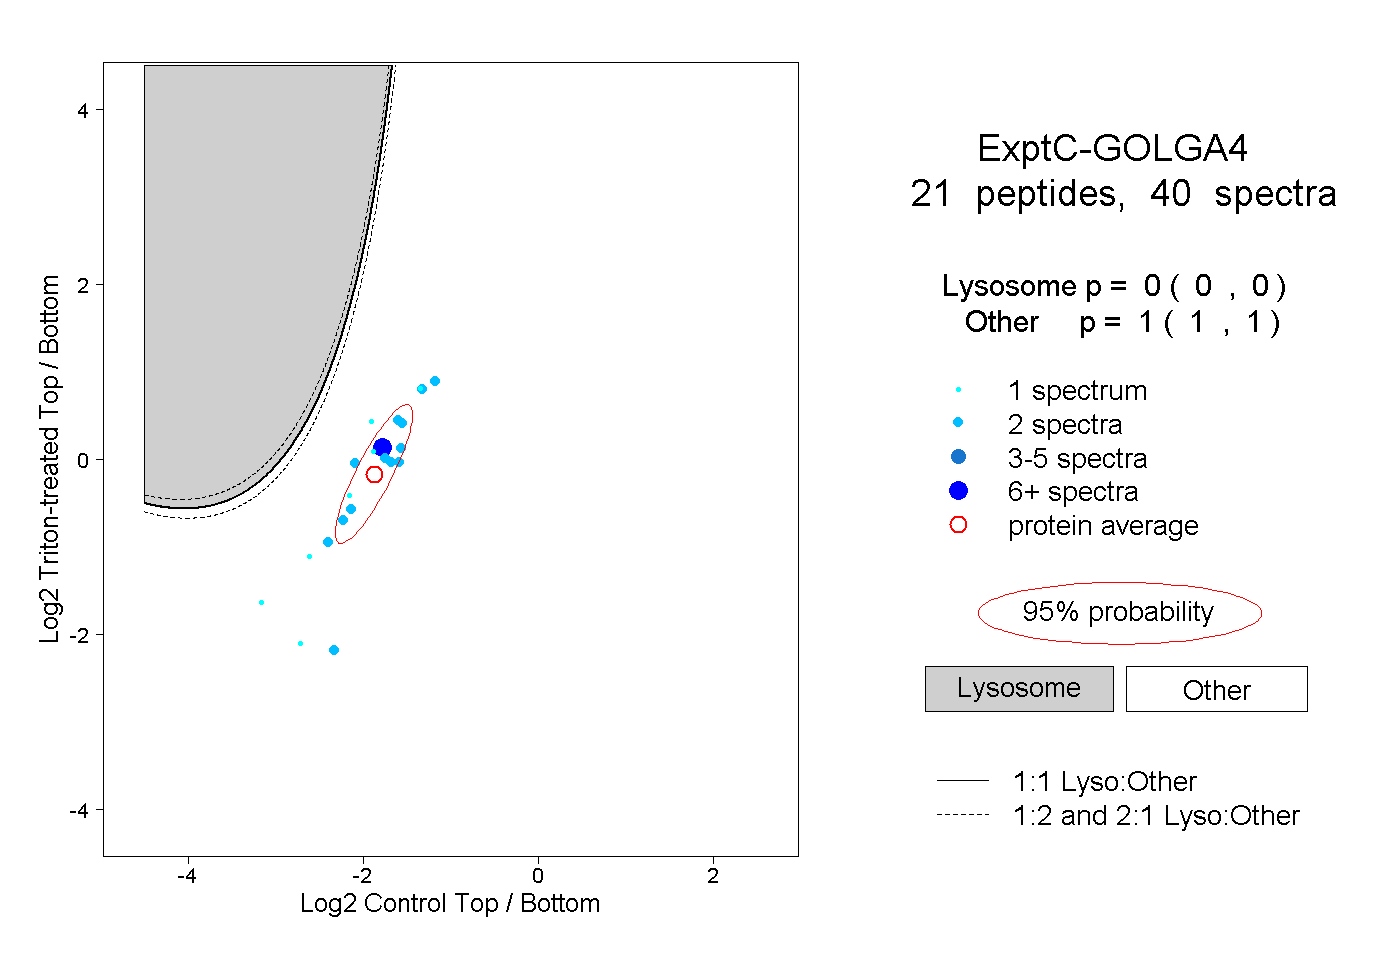
| Expt C |
21
peptides |
40
spectra |
 |
|
0.000
0.000 | 0.000 |
|
|
|
|
|
|
|
1.000
1.000 | 1.000 |
| 1 spectrum, LHAEQLASK |
|
0.000 |
|
|
|
|
|
|
|
1.000 |
| 2 spectra, VSELTGK |
|
0.000 |
|
|
|
|
|
|
|
1.000 |
| 2 spectra, LAGSER |
|
0.000 |
|
|
|
|
|
|
|
1.000 |
| 1 spectrum, ELESDLITER |
|
0.000 |
|
|
|
|
|
|
|
1.000 |
| 2 spectra, DTESQLSELR |
|
0.000 |
|
|
|
|
|
|
|
1.000 |
| 2 spectra, EALQEQLEER |
|
0.000 |
|
|
|
|
|
|
|
1.000 |
| 7 spectra, AQVQQLER |
|
0.000 |
|
|
|
|
|
|
|
1.000 |
| 1 spectrum, VQAAEEELQSCK |
|
0.000 |
|
|
|
|
|
|
|
1.000 |
| 2 spectra, EELSEK |
|
0.000 |
|
|
|
|
|
|
|
1.000 |
| 2 spectra, EAEETVLGLR |
|
0.000 |
|
|
|
|
|
|
|
1.000 |
| 1 spectrum, VEMDEQIK |
|
0.000 |
|
|
|
|
|
|
|
1.000 |
| 1 spectrum, VITTVLR |
|
0.000 |
|
|
|
|
|
|
|
1.000 |
| 2 spectra, ECDLETELK |
|
0.000 |
|
|
|
|
|
|
|
1.000 |
| 2 spectra, DQLAEELSVLR |
|
0.000 |
|
|
|
|
|
|
|
1.000 |
| 2 spectra, EQELSQK |
|
0.000 |
|
|
|
|
|
|
|
1.000 |
| 2 spectra, NSHVEK |
|
0.000 |
|
|
|
|
|
|
|
1.000 |
| 2 spectra, AAFEELEK |
|
0.000 |
|
|
|
|
|
|
|
1.000 |
| 2 spectra, EHQQELDILR |
|
0.000 |
|
|
|
|
|
|
|
1.000 |
| 1 spectrum, TTLISDSK |
|
0.000 |
|
|
|
|
|
|
|
1.000 |
| 1 spectrum, FAQYQSTIK |
|
0.000 |
|
|
|
|
|
|
|
1.000 |
| 2 spectra, MTTQGEELR |
|
0.000 |
|
|
|
|
|
|
|
1.000 |
| | | Plot |
|
Lyso |
|
|
|
|
|
|
|
Other |
| Expt D |
3
peptides |
3
spectra |
 |
|
0.000
0.000 | 0.002 |
|
|
|
|
|
|
|
1.000
0.998 | 1.000 |