 22
22peptides
spectra
0.000 | 0.000
0.000 | 0.000
0.000 | 0.000
0.000 | 0.021
0.070 | 0.102
0.000 | 0.000
0.758 | 0.766
0.134 | 0.147
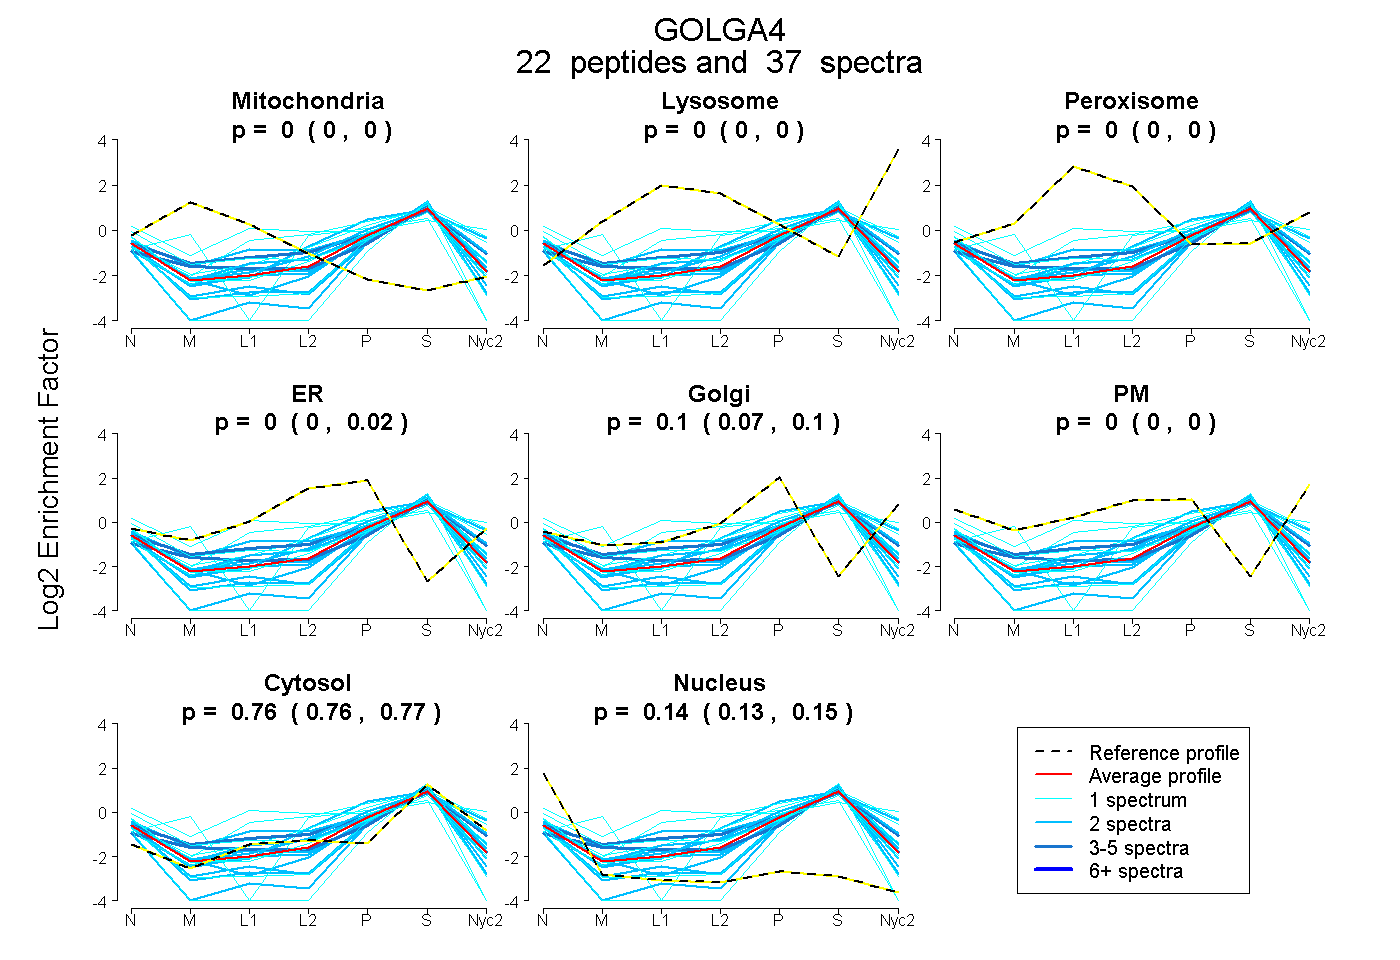
| Plot | Mito | Lyso | Perox | ER | Golgi | PM | Cytosol | Nucleus | |||||
| Expt A |
22 peptides |
37 spectra |
|
0.000 0.000 | 0.000 |
0.000 0.000 | 0.000 |
0.000 0.000 | 0.000 |
0.000 0.000 | 0.021 |
0.097 0.070 | 0.102 |
0.000 0.000 | 0.000 |
0.762 0.758 | 0.766 |
0.141 0.134 | 0.147 |
| 1 spectrum, EQAQQILTEK | 0.044 | 0.000 | 0.000 | 0.175 | 0.000 | 0.000 | 0.512 | 0.268 | ||
| 2 spectra, ELESDLITER | 0.000 | 0.000 | 0.000 | 0.000 | 0.000 | 0.000 | 0.689 | 0.311 | ||
| 2 spectra, TNELVCTSR | 0.000 | 0.000 | 0.000 | 0.133 | 0.000 | 0.000 | 0.770 | 0.097 | ||
| 1 spectrum, IQEIEK | 0.000 | 0.000 | 0.000 | 0.000 | 0.144 | 0.000 | 0.724 | 0.132 | ||
| 2 spectra, DTESQLSELR | 0.000 | 0.000 | 0.000 | 0.000 | 0.000 | 0.000 | 0.709 | 0.291 | ||
| 1 spectrum, HTATVGEALLR | 0.000 | 0.000 | 0.228 | 0.000 | 0.000 | 0.282 | 0.488 | 0.001 | ||
| 2 spectra, EALQEQLEER | 0.000 | 0.000 | 0.000 | 0.000 | 0.057 | 0.000 | 0.810 | 0.133 | ||
| 2 spectra, AQVQQLER | 0.000 | 0.000 | 0.000 | 0.000 | 0.098 | 0.000 | 0.783 | 0.119 | ||
| 1 spectrum, VQAAEEELQSCK | 0.070 | 0.000 | 0.000 | 0.137 | 0.000 | 0.000 | 0.658 | 0.135 | ||
| 1 spectrum, ELDDLIESWEK | 0.000 | 0.000 | 0.084 | 0.271 | 0.000 | 0.000 | 0.644 | 0.000 | ||
| 2 spectra, ECDLETELK | 0.000 | 0.000 | 0.000 | 0.000 | 0.000 | 0.000 | 0.719 | 0.281 | ||
| 1 spectrum, ELENTVLELSQK | 0.000 | 0.000 | 0.000 | 0.197 | 0.000 | 0.000 | 0.789 | 0.014 | ||
| 1 spectrum, EQVHNLEDR | 0.000 | 0.000 | 0.000 | 0.000 | 0.000 | 0.000 | 0.543 | 0.457 | ||
| 1 spectrum, VVELEDCITQR | 0.000 | 0.000 | 0.000 | 0.000 | 0.000 | 0.000 | 0.707 | 0.293 | ||
| 2 spectra, DQLAEELSVLR | 0.000 | 0.000 | 0.000 | 0.000 | 0.000 | 0.000 | 0.746 | 0.254 | ||
| 4 spectra, EQELGELK | 0.075 | 0.000 | 0.000 | 0.000 | 0.041 | 0.000 | 0.808 | 0.075 | ||
| 3 spectra, EQELSQK | 0.054 | 0.000 | 0.000 | 0.123 | 0.088 | 0.000 | 0.734 | 0.000 | ||
| 2 spectra, TLLEELASQLDR | 0.000 | 0.000 | 0.000 | 0.000 | 0.208 | 0.000 | 0.754 | 0.038 | ||
| 2 spectra, DTEHSGLVQTLQR | 0.000 | 0.000 | 0.064 | 0.000 | 0.124 | 0.119 | 0.693 | 0.000 | ||
| 1 spectrum, QALEAELQEQR | 0.000 | 0.000 | 0.000 | 0.058 | 0.054 | 0.000 | 0.722 | 0.167 | ||
| 2 spectra, AAFEELEK | 0.000 | 0.000 | 0.000 | 0.193 | 0.000 | 0.000 | 0.737 | 0.071 | ||
| 1 spectrum, LEVDLGCALNEK | 0.000 | 0.000 | 0.000 | 0.000 | 0.188 | 0.028 | 0.785 | 0.000 |
| Plot | Mito | Lyso or Perox | ER | Golgi | PM | Cytosol | Nucleus | ||||||
| Expt B |
5 peptides |
7 spectra |
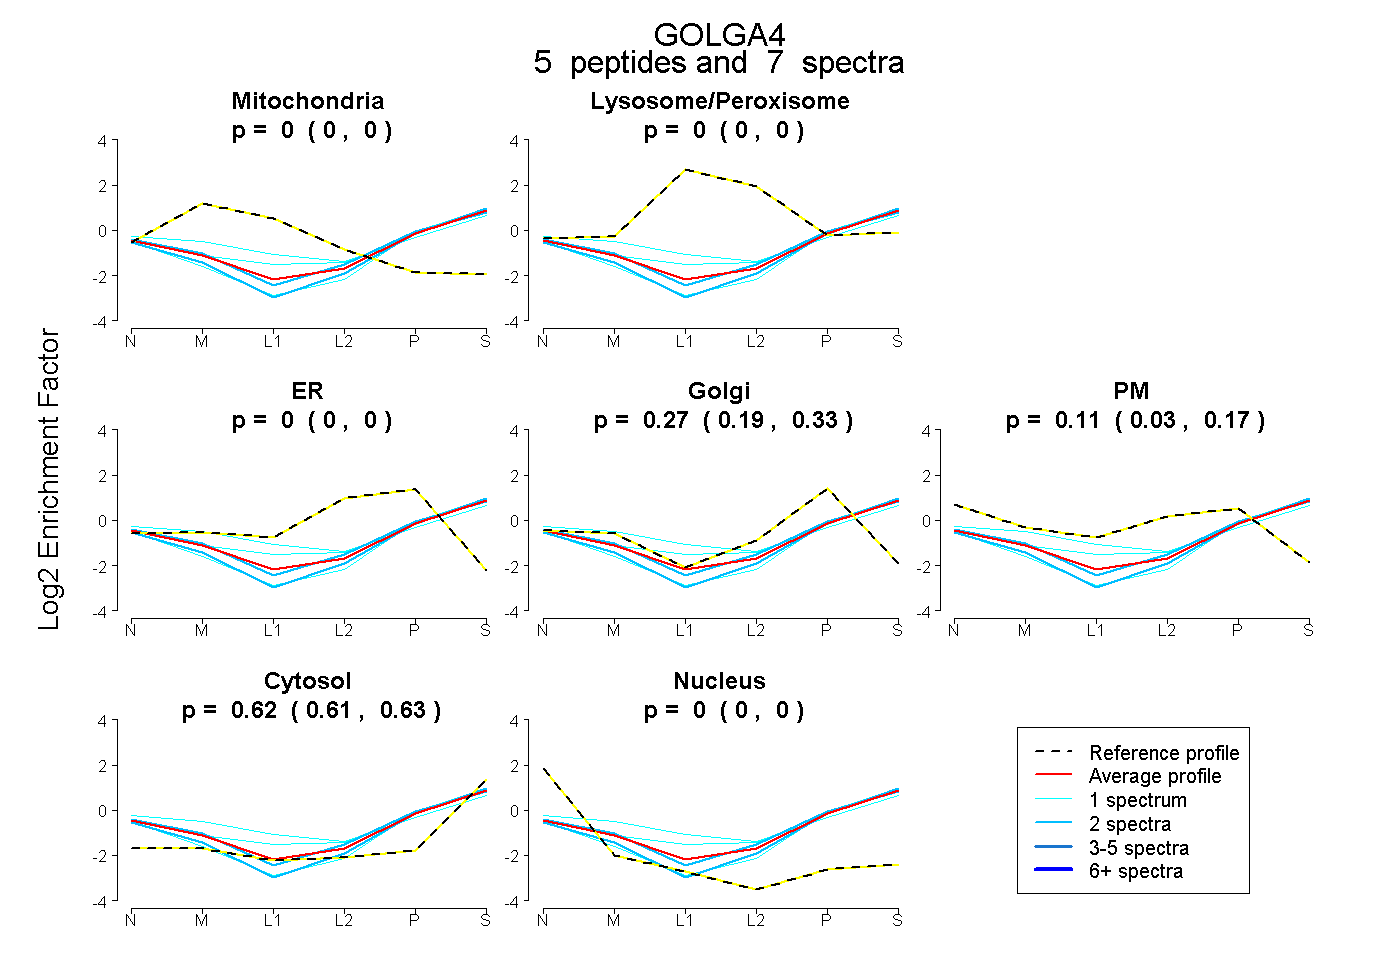 |
0.000 0.000 | 0.000 |
0.000 0.000 | 0.000 |
0.000 0.000 | 0.000 |
0.268 0.195 | 0.335 |
0.111 0.030 | 0.173 |
0.621 0.611 | 0.630 |
0.000 0.000 | 0.000 |
|||
| Plot | Lyso | Other | |||||||||||
| Expt C |
21 peptides |
40 spectra |
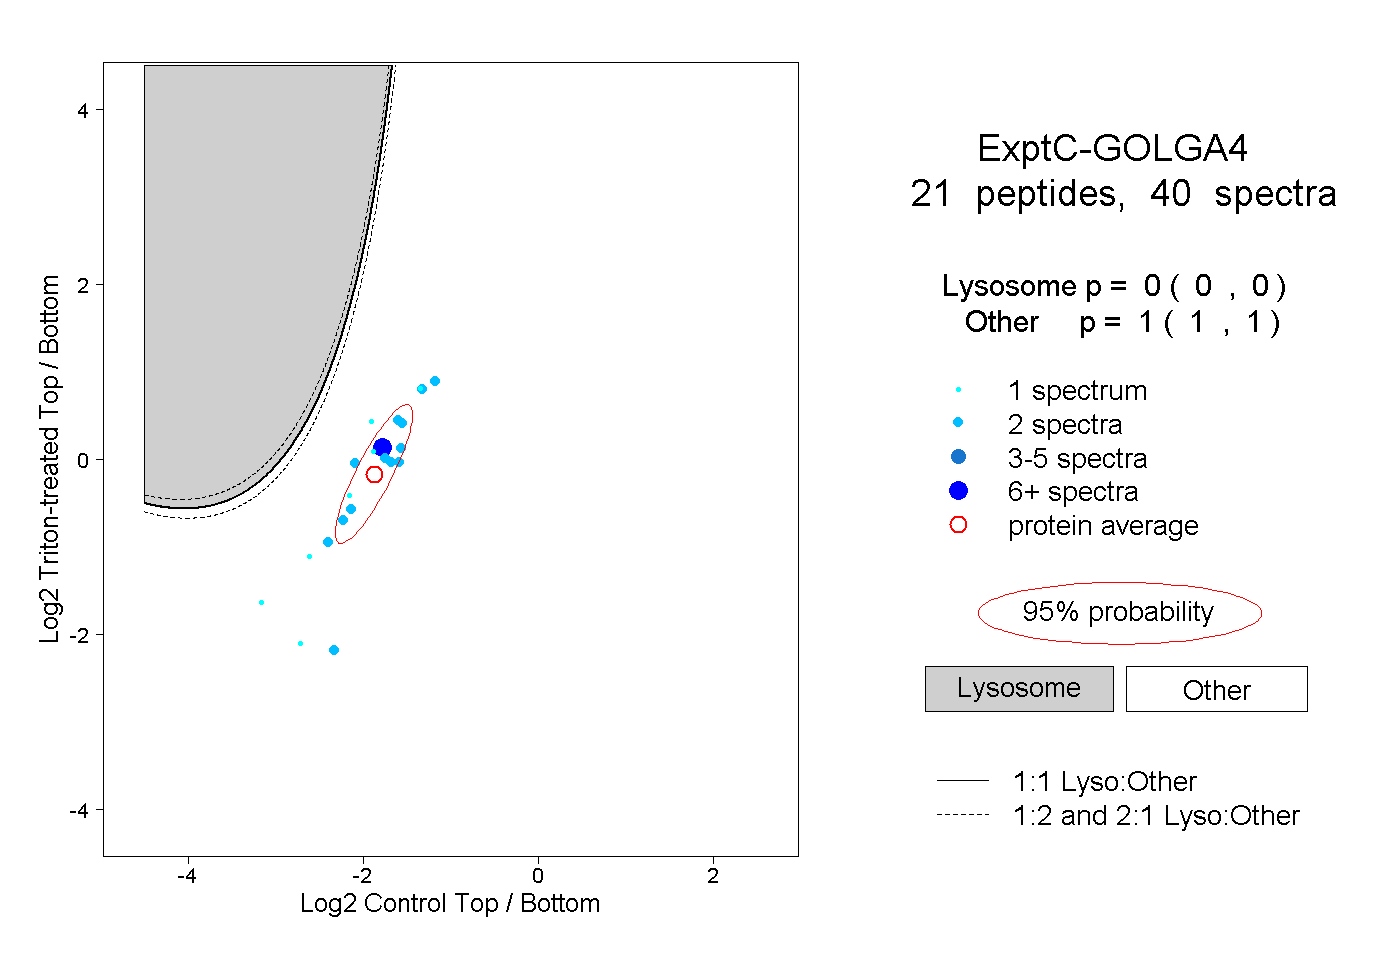 |
0.000 0.000 | 0.000 |
1.000 1.000 | 1.000 |
||||||||
| Plot | Lyso | Other | |||||||||||
| Expt D |
3 peptides |
3 spectra |
 |
0.000 0.000 | 0.002 |
1.000 0.998 | 1.000 |