 10
10peptides
spectra
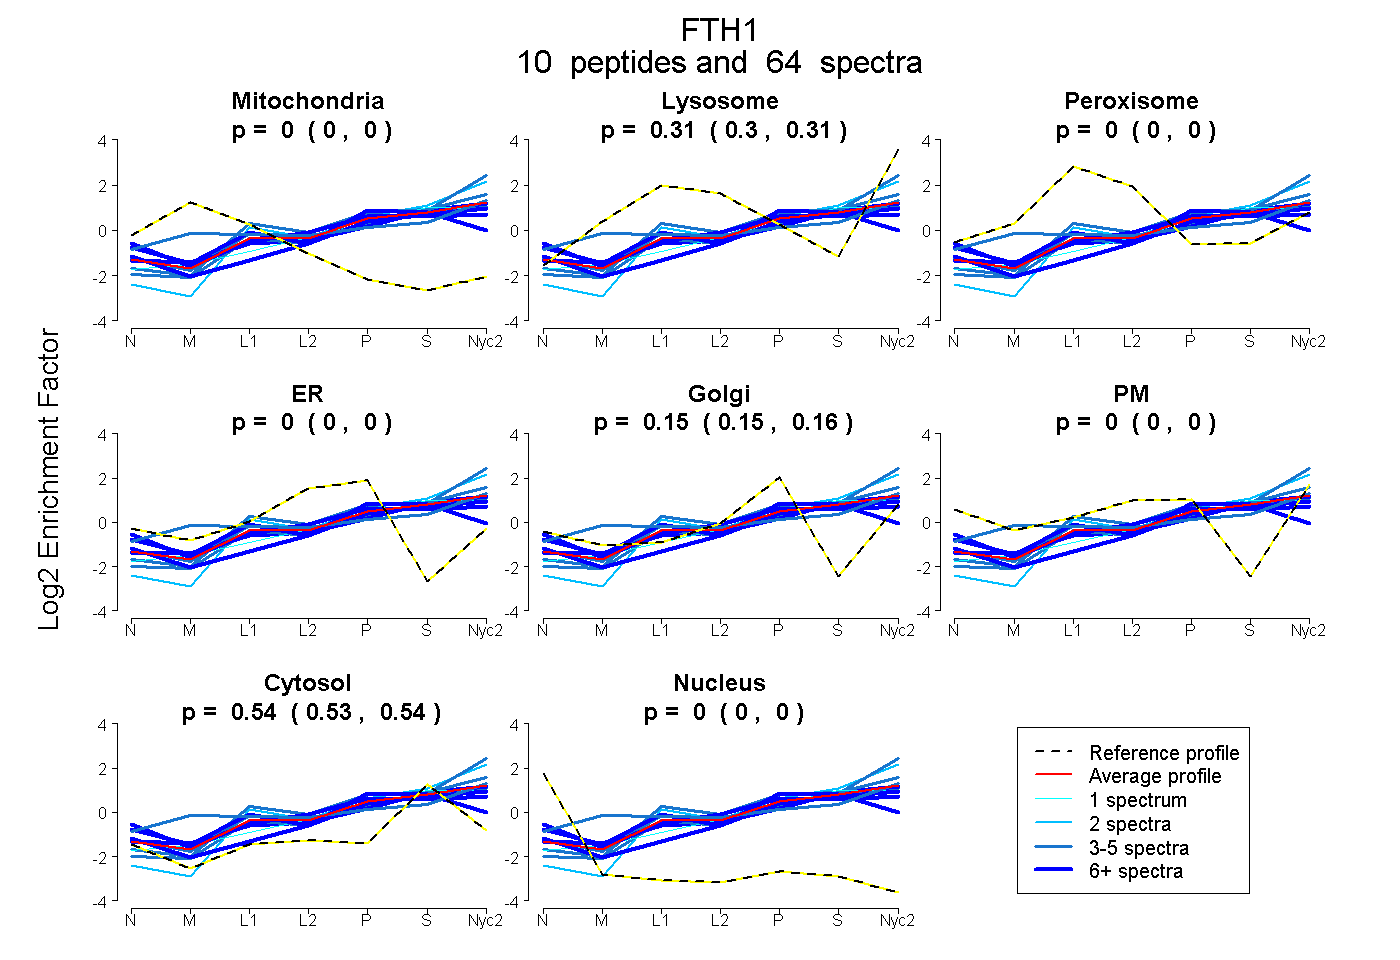
0.000 | 0.000
0.298 | 0.313
0.000 | 0.000
0.000 | 0.000
0.147 | 0.160
0.000 | 0.000
0.534 | 0.544
0.000 | 0.000
5peptides
spectra
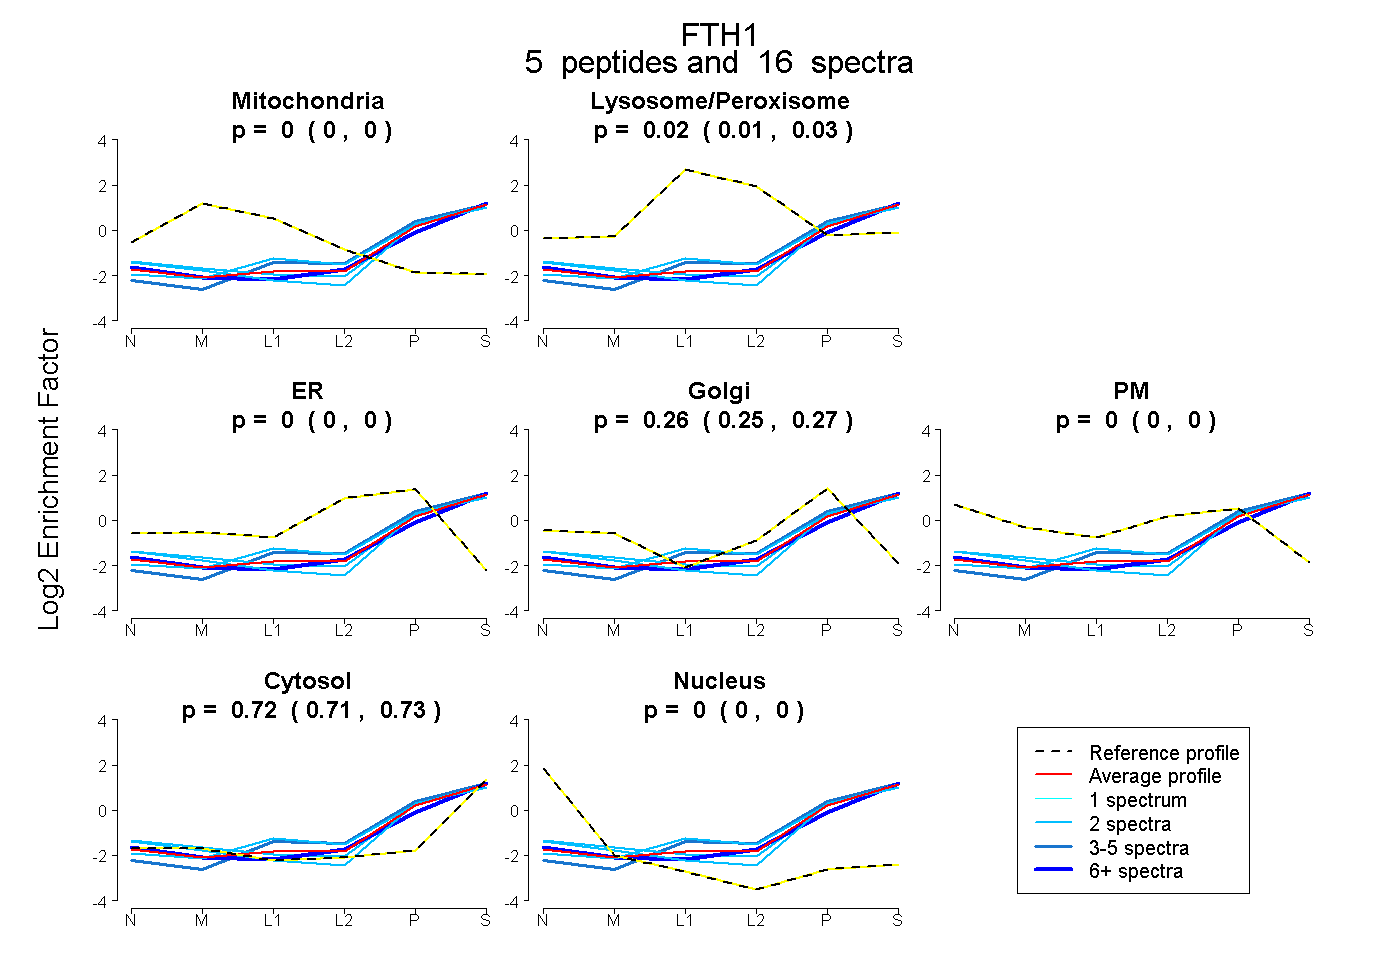
0.000 | 0.000
0.005 | 0.033
0.000 | 0.000
0.247 | 0.271
0.000 | 0.000
0.708 | 0.728
0.000 | 0.000
8peptides
spectra
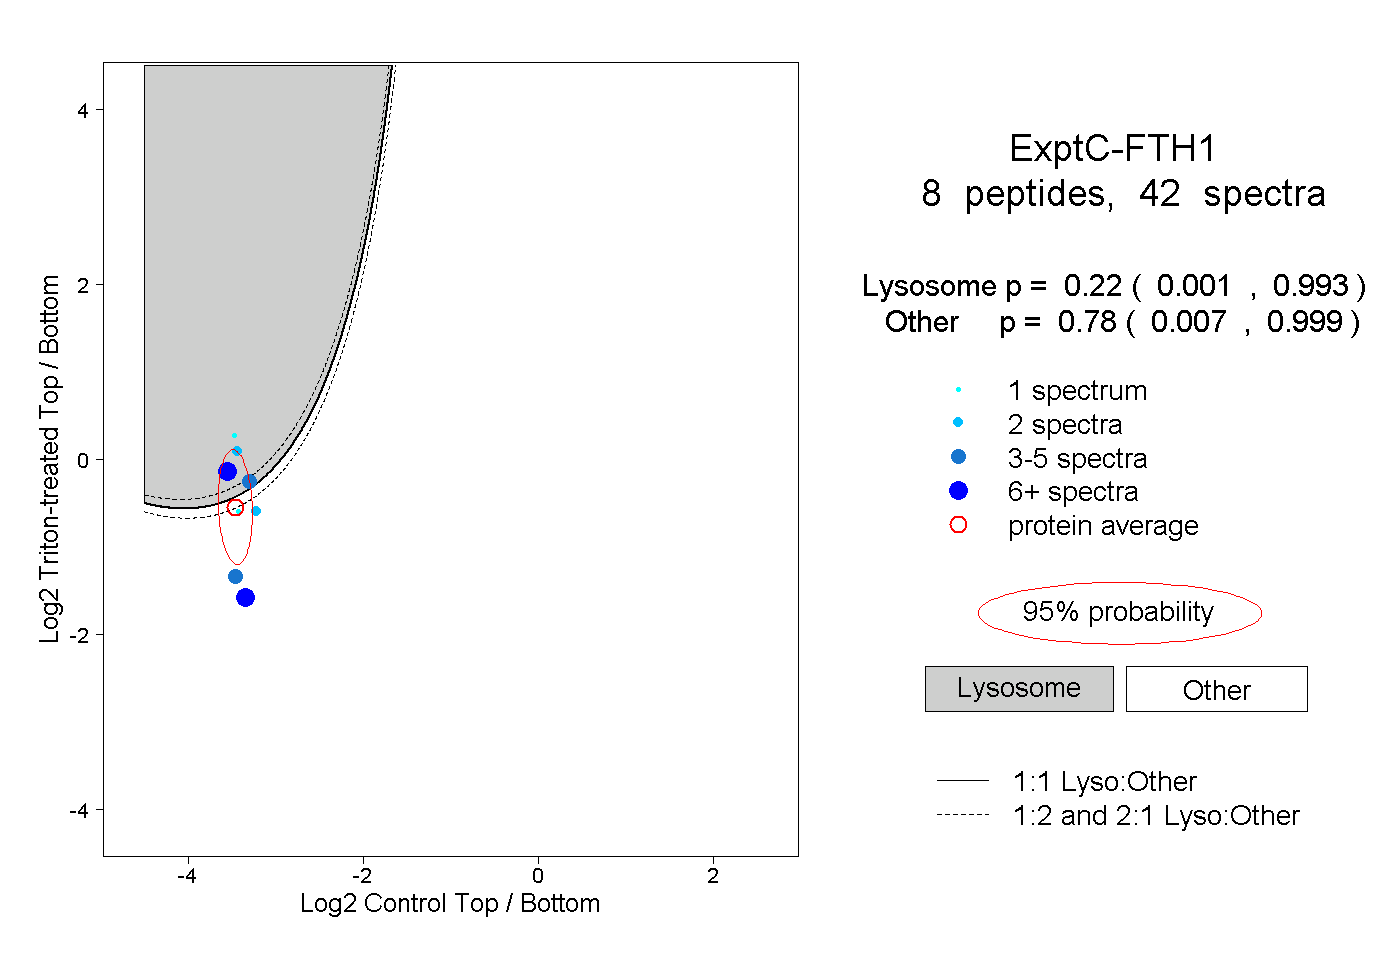
0.001 | 0.993
0.007 | 0.999
3peptides
spectra
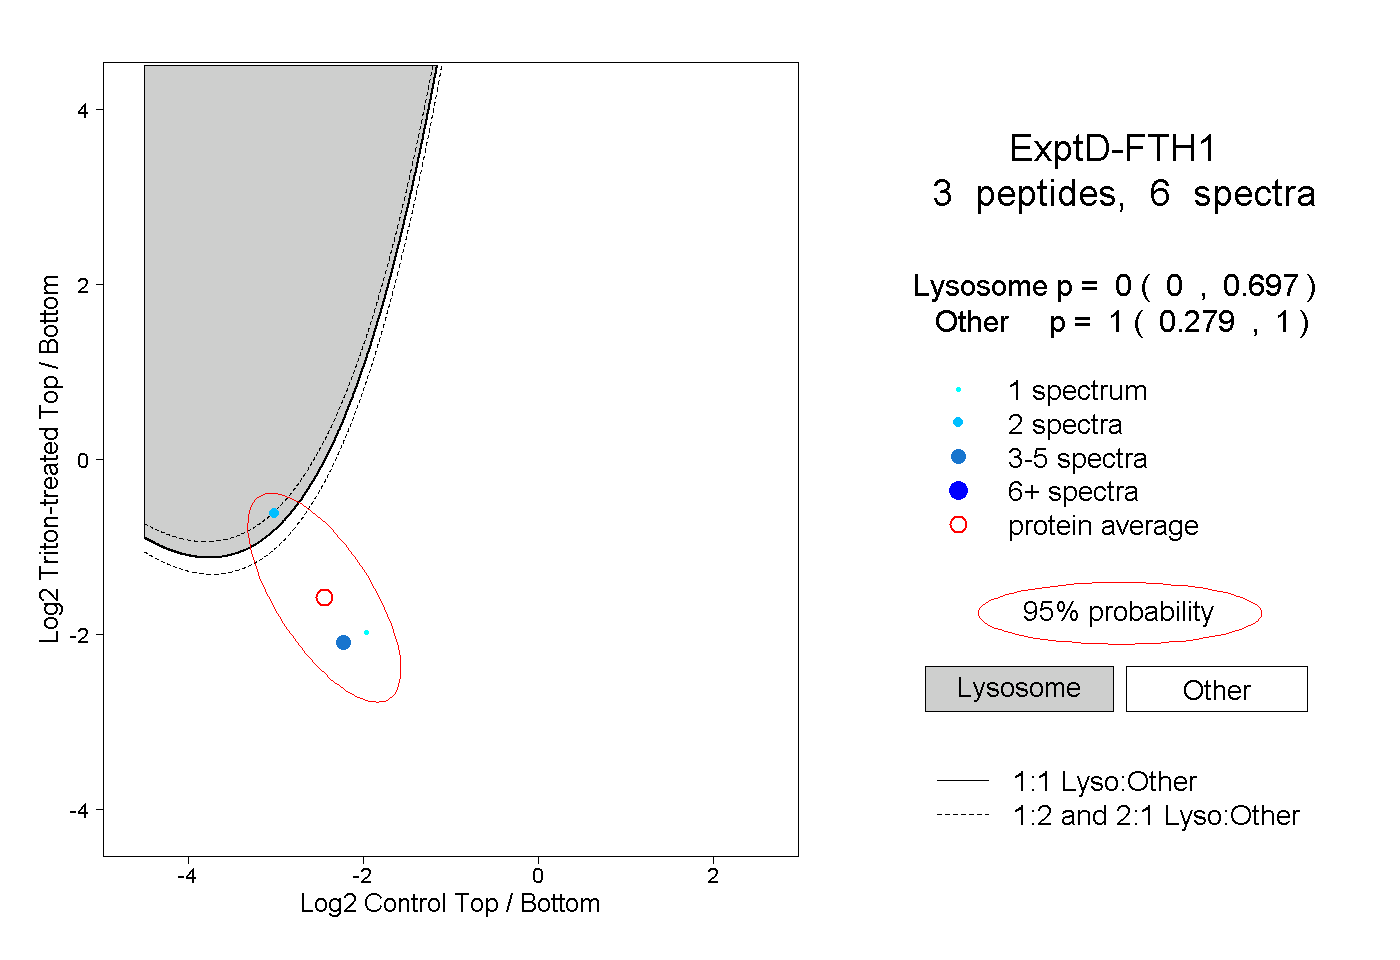
0.000 | 0.697
0.279 | 1.000