 10
10peptides
spectra
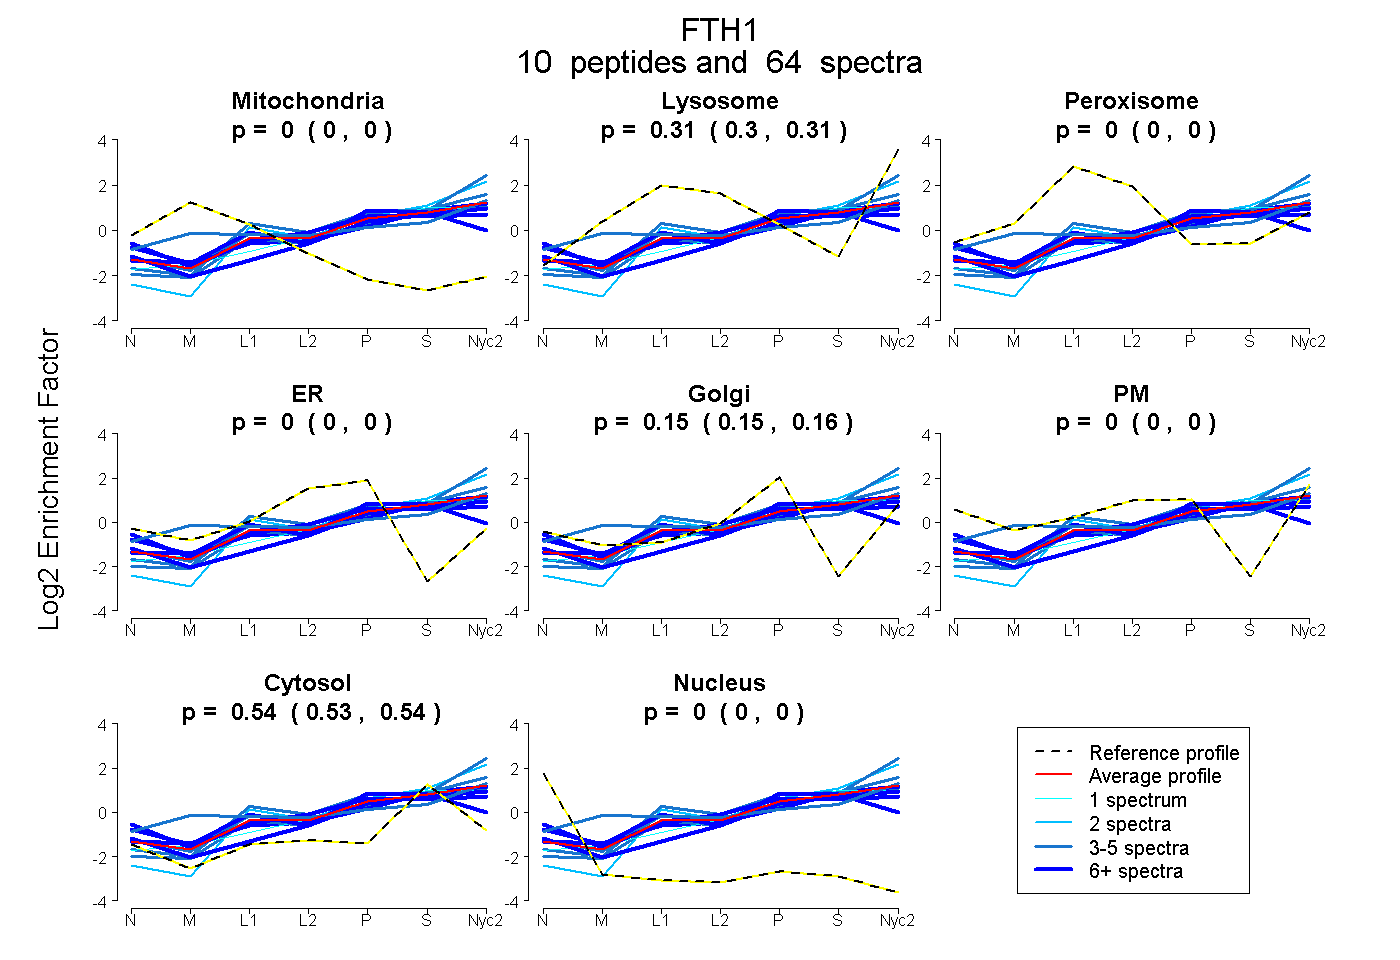
0.000 | 0.000
0.298 | 0.313
0.000 | 0.000
0.000 | 0.000
0.147 | 0.160
0.000 | 0.000
0.534 | 0.544
0.000 | 0.000
| Plot | Mito | Lyso | Perox | ER | Golgi | PM | Cytosol | Nucleus | |||||
| Expt A |
10 peptides |
64 spectra |
|
0.000 0.000 | 0.000 |
0.306 0.298 | 0.313 |
0.000 0.000 | 0.000 |
0.000 0.000 | 0.000 |
0.154 0.147 | 0.160 |
0.000 0.000 | 0.000 |
0.539 0.534 | 0.544 |
0.000 0.000 | 0.000 |
| 6 spectra, HTLGHGDES | 0.000 | 0.312 | 0.000 | 0.000 | 0.104 | 0.000 | 0.584 | 0.000 | ||
| 5 spectra, MGAPESGMAEYLFDK | 0.000 | 0.322 | 0.000 | 0.000 | 0.124 | 0.000 | 0.554 | 0.000 | ||
| 4 spectra, IFLQDIK | 0.000 | 0.506 | 0.000 | 0.000 | 0.040 | 0.000 | 0.454 | 0.000 | ||
| 1 spectrum, NDPHLCDFIETHYLNEQVK | 0.000 | 0.268 | 0.000 | 0.000 | 0.126 | 0.000 | 0.606 | 0.000 | ||
| 7 spectra, TTASPSQVR | 0.000 | 0.008 | 0.000 | 0.000 | 0.375 | 0.000 | 0.617 | 0.000 | ||
| 5 spectra, ELGDHVTNLR | 0.000 | 0.324 | 0.000 | 0.000 | 0.102 | 0.000 | 0.574 | 0.000 | ||
| 8 spectra, SVNQSLLELHK | 0.000 | 0.289 | 0.000 | 0.000 | 0.175 | 0.000 | 0.536 | 0.000 | ||
| 2 spectra, DDWESGLNAMECALHLEK | 0.000 | 0.425 | 0.000 | 0.000 | 0.000 | 0.000 | 0.575 | 0.000 | ||
| 22 spectra, QNYHQDSEAAINR | 0.000 | 0.180 | 0.000 | 0.000 | 0.211 | 0.099 | 0.509 | 0.000 | ||
| 4 spectra, YFLHQSHEER | 0.021 | 0.396 | 0.000 | 0.000 | 0.098 | 0.058 | 0.427 | 0.000 |
| Plot | Mito | Lyso or Perox | ER | Golgi | PM | Cytosol | Nucleus | ||||||
| Expt B |
5 peptides |
16 spectra |
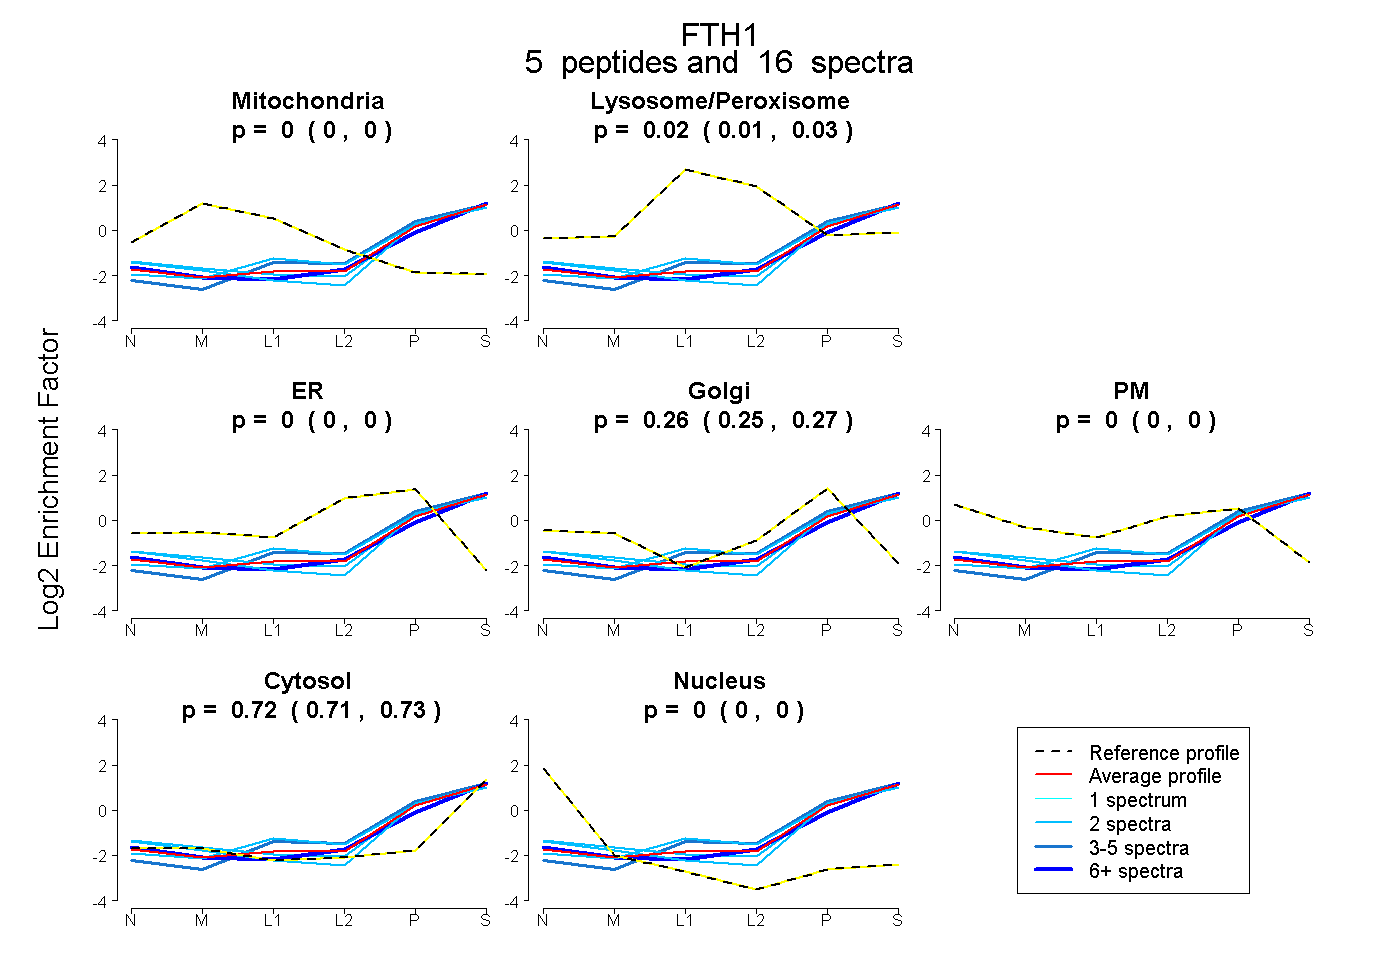 |
0.000 0.000 | 0.000 |
0.021 0.005 | 0.033 |
0.000 0.000 | 0.000 |
0.260 0.247 | 0.271 |
0.000 0.000 | 0.000 |
0.719 0.708 | 0.728 |
0.000 0.000 | 0.000 |
|||
| Plot | Lyso | Other | |||||||||||
| Expt C |
8 peptides |
42 spectra |
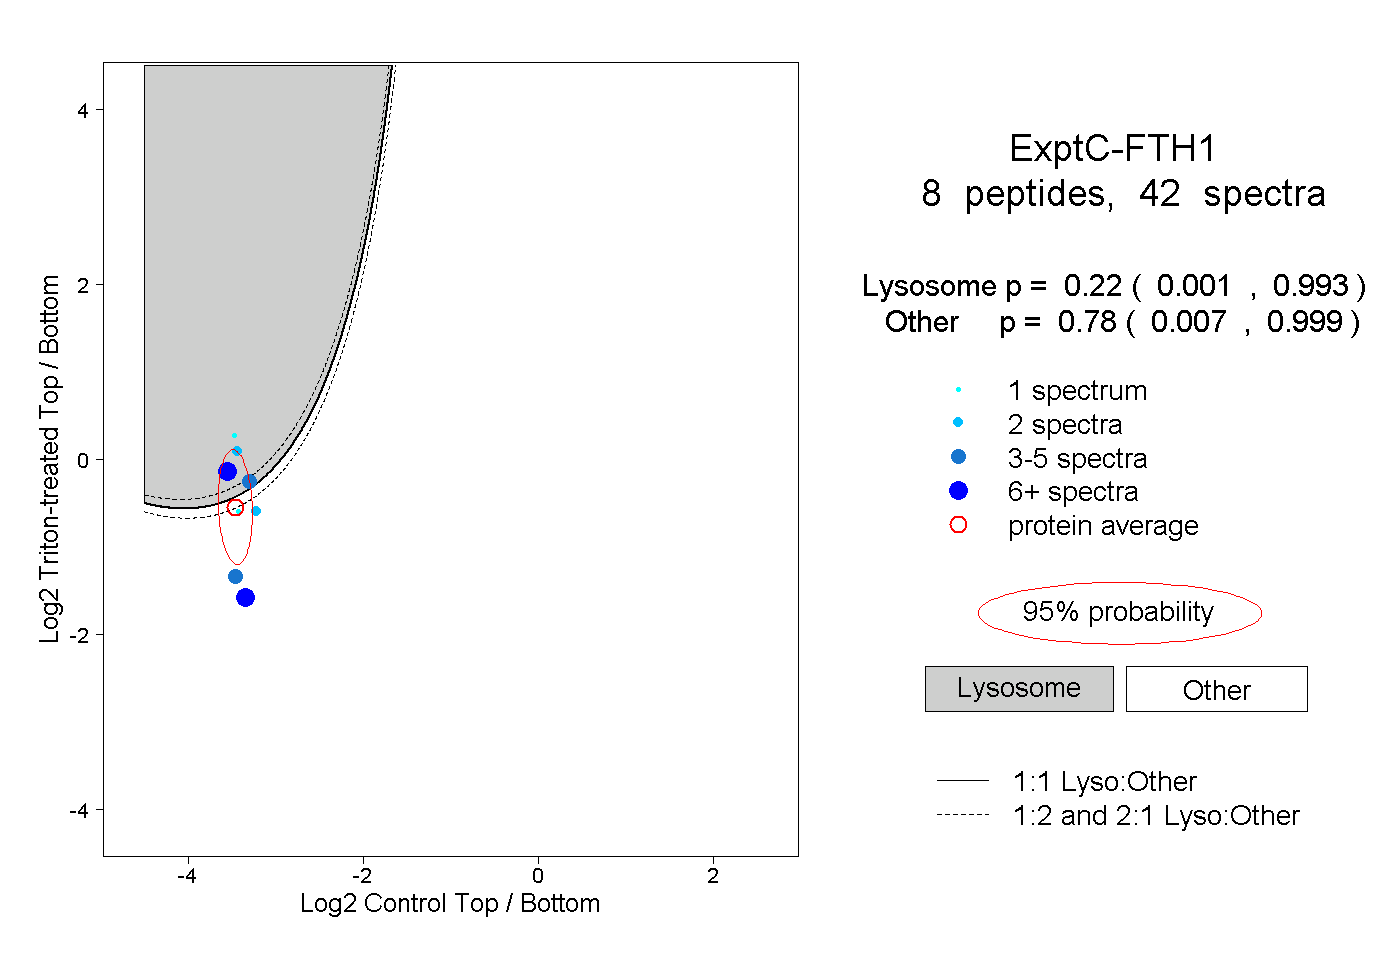 |
0.220 0.001 | 0.993 |
0.780 0.007 | 0.999 |
||||||||
| Plot | Lyso | Other | |||||||||||
| Expt D |
3 peptides |
6 spectra |
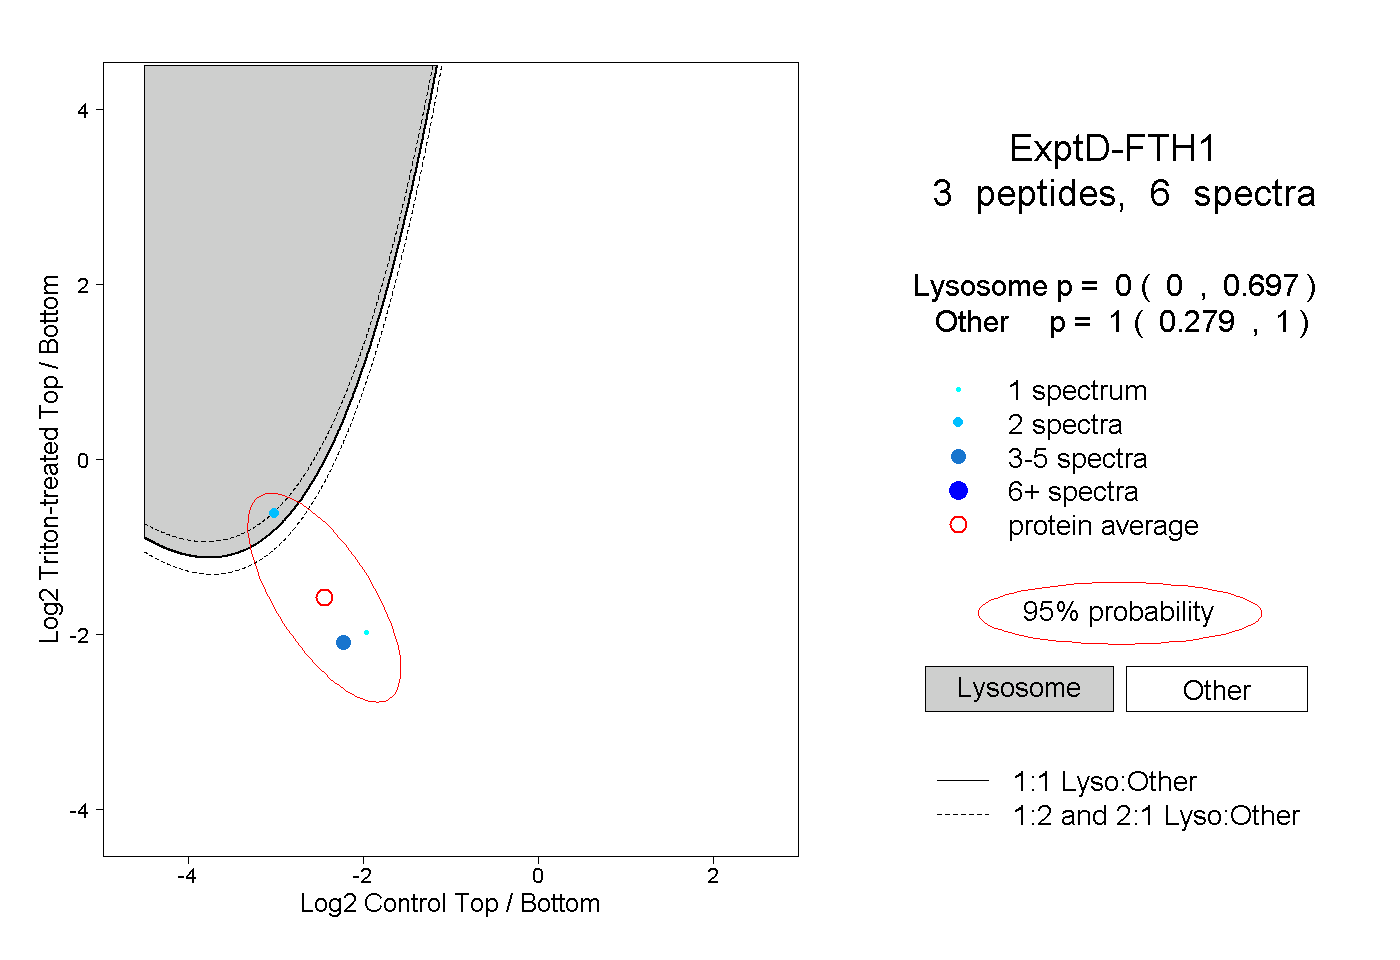 |
0.000 0.000 | 0.697 |
1.000 0.279 | 1.000 |