FTH1
[ENSRNOP00000037803]
Main page
| | | Plot |
Mito |
Lyso |
|
Perox |
ER |
Golgi |
PM |
Cytosol |
Nucleus |
|
| Expt A |
 10
10
peptides |
64
spectra |
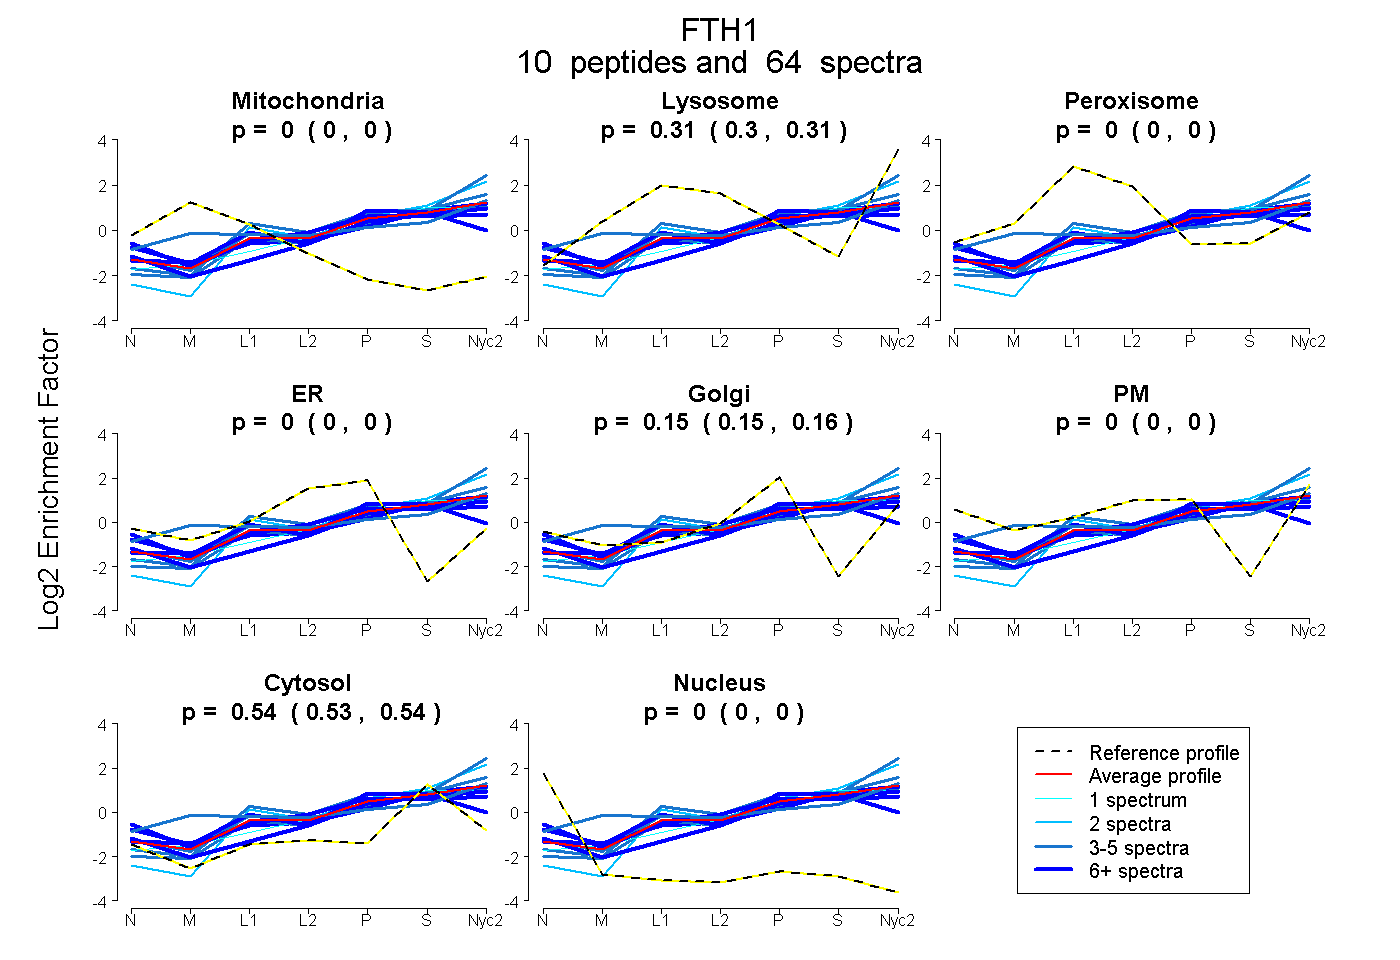 |
0.000
0.000 | 0.000 |
0.306
0.298 | 0.313 |
|
0.000
0.000 | 0.000 |
0.000
0.000 | 0.000 |
0.154
0.147 | 0.160 |
0.000
0.000 | 0.000 |
0.539
0.534 | 0.544 |
0.000
0.000 | 0.000 |
|
| | | Plot |
Mito |
|
Lyso or Perox |
|
ER |
Golgi |
PM |
Cytosol |
Nucleus |
|
| Expt B |
5
peptides |
16
spectra |
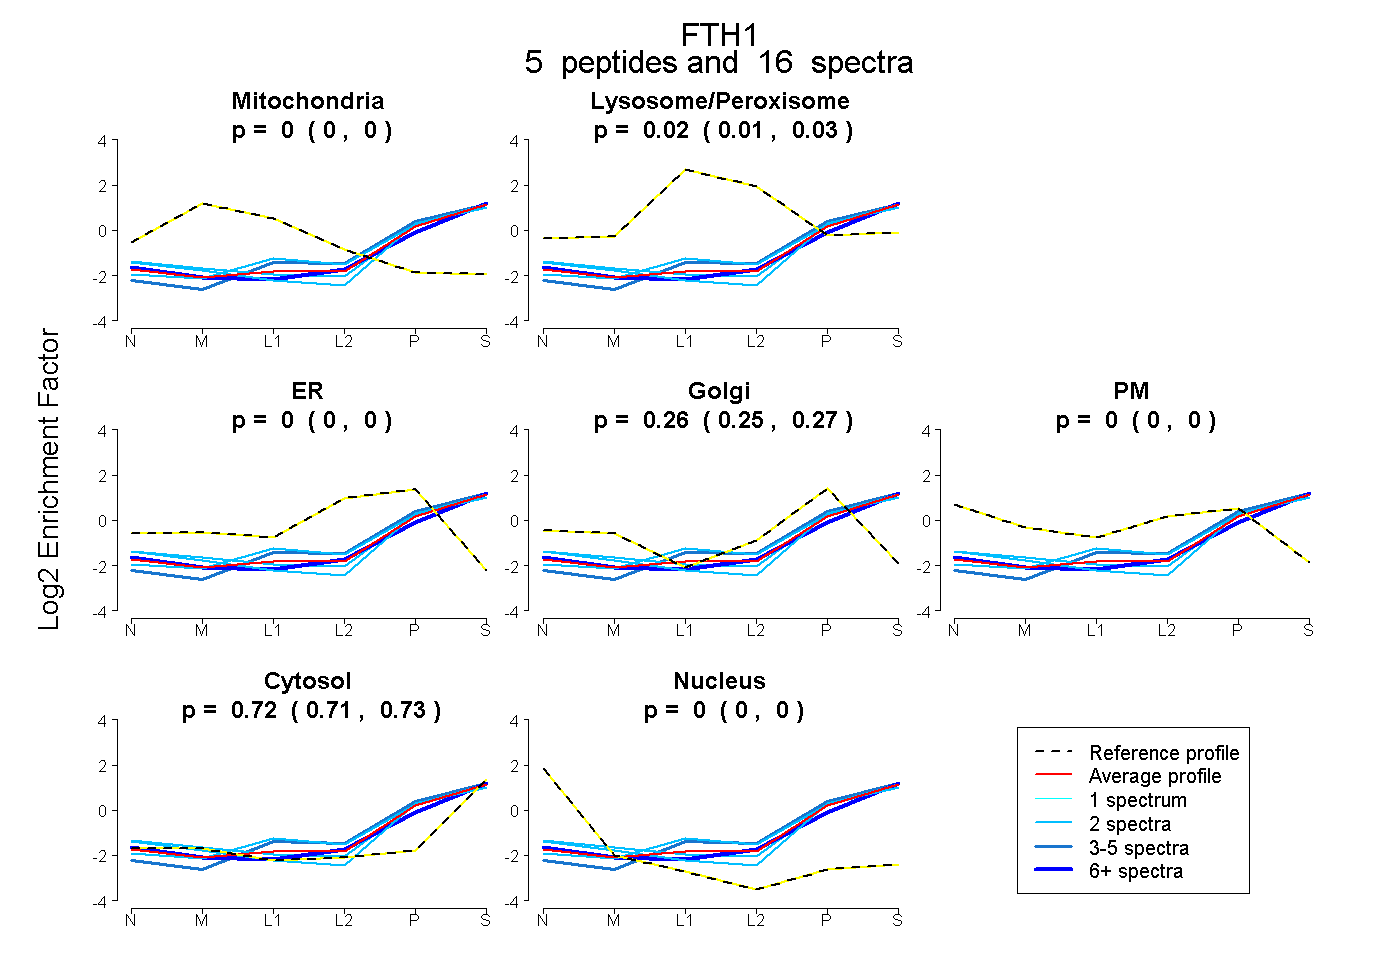 |
0.000
0.000 | 0.000 |
|
0.021
0.005 | 0.033 |
|
0.000
0.000 | 0.000 |
0.260
0.247 | 0.271 |
0.000
0.000 | 0.000 |
0.719
0.708 | 0.728 |
0.000
0.000 | 0.000 |
|
| 2 spectra, SVNQSLLELHK |
0.000 |
|
0.121 |
|
0.000 |
0.199 |
0.000 |
0.680 |
0.000 |
|
| 2 spectra, MAEAPSQVR |
0.000 |
|
0.000 |
|
0.000 |
0.329 |
0.000 |
0.671 |
0.000 |
|
| 7 spectra, QNYHQDSEAAINR |
0.000 |
|
0.000 |
|
0.000 |
0.235 |
0.000 |
0.765 |
0.000 |
|
| 3 spectra, IFLQDIK |
0.000 |
|
0.009 |
|
0.235 |
0.000 |
0.000 |
0.756 |
0.000 |
|
| 2 spectra, TTASPSQVR |
0.000 |
|
0.000 |
|
0.000 |
0.303 |
0.000 |
0.697 |
0.000 |
|
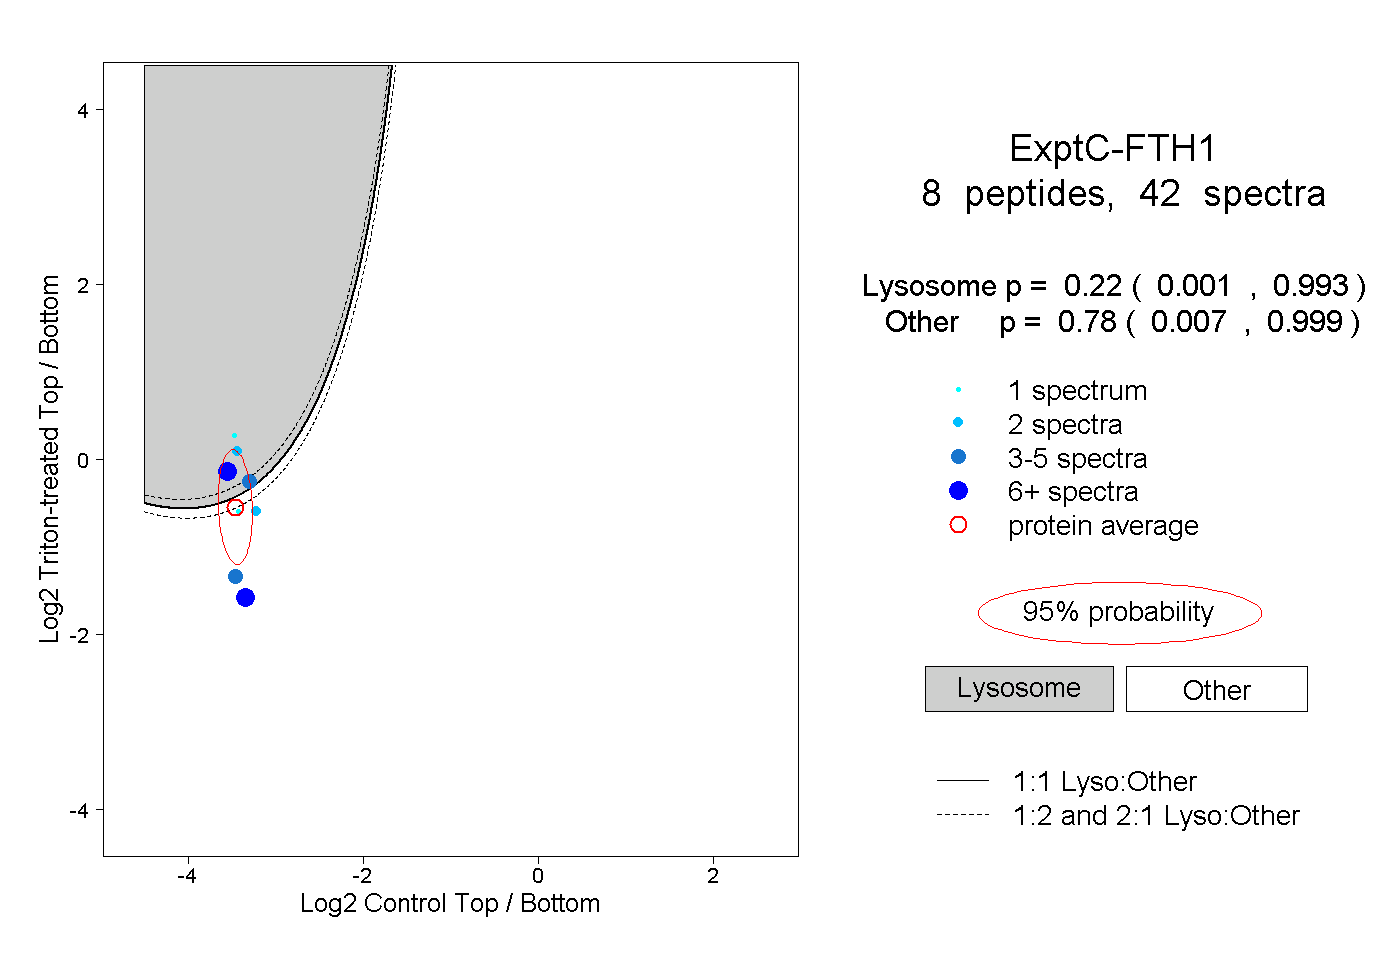
| | | Plot |
|
Lyso |
|
|
|
|
|
|
|
Other |
| Expt C |
8
peptides |
42
spectra |
 |
|
0.220
0.001 | 0.993 |
|
|
|
|
|
|
|
0.780
0.007 | 0.999 |
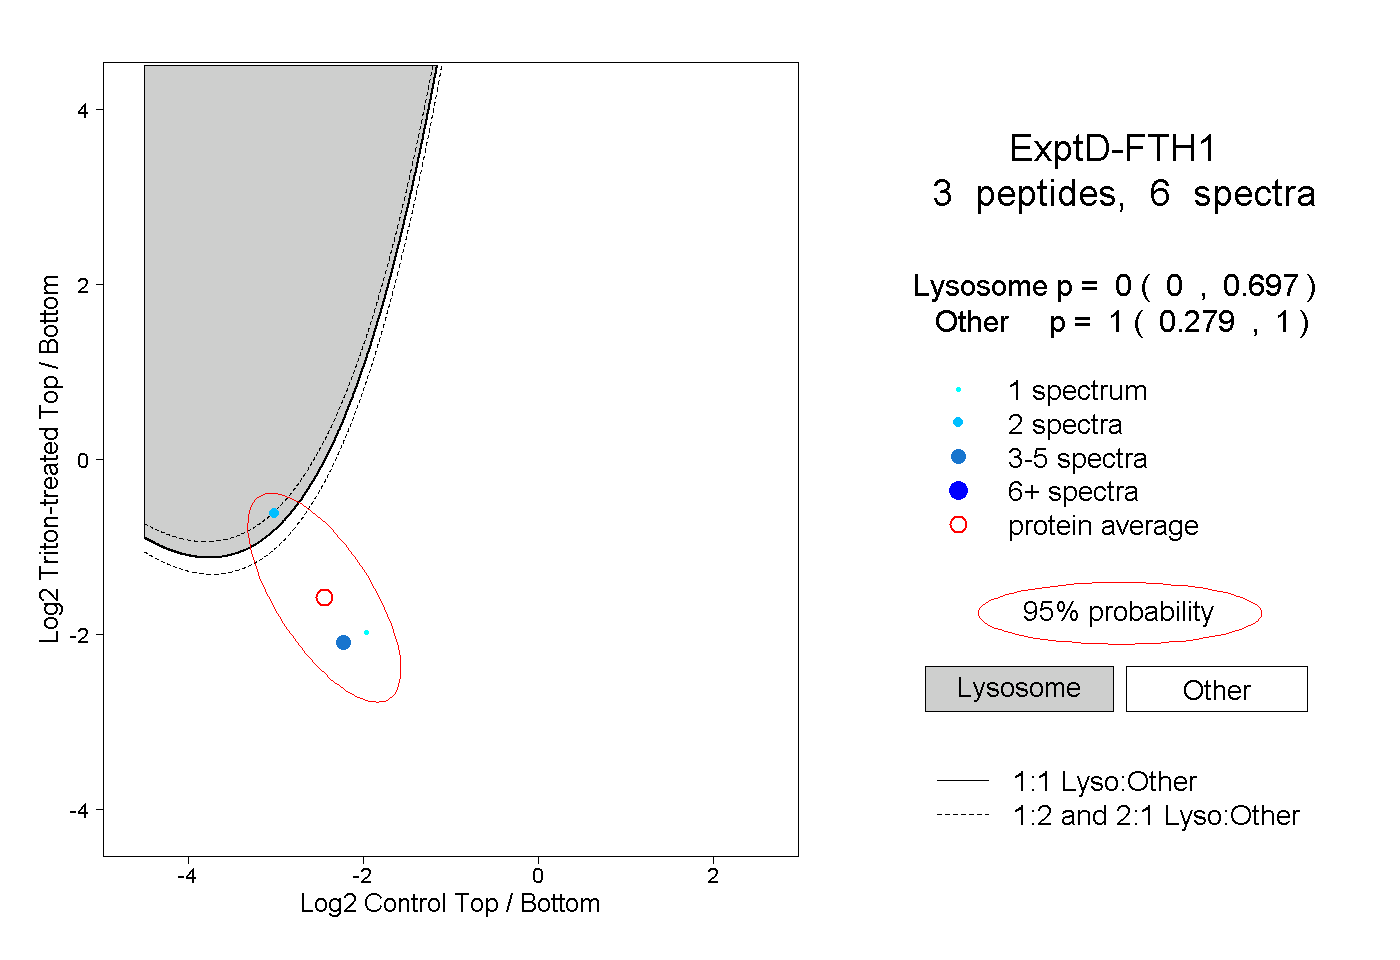
| | | Plot |
|
Lyso |
|
|
|
|
|
|
|
Other |
| Expt D |
3
peptides |
6
spectra |
 |
|
0.000
0.000 | 0.697 |
|
|
|
|
|
|
|
1.000
0.279 | 1.000 |