 7
7peptides
spectra
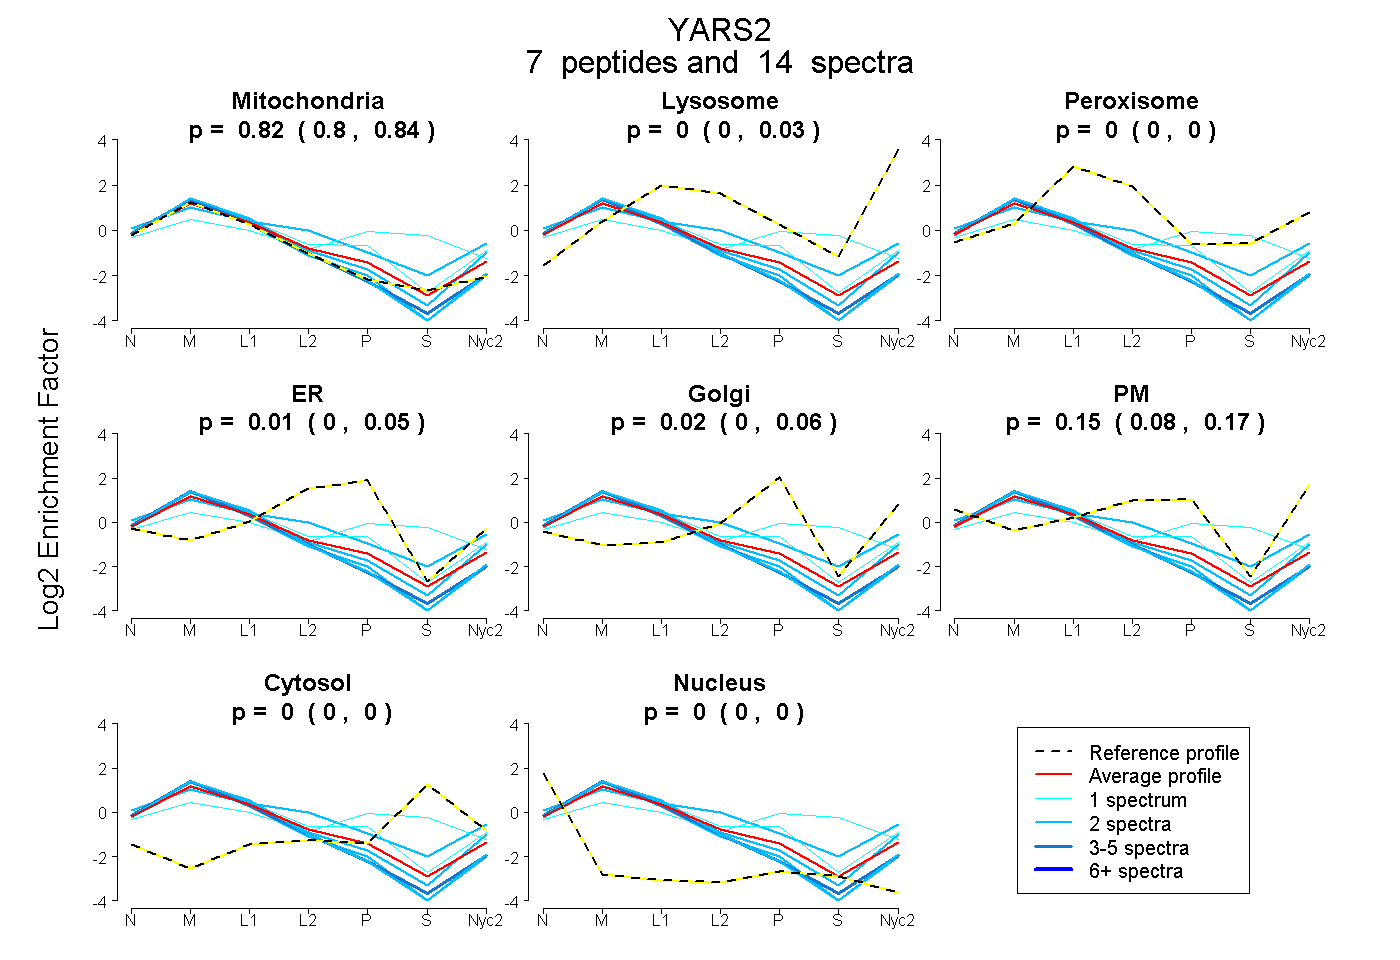
0.800 | 0.844
0.000 | 0.027
0.000 | 0.000
0.000 | 0.049
0.000 | 0.057
0.084 | 0.166
0.000 | 0.000
0.000 | 0.000
4peptides
spectra
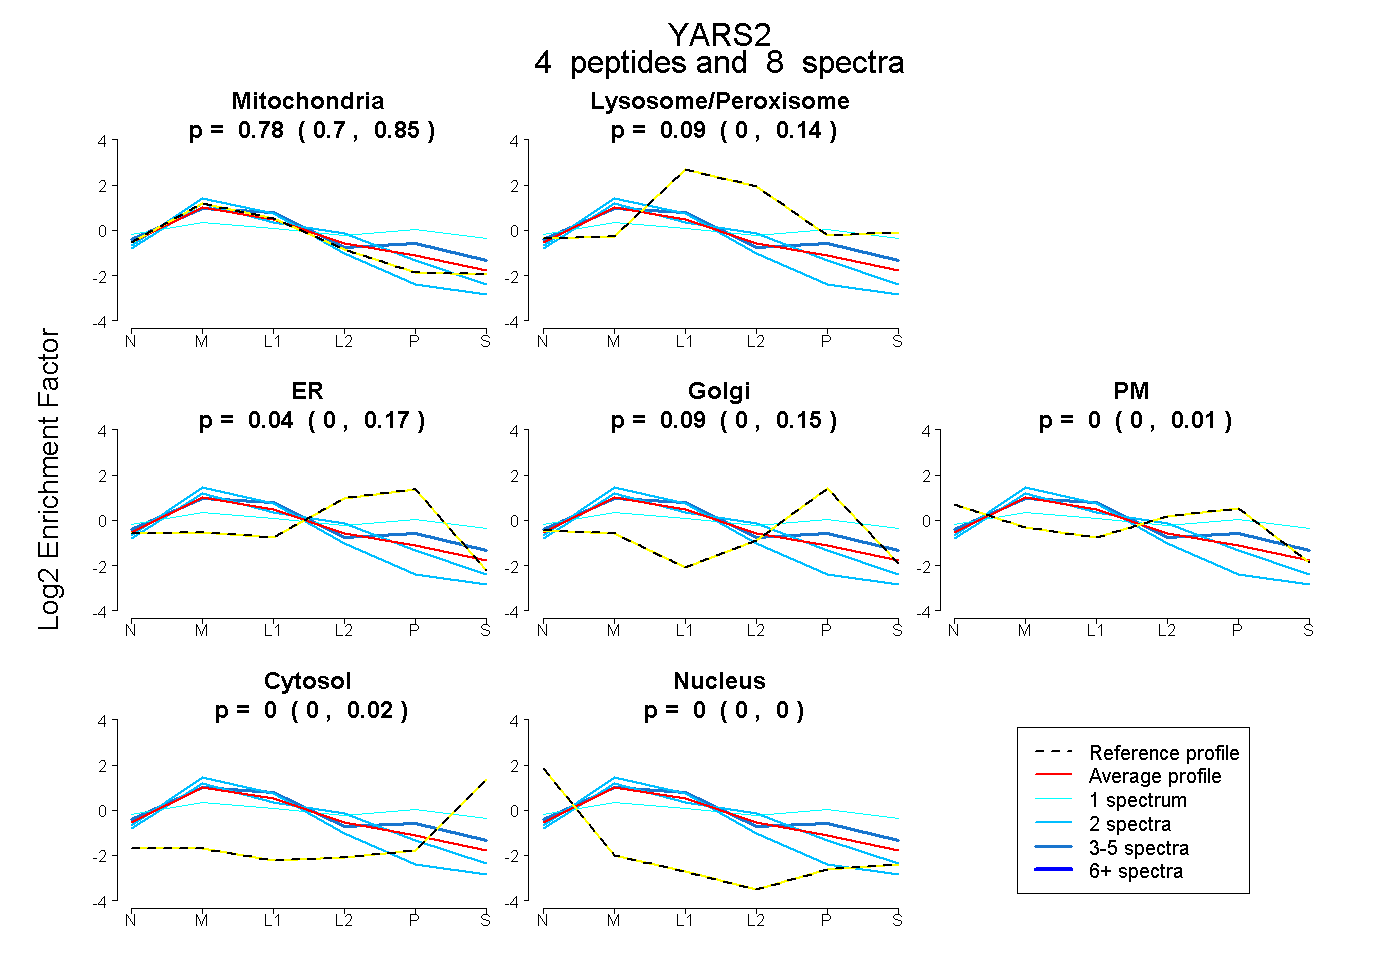
0.695 | 0.851
0.000 | 0.144
0.000 | 0.170
0.000 | 0.154
0.000 | 0.008
0.000 | 0.019
0.000 | 0.000
15peptides
spectra
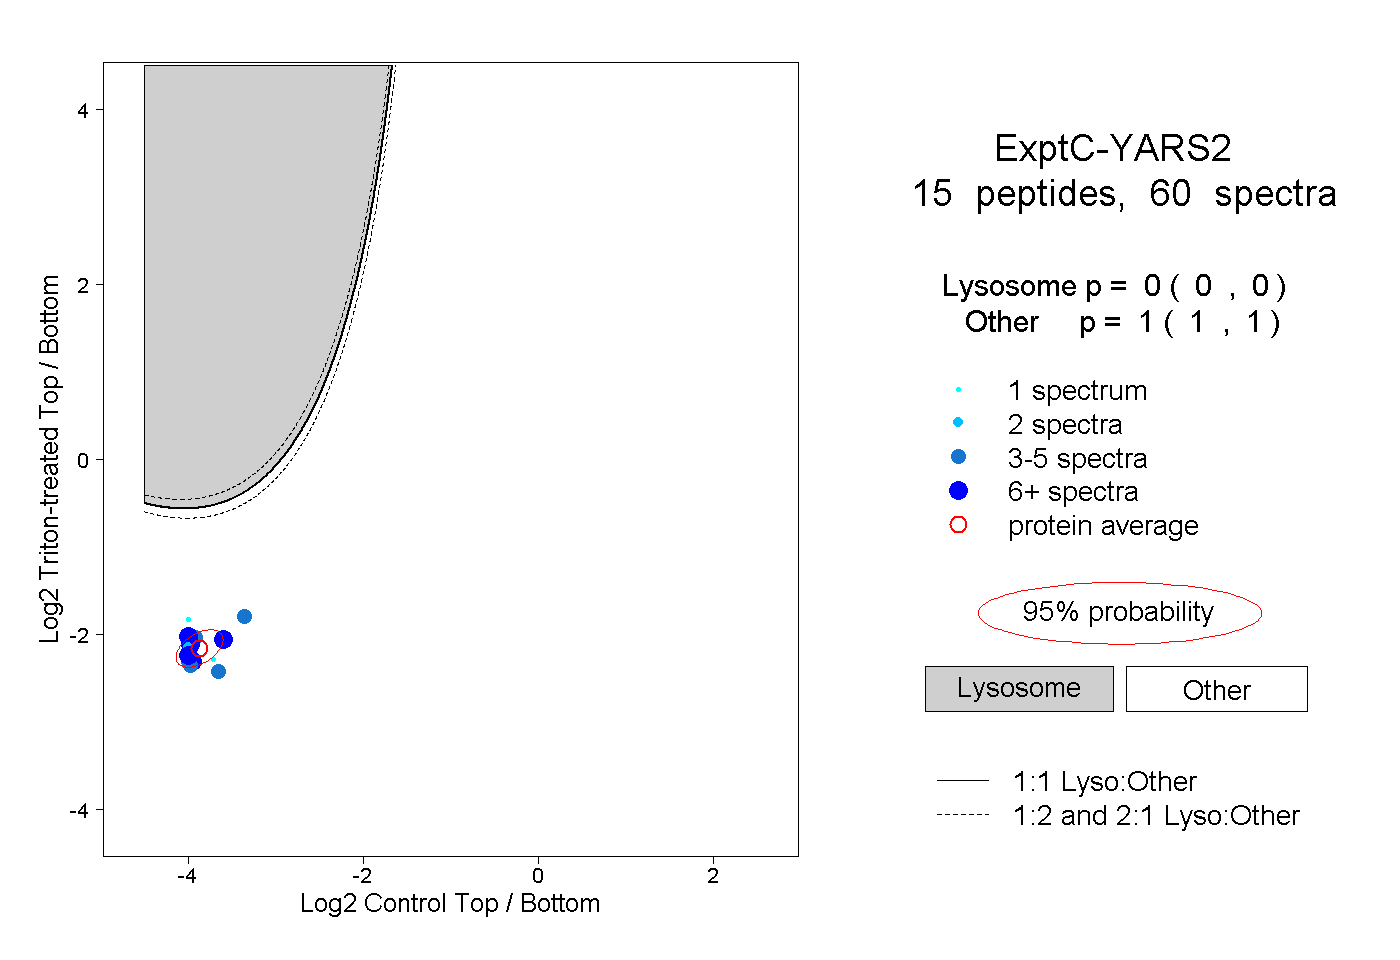
0.000 | 0.000
1.000 | 1.000
4peptides
spectra
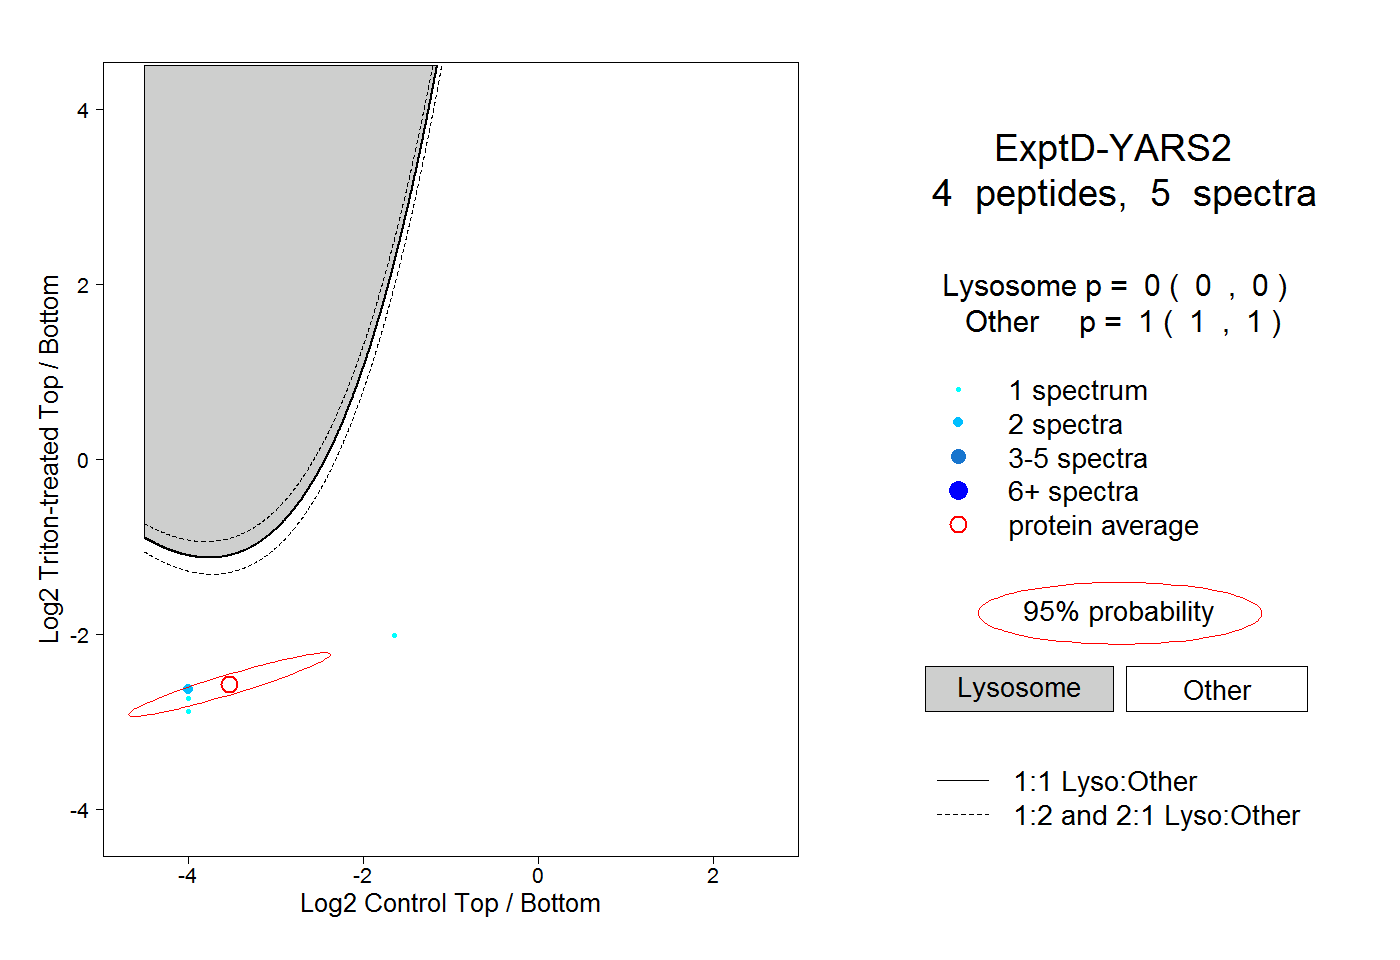
0.000 | 0.000
1.000 | 1.000