 7
7peptides
spectra
0.800 | 0.844
0.000 | 0.027
0.000 | 0.000
0.000 | 0.049
0.000 | 0.057
0.084 | 0.166
0.000 | 0.000
0.000 | 0.000
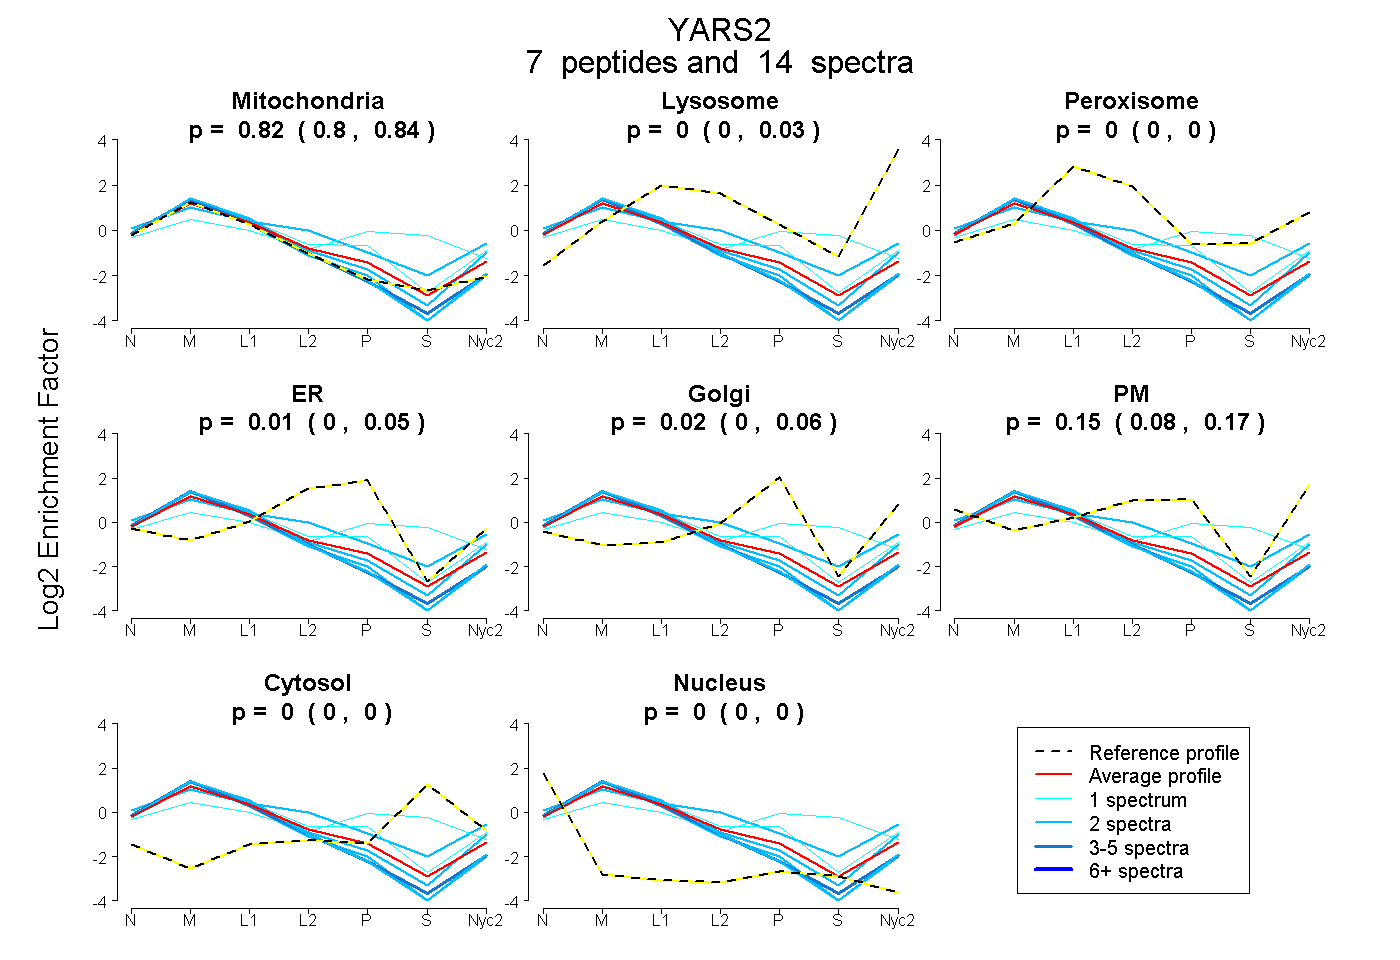
| Plot | Mito | Lyso | Perox | ER | Golgi | PM | Cytosol | Nucleus | |||||
| Expt A |
7 peptides |
14 spectra |
|
0.823 0.800 | 0.844 |
0.000 0.000 | 0.027 |
0.000 0.000 | 0.000 |
0.007 0.000 | 0.049 |
0.023 0.000 | 0.057 |
0.146 0.084 | 0.166 |
0.000 0.000 | 0.000 |
0.000 0.000 | 0.000 |
| 1 spectrum, EALSAECVR | 0.370 | 0.000 | 0.153 | 0.000 | 0.185 | 0.000 | 0.291 | 0.000 | ||
| 1 spectrum, LVHGQEGLDSAK | 0.677 | 0.058 | 0.000 | 0.036 | 0.104 | 0.125 | 0.000 | 0.000 | ||
| 2 spectra, SAGNAVWLNR | 0.834 | 0.040 | 0.000 | 0.000 | 0.000 | 0.126 | 0.000 | 0.000 | ||
| 4 spectra, TELPELFDR | 1.000 | 0.000 | 0.000 | 0.000 | 0.000 | 0.000 | 0.000 | 0.000 | ||
| 2 spectra, TSPFELYQFFIR | 1.000 | 0.000 | 0.000 | 0.000 | 0.000 | 0.000 | 0.000 | 0.000 | ||
| 2 spectra, ANAIPDGPR | 0.578 | 0.004 | 0.136 | 0.000 | 0.000 | 0.281 | 0.000 | 0.000 | ||
| 2 spectra, NFYIIK | 0.988 | 0.000 | 0.000 | 0.012 | 0.000 | 0.000 | 0.000 | 0.000 |
| Plot | Mito | Lyso or Perox | ER | Golgi | PM | Cytosol | Nucleus | ||||||
| Expt B |
4 peptides |
8 spectra |
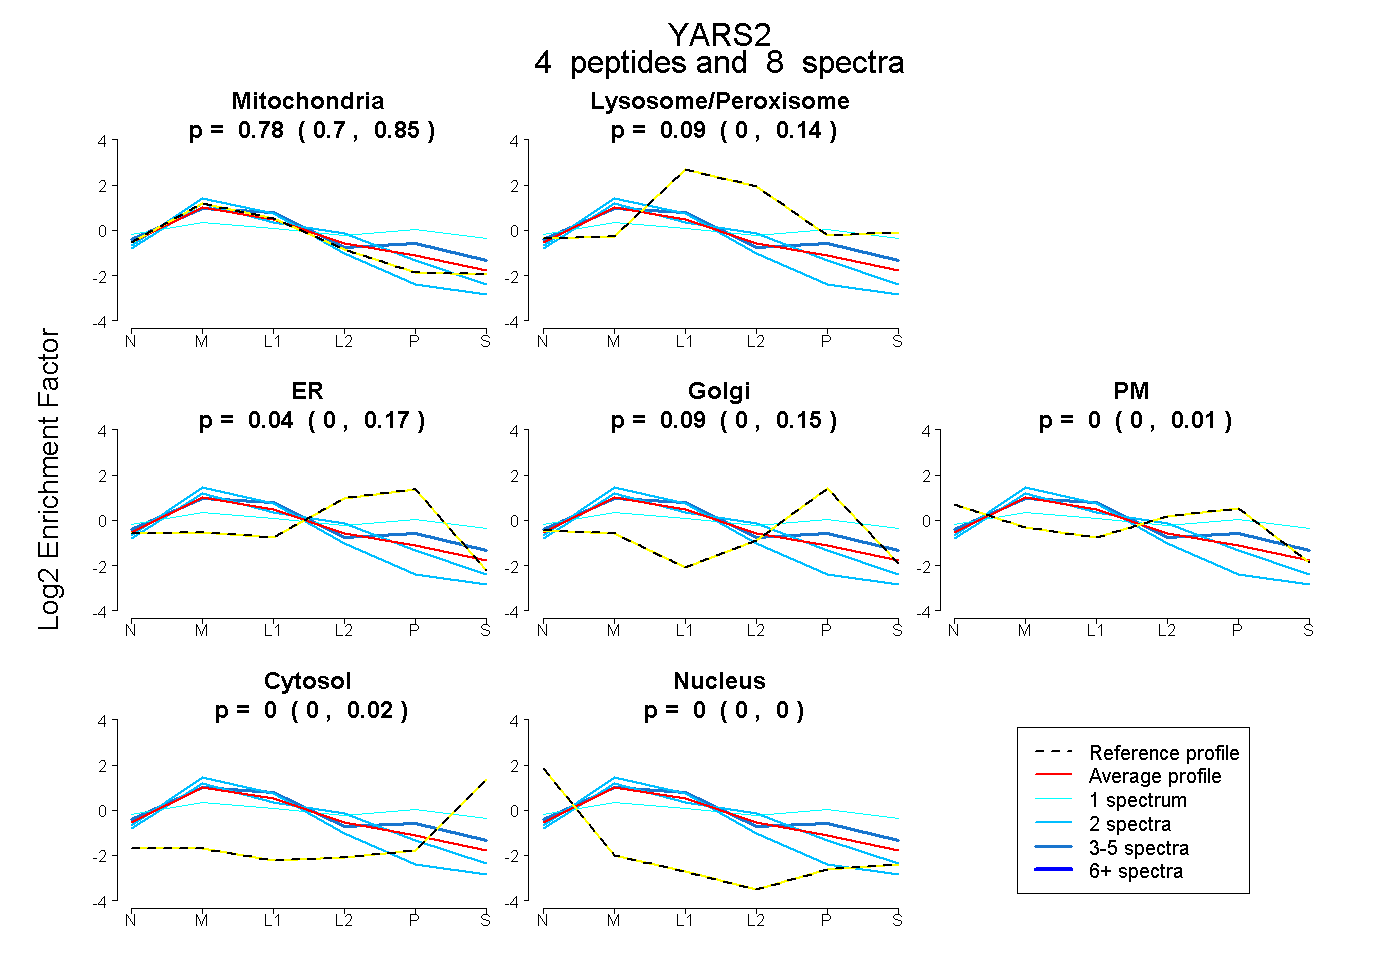 |
0.778 0.695 | 0.851 |
0.087 0.000 | 0.144 |
0.045 0.000 | 0.170 |
0.090 0.000 | 0.154 |
0.000 0.000 | 0.008 |
0.000 0.000 | 0.019 |
0.000 0.000 | 0.000 |
|||
| Plot | Lyso | Other | |||||||||||
| Expt C |
15 peptides |
60 spectra |
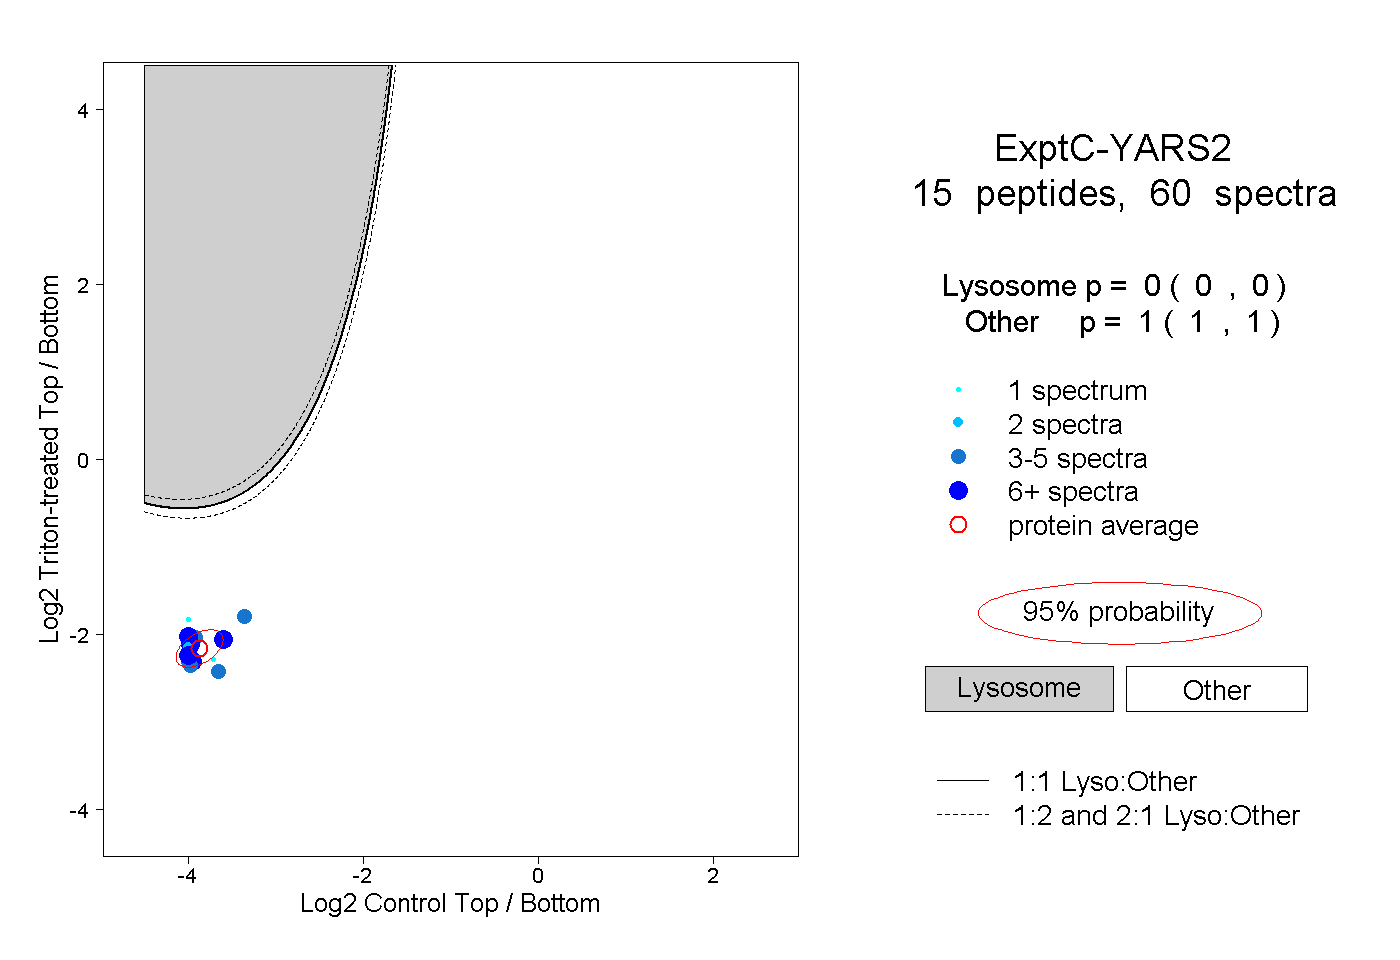 |
0.000 0.000 | 0.000 |
1.000 1.000 | 1.000 |
||||||||
| Plot | Lyso | Other | |||||||||||
| Expt D |
4 peptides |
5 spectra |
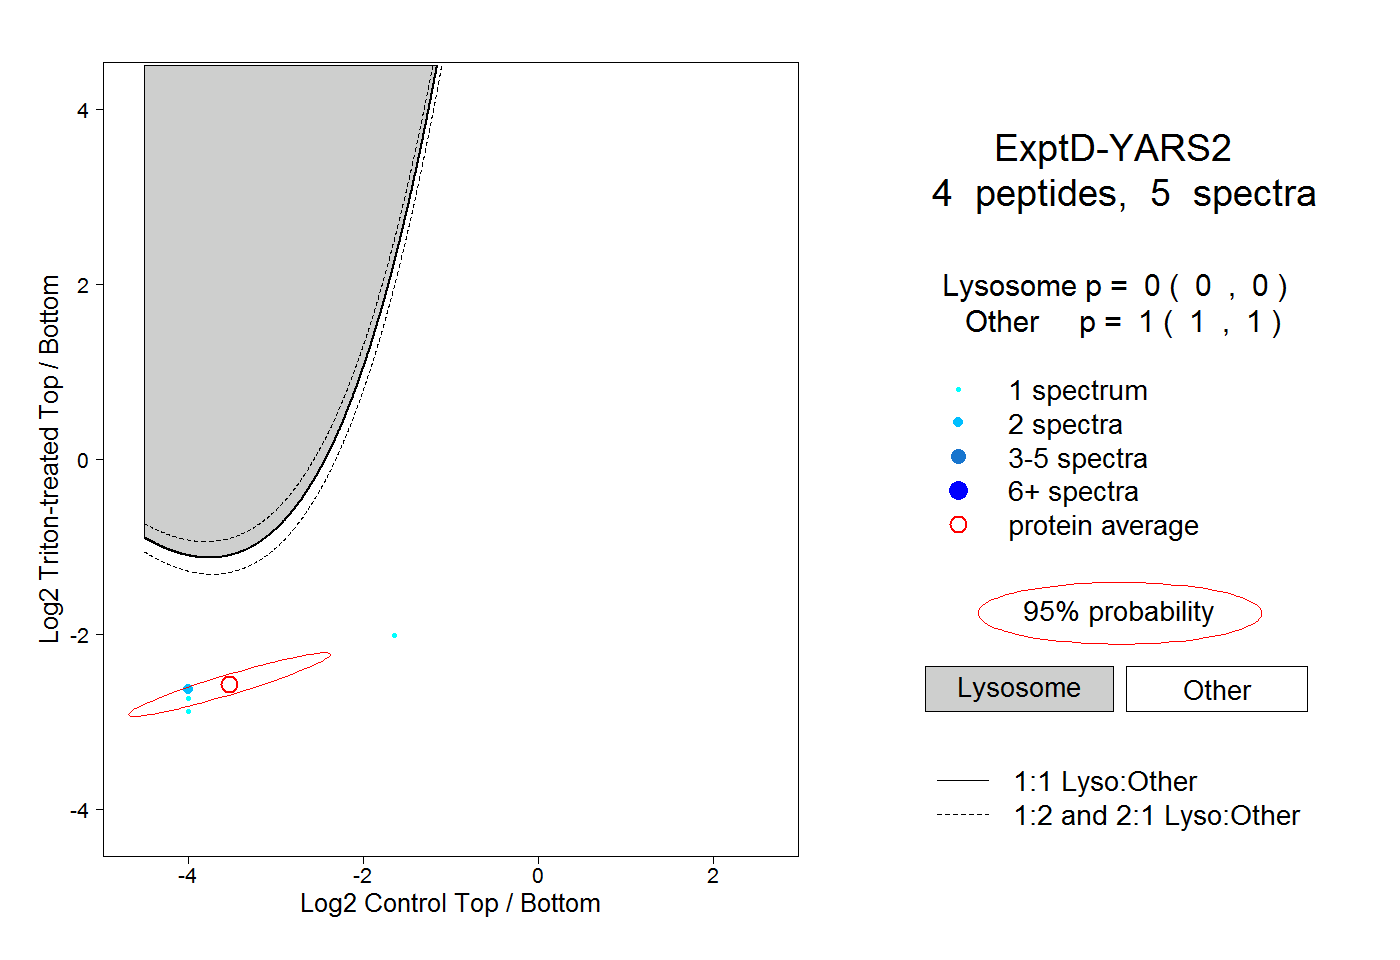 |
0.000 0.000 | 0.000 |
1.000 1.000 | 1.000 |