YARS2
[ENSRNOP00000037398]
Main page
| | | Plot |
Mito |
Lyso |
|
Perox |
ER |
Golgi |
PM |
Cytosol |
Nucleus |
|
| Expt A |
 7
7
peptides |
14
spectra |
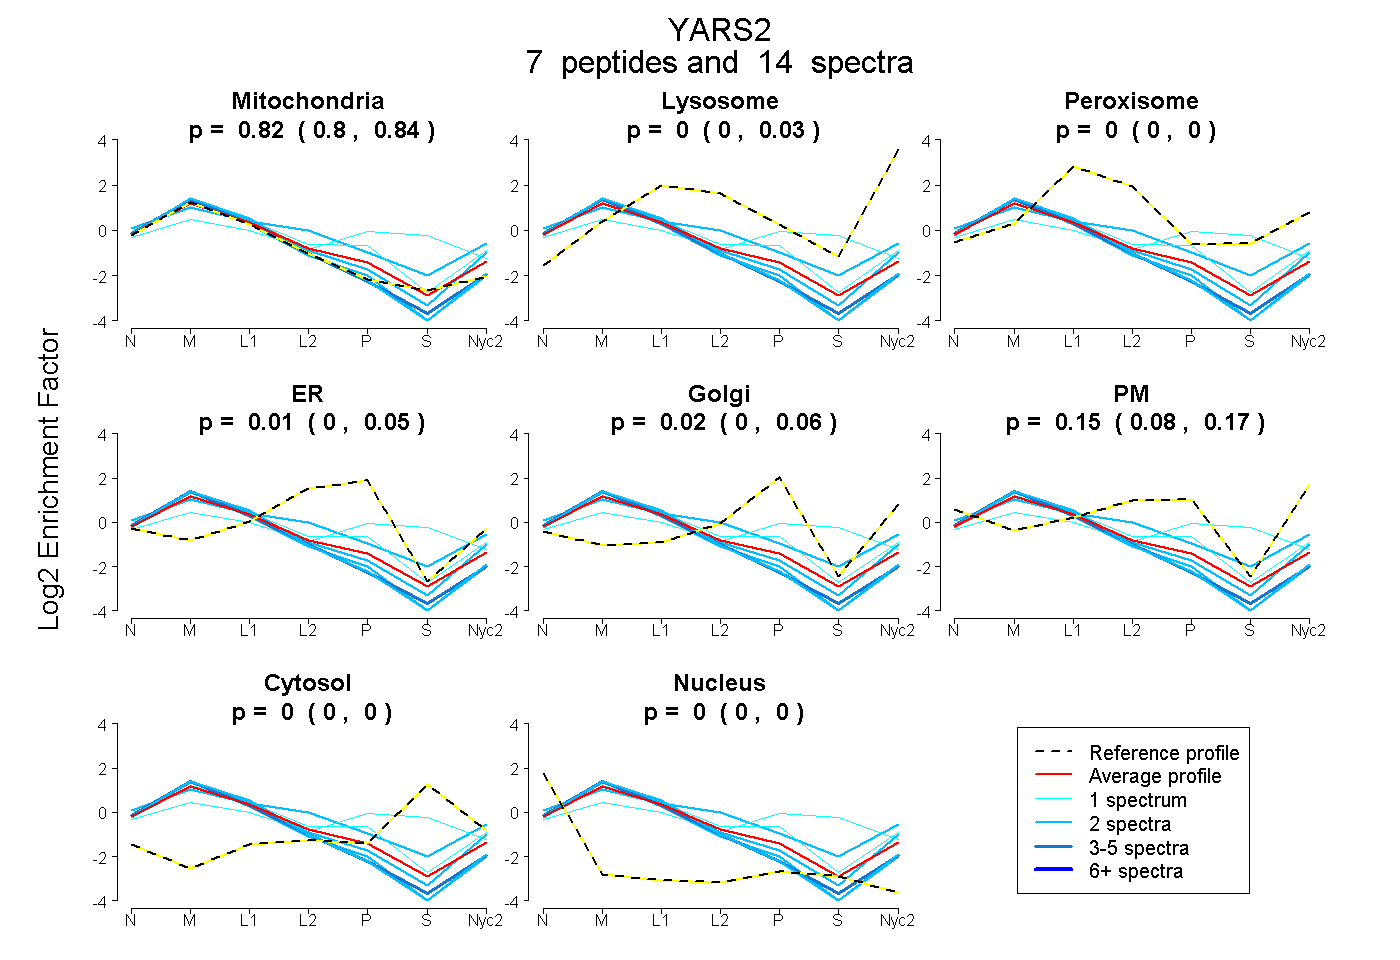 |
0.823
0.800 | 0.844 |
0.000
0.000 | 0.027 |
|
0.000
0.000 | 0.000 |
0.007
0.000 | 0.049 |
0.023
0.000 | 0.057 |
0.146
0.084 | 0.166 |
0.000
0.000 | 0.000 |
0.000
0.000 | 0.000 |
|
| | | Plot |
Mito |
|
Lyso or Perox |
|
ER |
Golgi |
PM |
Cytosol |
Nucleus |
|
| Expt B |
4
peptides |
8
spectra |
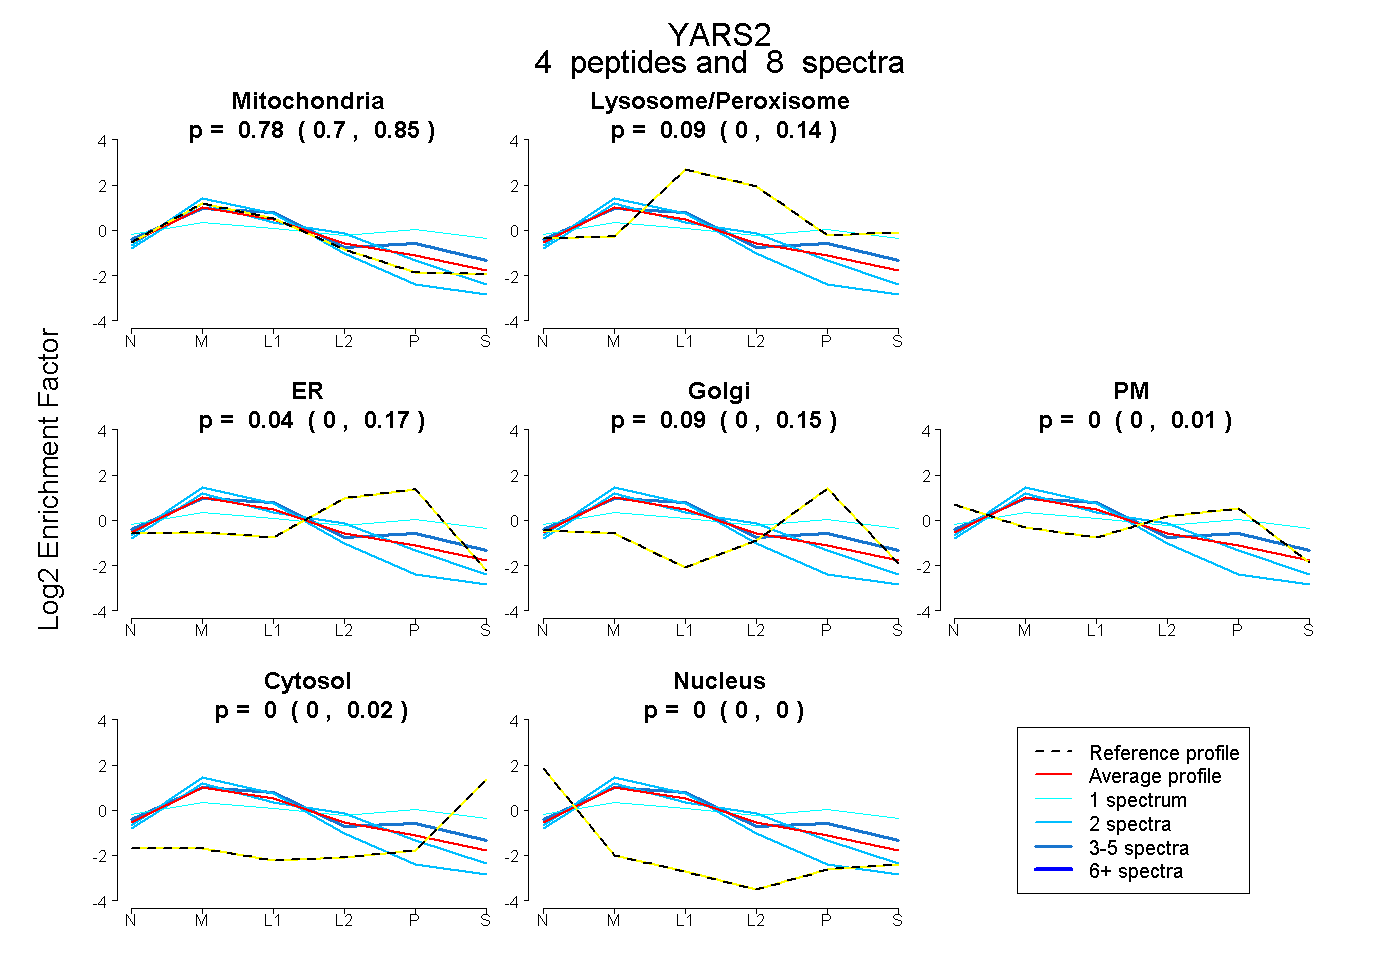 |
0.778
0.695 | 0.851 |
|
0.087
0.000 | 0.144 |
|
0.045
0.000 | 0.170 |
0.090
0.000 | 0.154 |
0.000
0.000 | 0.008 |
0.000
0.000 | 0.019 |
0.000
0.000 | 0.000 |
|
| 2 spectra, TELPELFDR |
1.000 |
|
0.000 |
|
0.000 |
0.000 |
0.000 |
0.000 |
0.000 |
|
| 2 spectra, MGTLLSR |
0.814 |
|
0.000 |
|
0.186 |
0.000 |
0.000 |
0.000 |
0.000 |
|
| 3 spectra, GLETLAANHAR |
0.638 |
|
0.192 |
|
0.000 |
0.170 |
0.000 |
0.000 |
0.000 |
|
| 1 spectrum, NFYIIK |
0.189 |
|
0.323 |
|
0.000 |
0.227 |
0.127 |
0.135 |
0.000 |
|
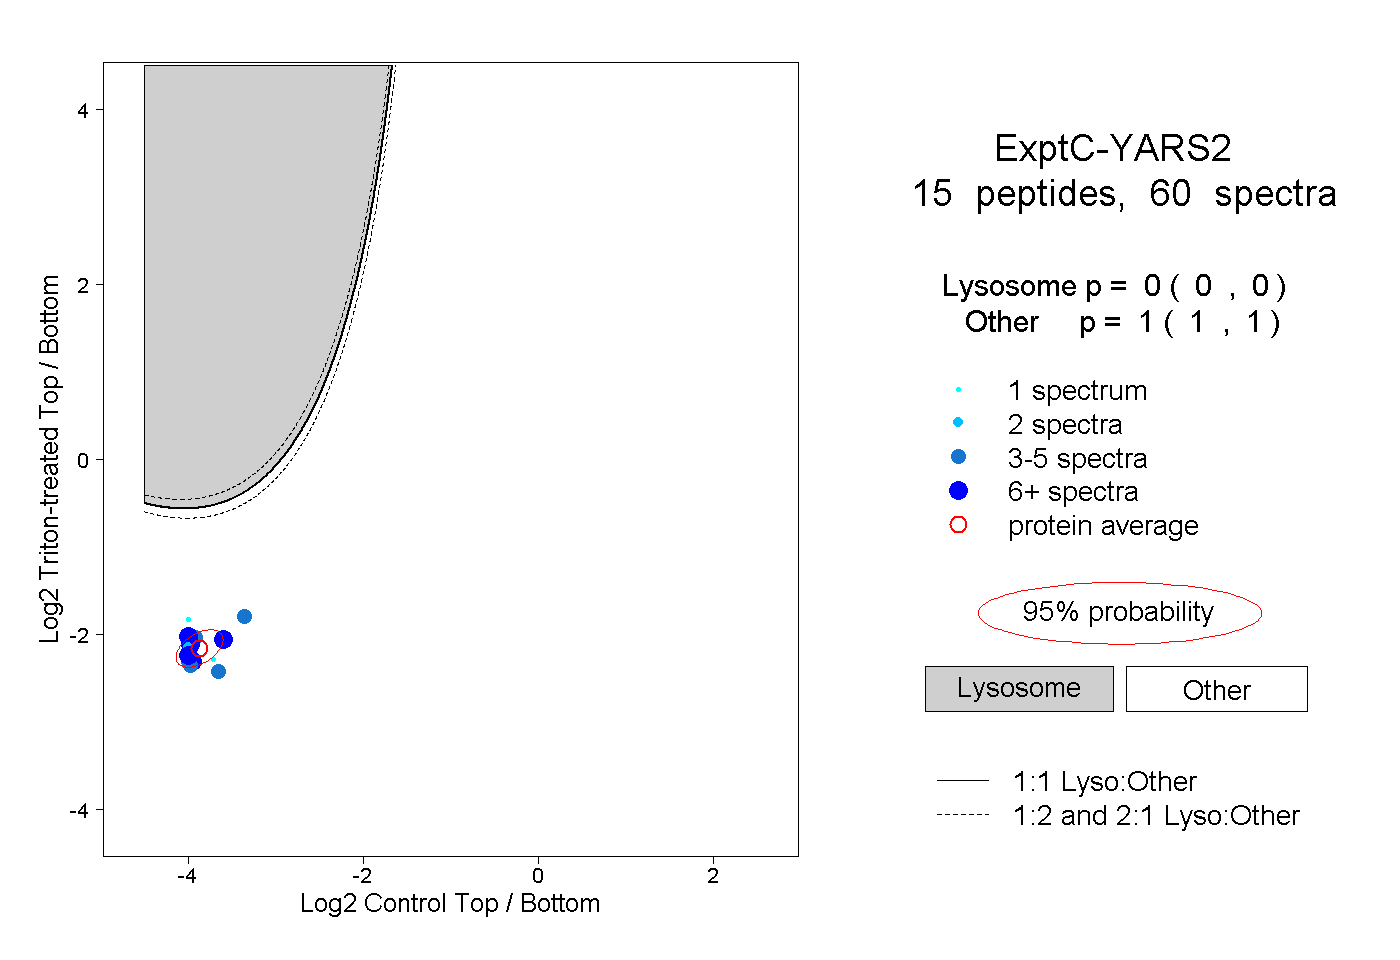
| | | Plot |
|
Lyso |
|
|
|
|
|
|
|
Other |
| Expt C |
15
peptides |
60
spectra |
 |
|
0.000
0.000 | 0.000 |
|
|
|
|
|
|
|
1.000
1.000 | 1.000 |
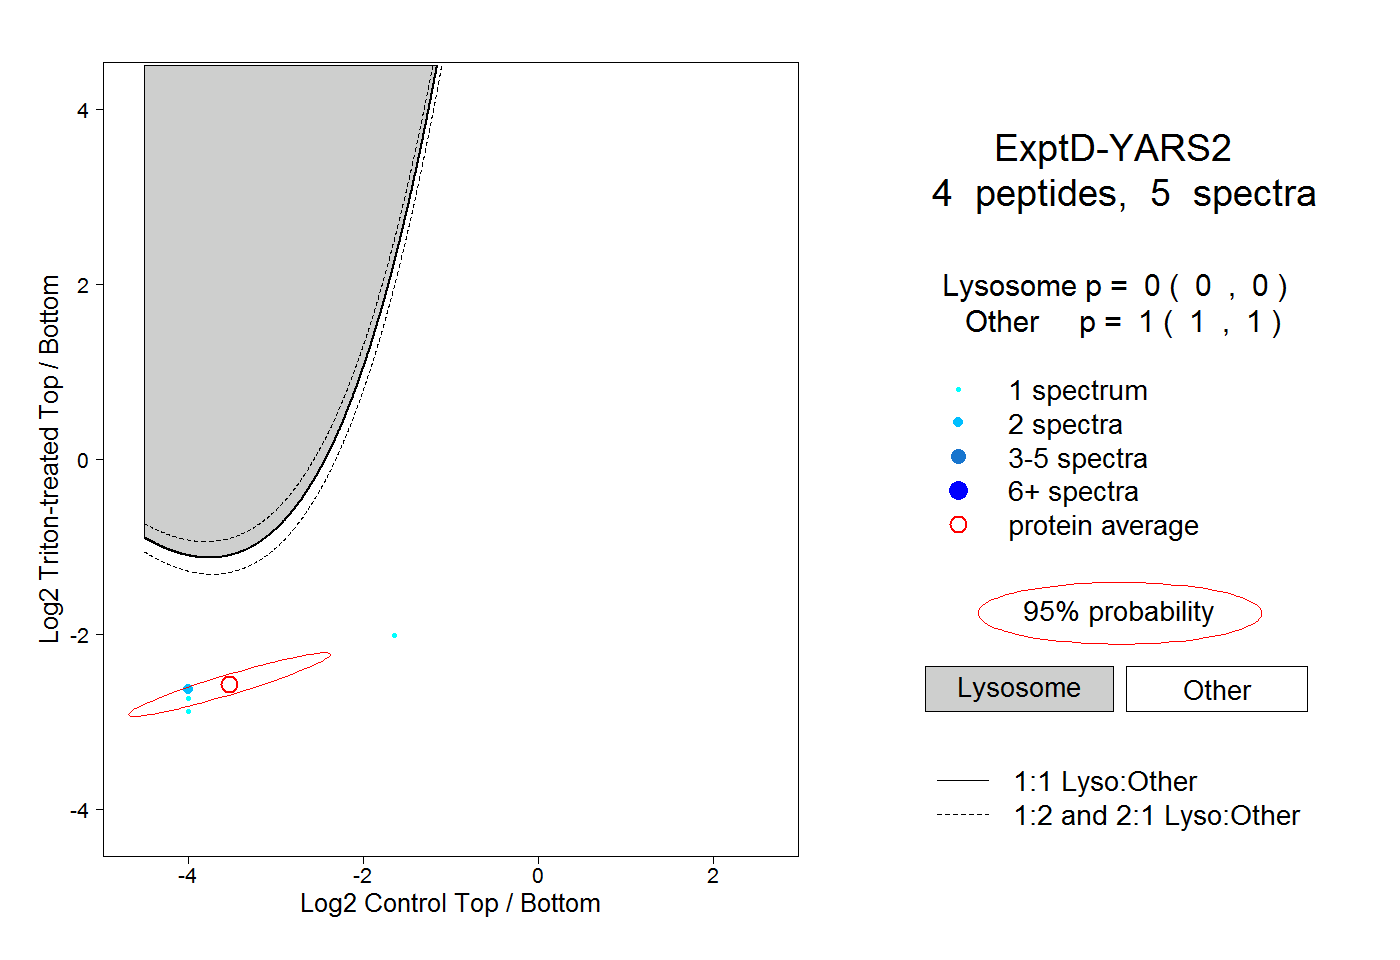
| | | Plot |
|
Lyso |
|
|
|
|
|
|
|
Other |
| Expt D |
4
peptides |
5
spectra |
 |
|
0.000
0.000 | 0.000 |
|
|
|
|
|
|
|
1.000
1.000 | 1.000 |