 22
22peptides
spectra
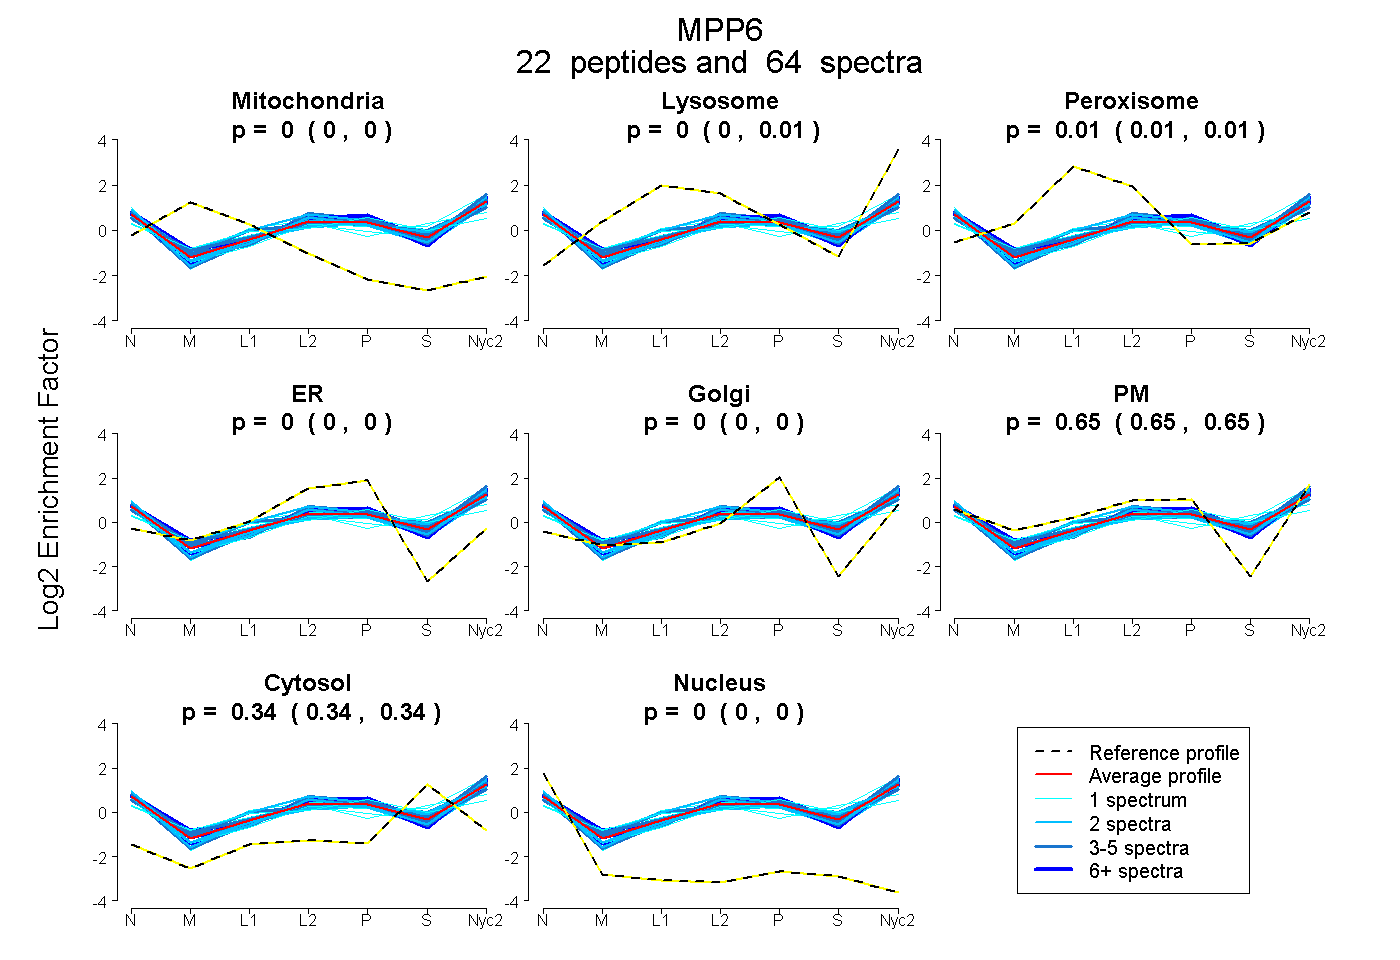
0.000 | 0.000
0.000 | 0.006
0.006 | 0.013
0.000 | 0.000
0.000 | 0.000
0.645 | 0.651
0.336 | 0.340
0.000 | 0.000
10peptides
spectra
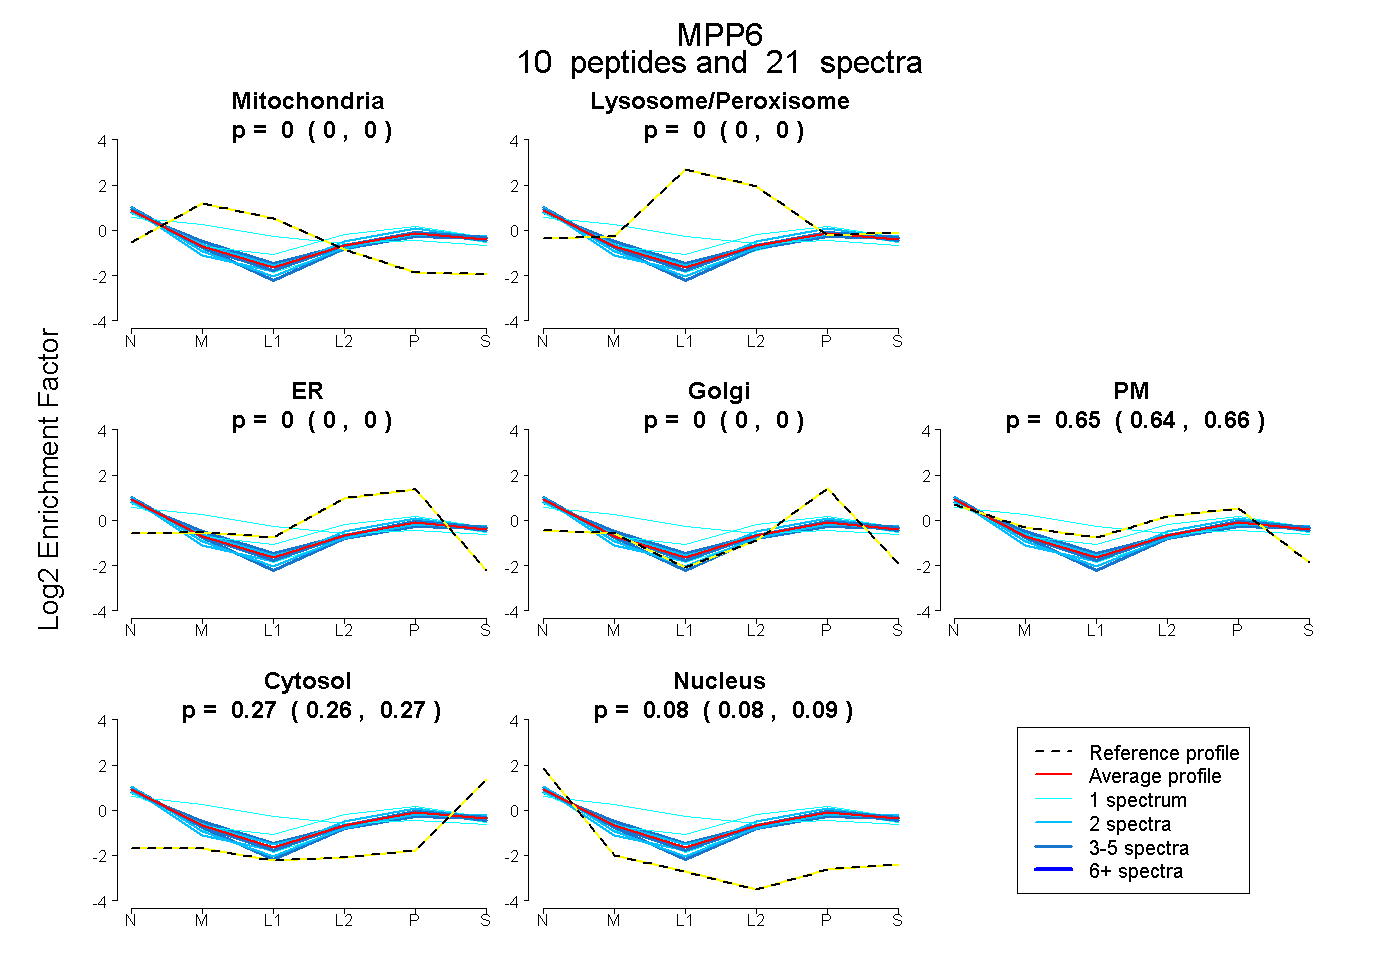
0.000 | 0.000
0.000 | 0.000
0.000 | 0.000
0.000 | 0.000
0.644 | 0.656
0.264 | 0.272
0.076 | 0.086
23peptides
spectra
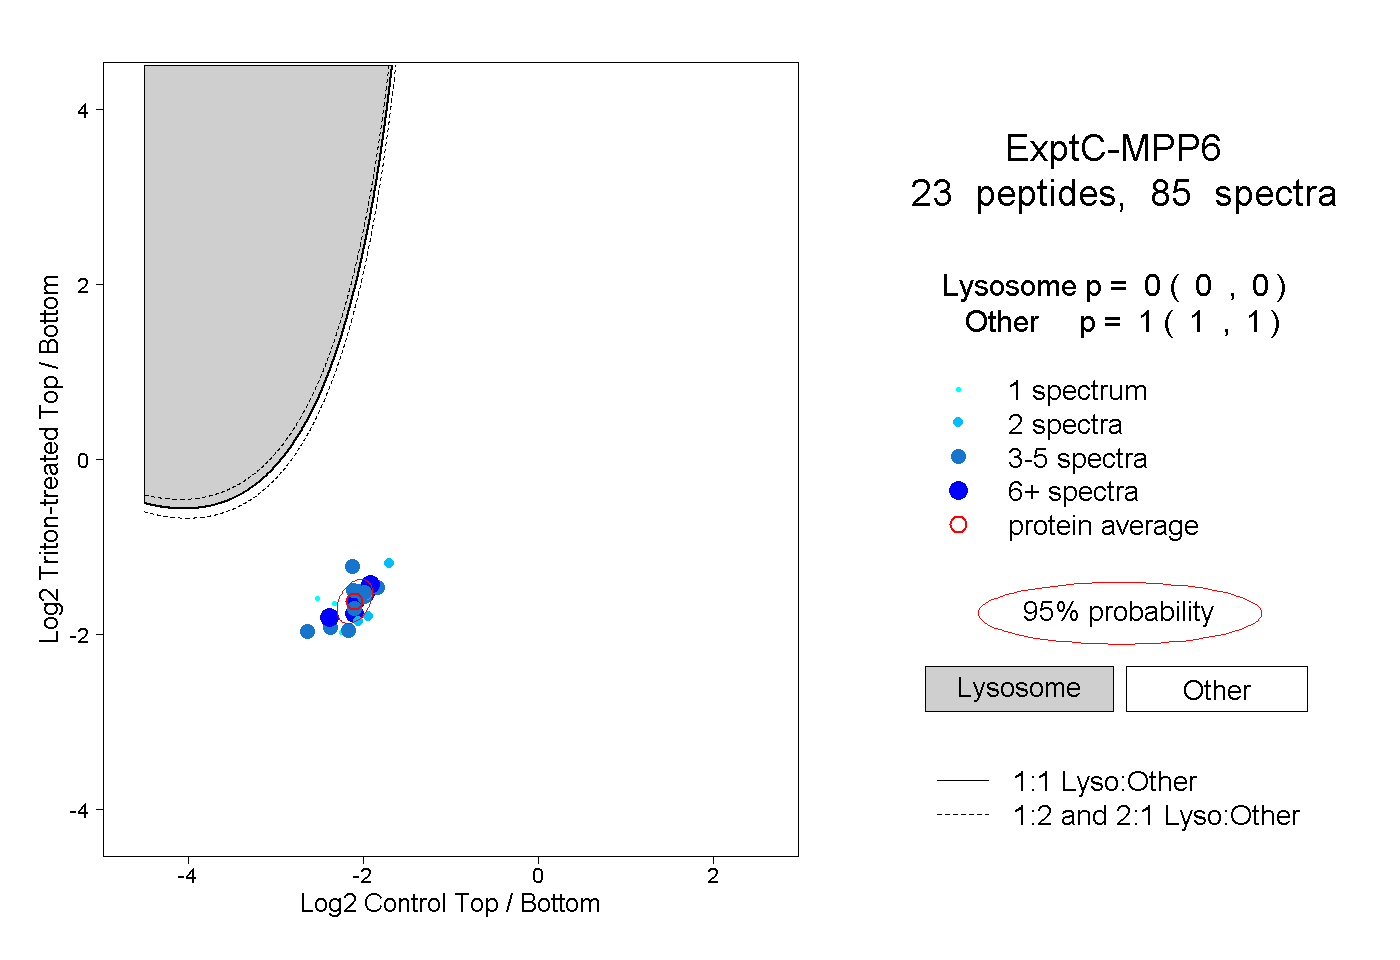
0.000 | 0.000
1.000 | 1.000
5peptides
spectra
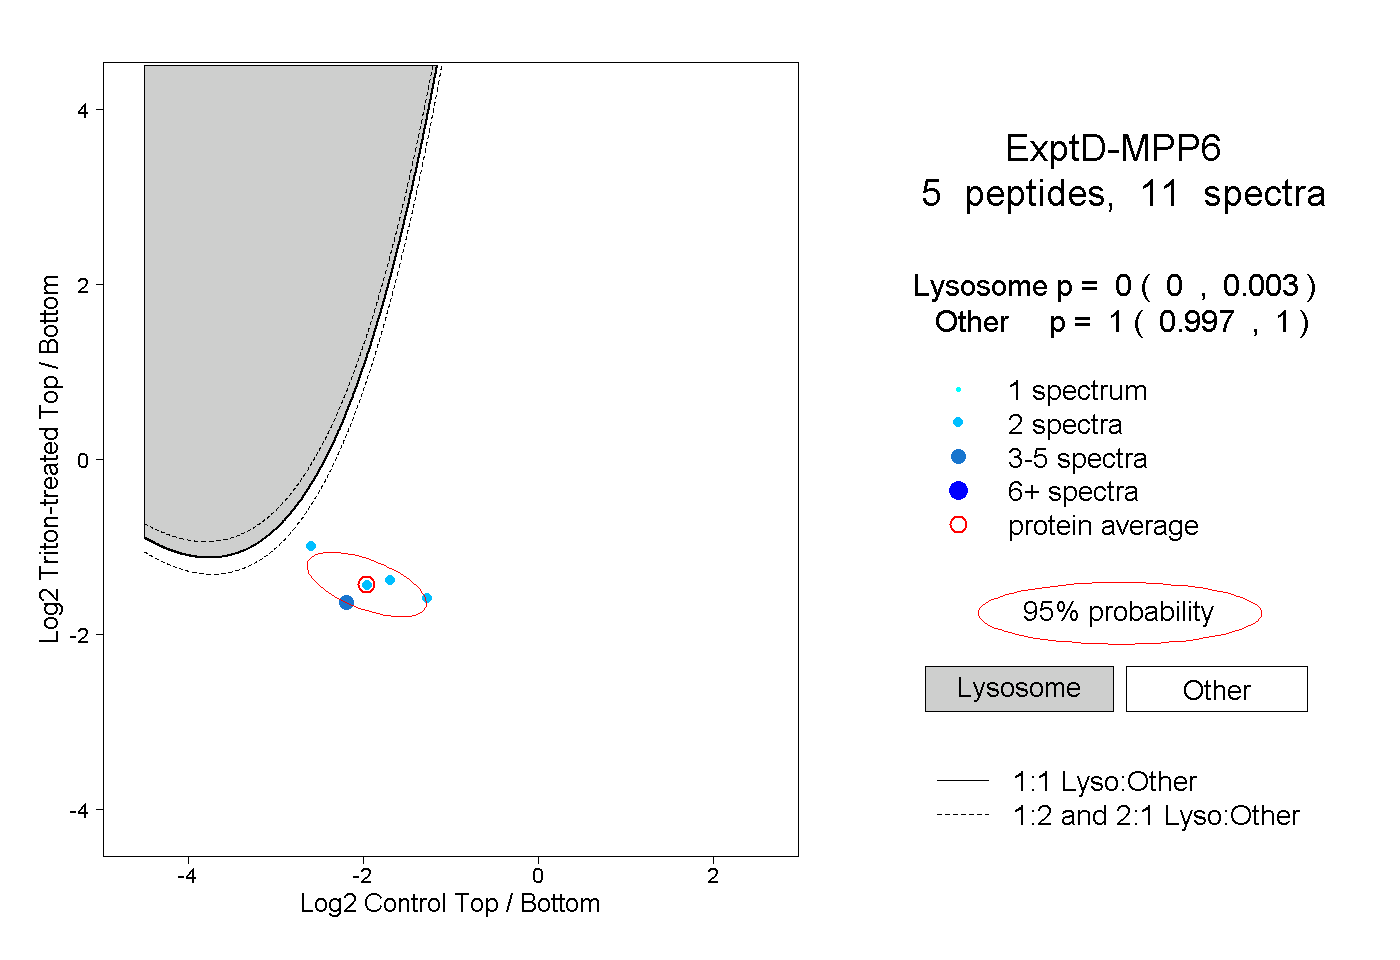
0.000 | 0.003
0.997 | 1.000