MPP6
[ENSRNOP00000037380]
Main page
| | | Plot |
Mito |
Lyso |
|
Perox |
ER |
Golgi |
PM |
Cytosol |
Nucleus |
|
| Expt A |
 22
22
peptides |
64
spectra |
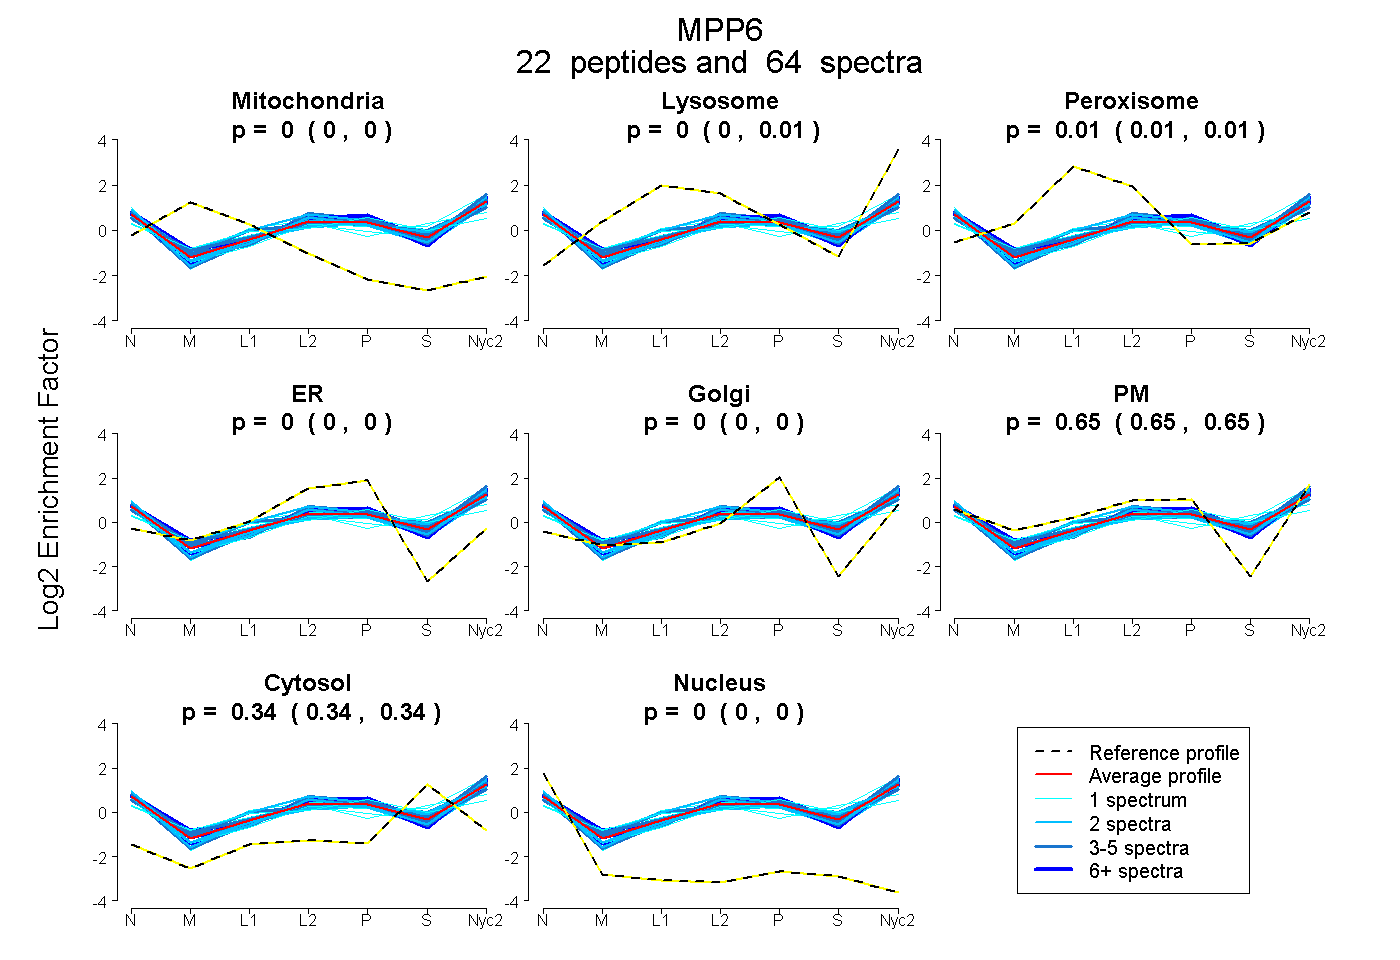 |
0.000
0.000 | 0.000 |
0.003
0.000 | 0.006 |
|
0.010
0.006 | 0.013 |
0.000
0.000 | 0.000 |
0.000
0.000 | 0.000 |
0.648
0.645 | 0.651 |
0.338
0.336 | 0.340 |
0.000
0.000 | 0.000 |
|
| | | Plot |
Mito |
|
Lyso or Perox |
|
ER |
Golgi |
PM |
Cytosol |
Nucleus |
|
| Expt B |
10
peptides |
21
spectra |
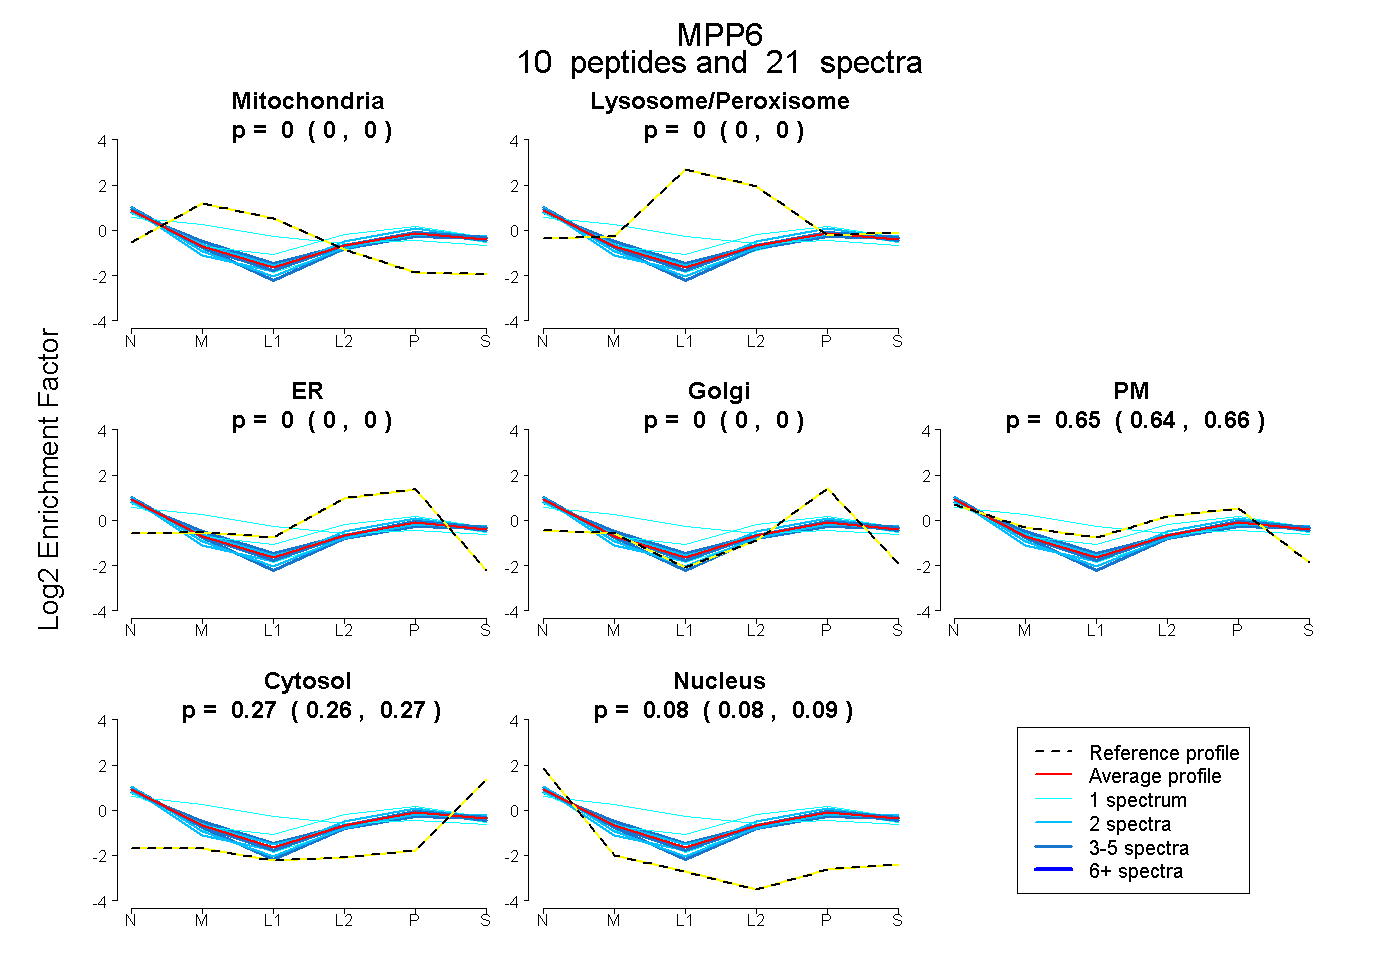 |
0.000
0.000 | 0.000 |
|
0.000
0.000 | 0.000 |
|
0.000
0.000 | 0.000 |
0.000
0.000 | 0.000 |
0.650
0.644 | 0.656 |
0.268
0.264 | 0.272 |
0.082
0.076 | 0.086 |
|
| 4 spectra, VENNDLVIAR |
0.000 |
|
0.000 |
|
0.000 |
0.000 |
0.640 |
0.281 |
0.079 |
|
| 2 spectra, GEILQIVNR |
0.000 |
|
0.000 |
|
0.000 |
0.000 |
0.640 |
0.295 |
0.065 |
|
| 3 spectra, FIVLNPAR |
0.000 |
|
0.000 |
|
0.000 |
0.000 |
0.684 |
0.258 |
0.058 |
|
| 1 spectrum, AVVDAGITTK |
0.000 |
|
0.000 |
|
0.000 |
0.000 |
0.658 |
0.223 |
0.119 |
|
| 1 spectrum, AGEPLGVTFR |
0.000 |
|
0.000 |
|
0.000 |
0.000 |
0.614 |
0.267 |
0.119 |
|
| 2 spectra, LLPSYR |
0.000 |
|
0.000 |
|
0.000 |
0.000 |
0.660 |
0.268 |
0.072 |
|
| 1 spectrum, TLVLIGAQGVGR |
0.220 |
|
0.130 |
|
0.000 |
0.000 |
0.457 |
0.144 |
0.049 |
|
| 4 spectra, FGTTVPFTSR |
0.000 |
|
0.000 |
|
0.000 |
0.000 |
0.575 |
0.277 |
0.148 |
|
| 1 spectrum, ILGIHK |
0.000 |
|
0.055 |
|
0.000 |
0.000 |
0.702 |
0.243 |
0.000 |
|
| 2 spectra, IGSILDVVQTGR |
0.000 |
|
0.000 |
|
0.000 |
0.000 |
0.584 |
0.280 |
0.136 |
|
| | | Plot |
|
Lyso |
|
|
|
|
|
|
|
Other |
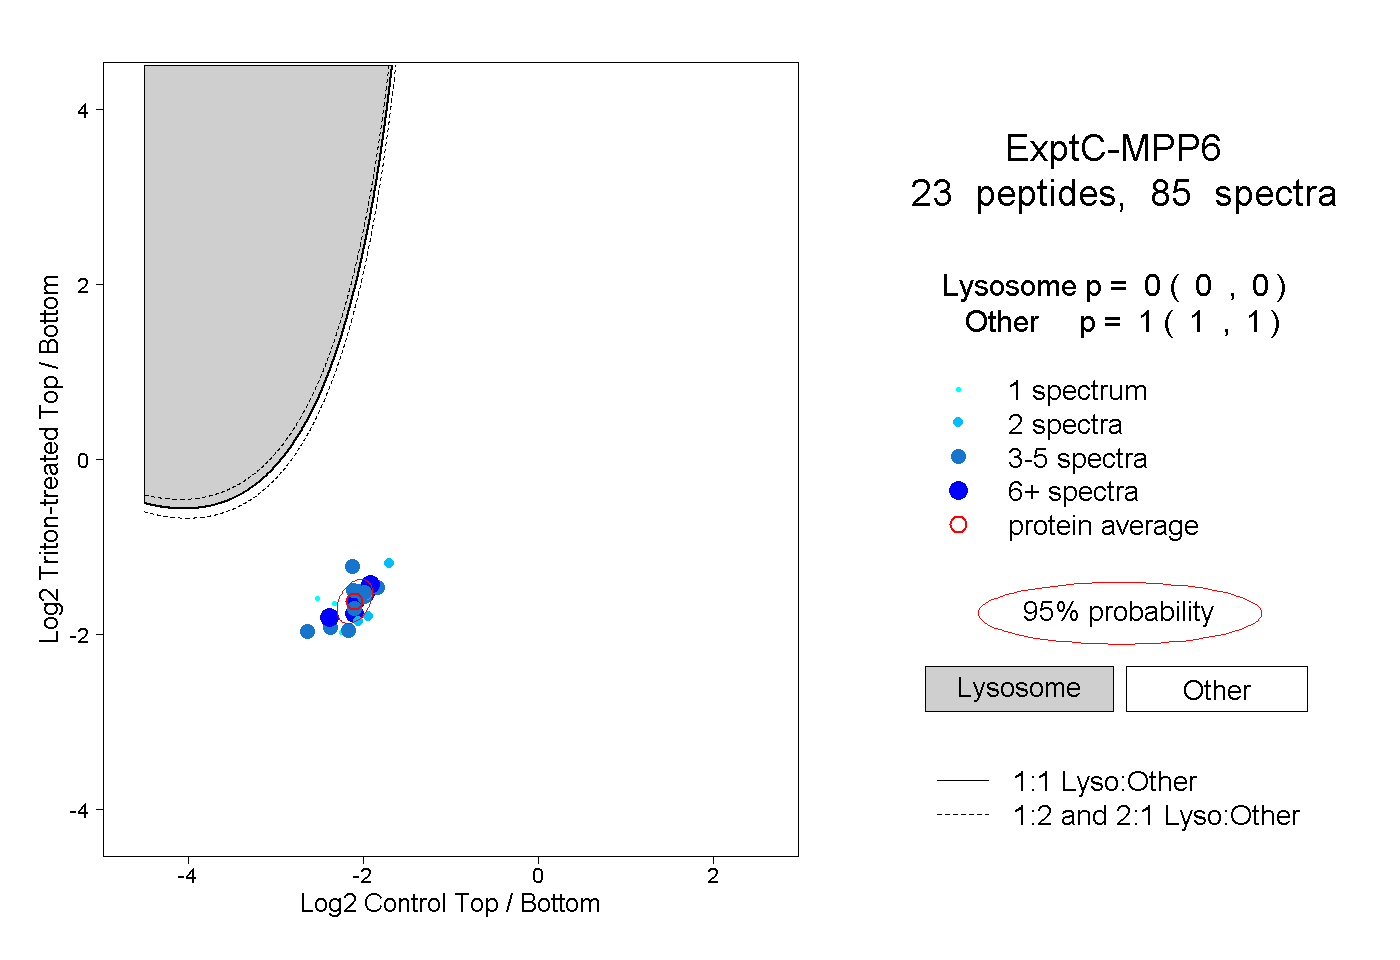
| Expt C |
23
peptides |
85
spectra |
 |
|
0.000
0.000 | 0.000 |
|
|
|
|
|
|
|
1.000
1.000 | 1.000 |
| | | Plot |
|
Lyso |
|
|
|
|
|
|
|
Other |
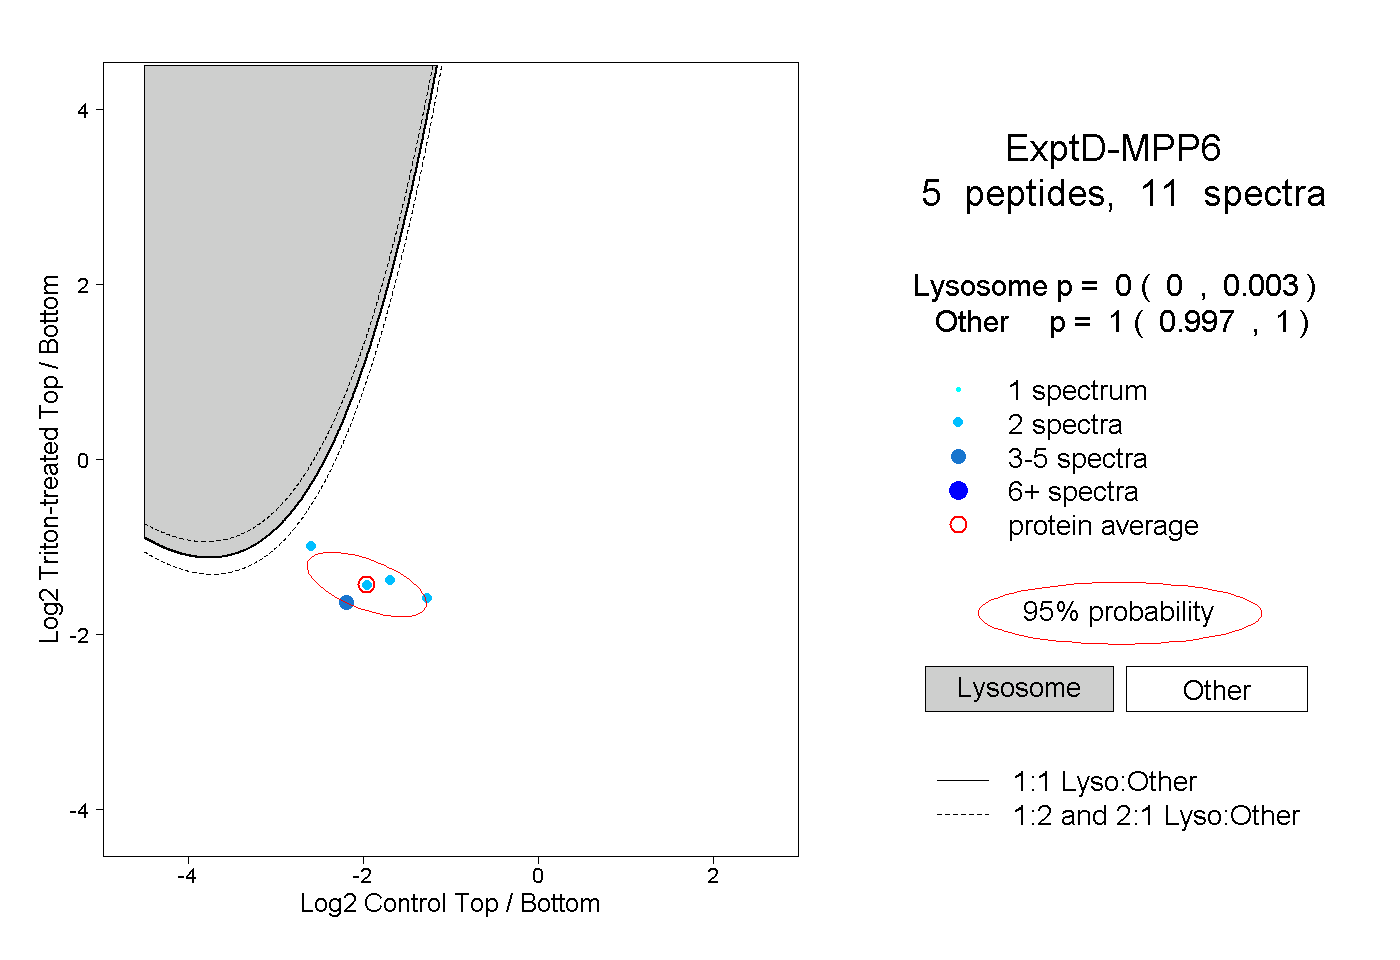
| Expt D |
5
peptides |
11
spectra |
 |
|
0.000
0.000 | 0.003 |
|
|
|
|
|
|
|
1.000
0.997 | 1.000 |