 22
22peptides
spectra
0.000 | 0.000
0.000 | 0.006
0.006 | 0.013
0.000 | 0.000
0.000 | 0.000
0.645 | 0.651
0.336 | 0.340
0.000 | 0.000
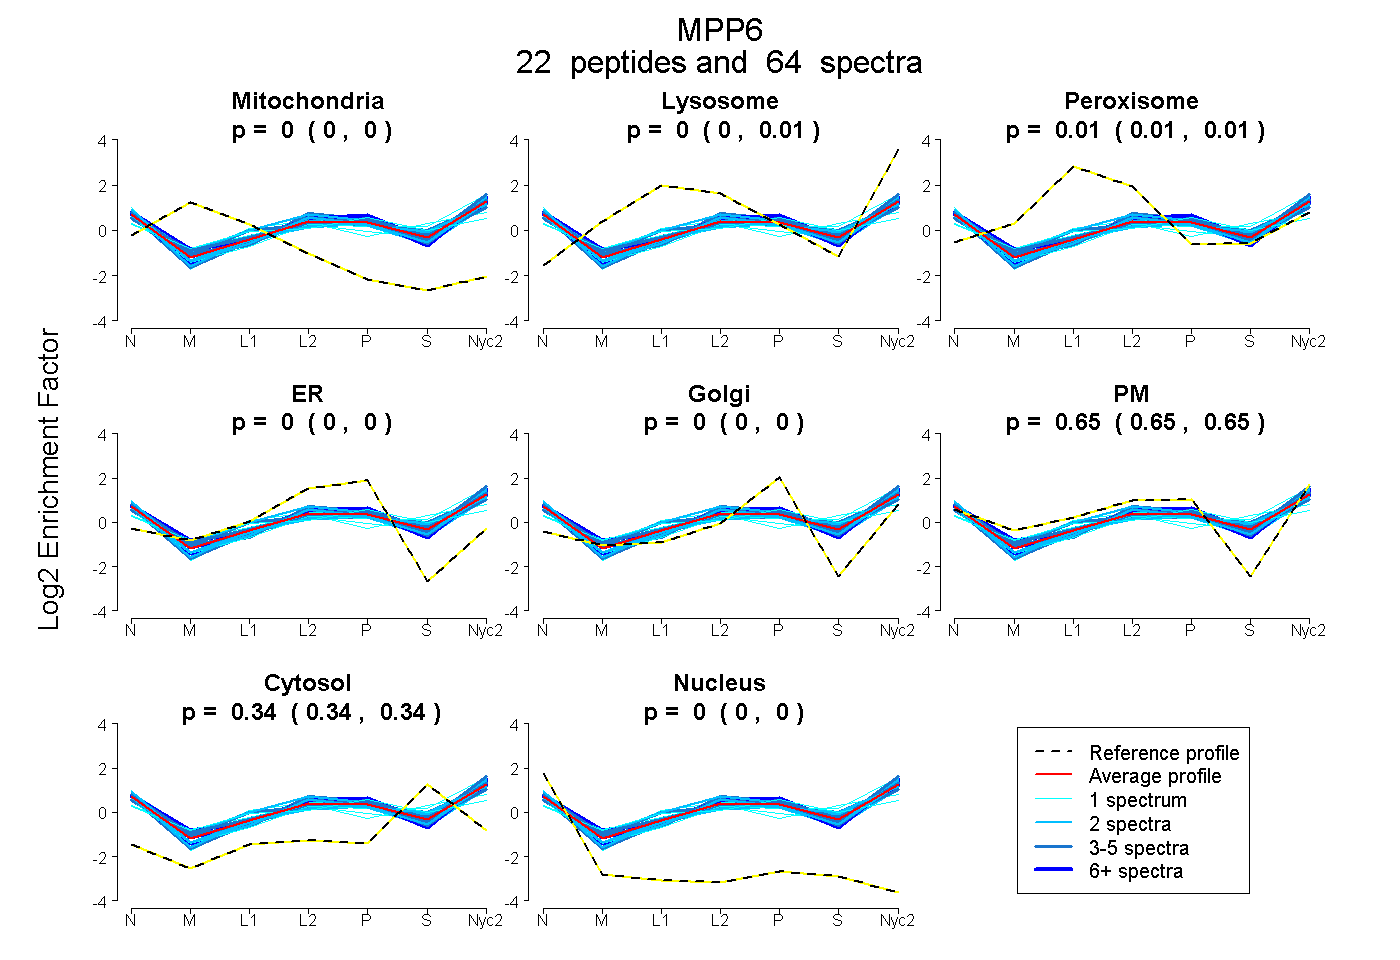
| Plot | Mito | Lyso | Perox | ER | Golgi | PM | Cytosol | Nucleus | |||||
| Expt A |
22 peptides |
64 spectra |
|
0.000 0.000 | 0.000 |
0.003 0.000 | 0.006 |
0.010 0.006 | 0.013 |
0.000 0.000 | 0.000 |
0.000 0.000 | 0.000 |
0.648 0.645 | 0.651 |
0.338 0.336 | 0.340 |
0.000 0.000 | 0.000 |
| 2 spectra, QGLLHVGDIIK | 0.000 | 0.000 | 0.000 | 0.000 | 0.000 | 0.641 | 0.359 | 0.000 | ||
| 1 spectrum, GIMENPIVK | 0.000 | 0.000 | 0.091 | 0.000 | 0.000 | 0.632 | 0.277 | 0.000 | ||
| 1 spectrum, EGGSAGLIPSQFLEEK | 0.000 | 0.000 | 0.000 | 0.000 | 0.000 | 0.628 | 0.372 | 0.000 | ||
| 2 spectra, VENNDLVIAR | 0.000 | 0.000 | 0.000 | 0.000 | 0.000 | 0.674 | 0.326 | 0.000 | ||
| 2 spectra, AVVDAGITTK | 0.000 | 0.000 | 0.000 | 0.000 | 0.000 | 0.653 | 0.347 | 0.000 | ||
| 4 spectra, MMYLTTR | 0.000 | 0.000 | 0.090 | 0.000 | 0.000 | 0.582 | 0.328 | 0.000 | ||
| 2 spectra, EVNGHEVGNNPK | 0.000 | 0.000 | 0.031 | 0.000 | 0.000 | 0.673 | 0.295 | 0.000 | ||
| 2 spectra, LLPSYR | 0.000 | 0.004 | 0.000 | 0.000 | 0.000 | 0.606 | 0.390 | 0.000 | ||
| 8 spectra, ILGIHK | 0.000 | 0.000 | 0.000 | 0.000 | 0.000 | 0.677 | 0.323 | 0.000 | ||
| 4 spectra, IGSILDVVQTGR | 0.000 | 0.000 | 0.000 | 0.000 | 0.000 | 0.715 | 0.285 | 0.000 | ||
| 1 spectrum, MPPFQR | 0.000 | 0.068 | 0.000 | 0.000 | 0.000 | 0.522 | 0.411 | 0.000 | ||
| 3 spectra, SEMEADIK | 0.000 | 0.048 | 0.011 | 0.000 | 0.000 | 0.611 | 0.329 | 0.000 | ||
| 3 spectra, EDPNWWQASHVK | 0.000 | 0.000 | 0.010 | 0.000 | 0.000 | 0.617 | 0.373 | 0.000 | ||
| 8 spectra, FIVLNPAR | 0.000 | 0.009 | 0.000 | 0.000 | 0.000 | 0.666 | 0.325 | 0.000 | ||
| 3 spectra, GEILQIVNR | 0.000 | 0.000 | 0.000 | 0.000 | 0.000 | 0.581 | 0.419 | 0.000 | ||
| 1 spectrum, ILHGGMIDR | 0.000 | 0.000 | 0.000 | 0.000 | 0.000 | 0.676 | 0.324 | 0.000 | ||
| 1 spectrum, HEIQIYEEVAK | 0.000 | 0.000 | 0.199 | 0.000 | 0.000 | 0.382 | 0.419 | 0.000 | ||
| 2 spectra, TVDESAR | 0.000 | 0.000 | 0.033 | 0.000 | 0.000 | 0.581 | 0.386 | 0.000 | ||
| 2 spectra, NISGSVTLK | 0.000 | 0.045 | 0.070 | 0.000 | 0.000 | 0.636 | 0.248 | 0.000 | ||
| 1 spectrum, YLEHGEYEGNLYGTK | 0.000 | 0.000 | 0.131 | 0.000 | 0.031 | 0.462 | 0.375 | 0.000 | ||
| 3 spectra, TLVLIGAQGVGR | 0.000 | 0.028 | 0.000 | 0.000 | 0.000 | 0.671 | 0.302 | 0.000 | ||
| 8 spectra, FGTTVPFTSR | 0.000 | 0.003 | 0.000 | 0.000 | 0.000 | 0.734 | 0.263 | 0.000 |
| Plot | Mito | Lyso or Perox | ER | Golgi | PM | Cytosol | Nucleus | ||||||
| Expt B |
10 peptides |
21 spectra |
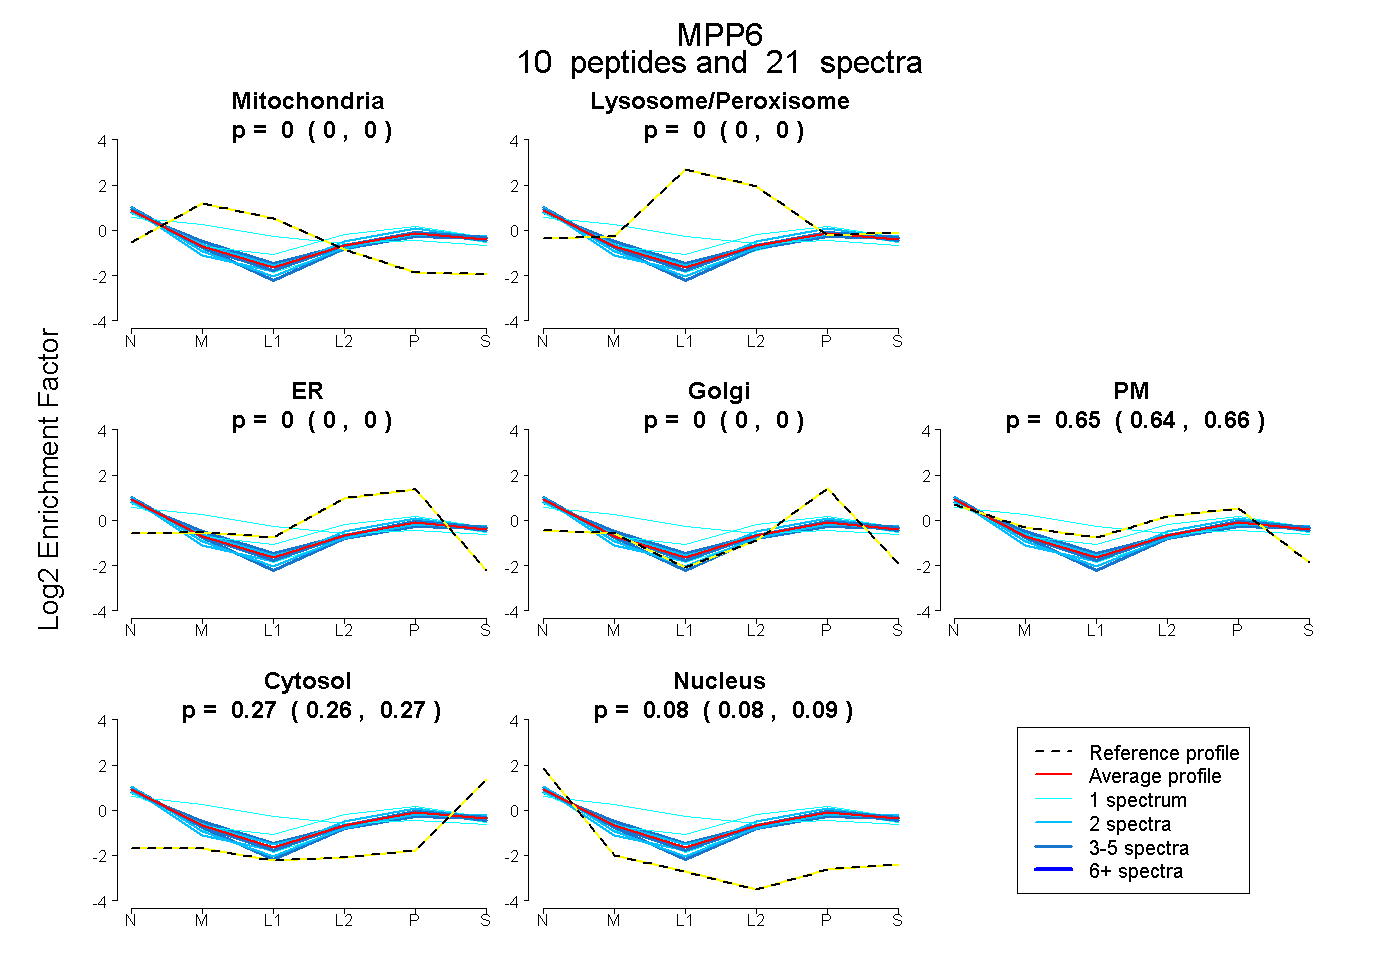 |
0.000 0.000 | 0.000 |
0.000 0.000 | 0.000 |
0.000 0.000 | 0.000 |
0.000 0.000 | 0.000 |
0.650 0.644 | 0.656 |
0.268 0.264 | 0.272 |
0.082 0.076 | 0.086 |
|||
| Plot | Lyso | Other | |||||||||||
| Expt C |
23 peptides |
85 spectra |
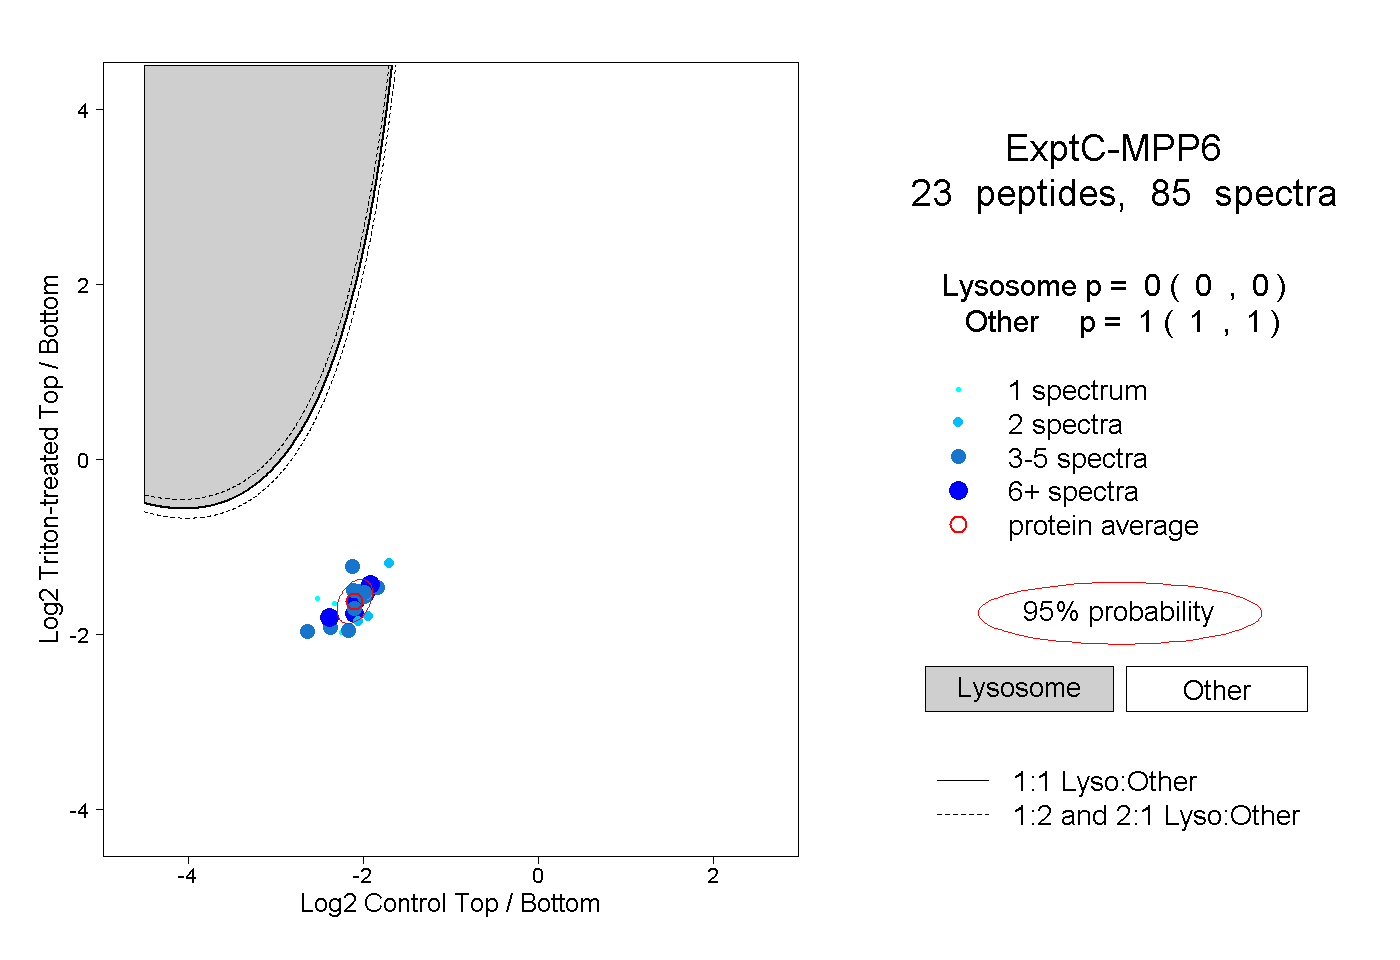 |
0.000 0.000 | 0.000 |
1.000 1.000 | 1.000 |
||||||||
| Plot | Lyso | Other | |||||||||||
| Expt D |
5 peptides |
11 spectra |
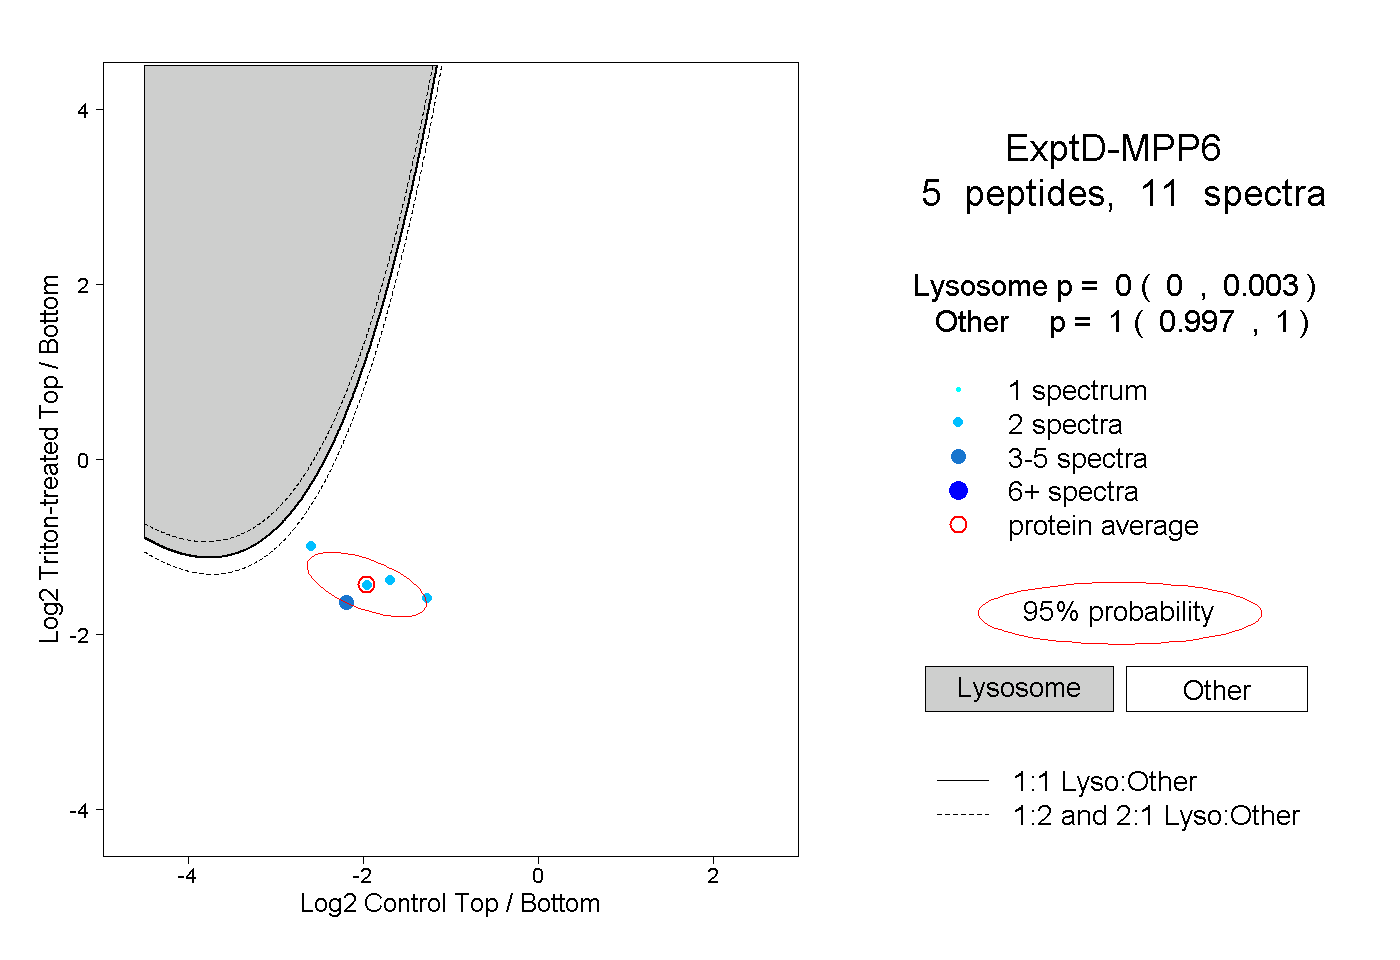 |
0.000 0.000 | 0.003 |
1.000 0.997 | 1.000 |