 4
4peptides
spectra
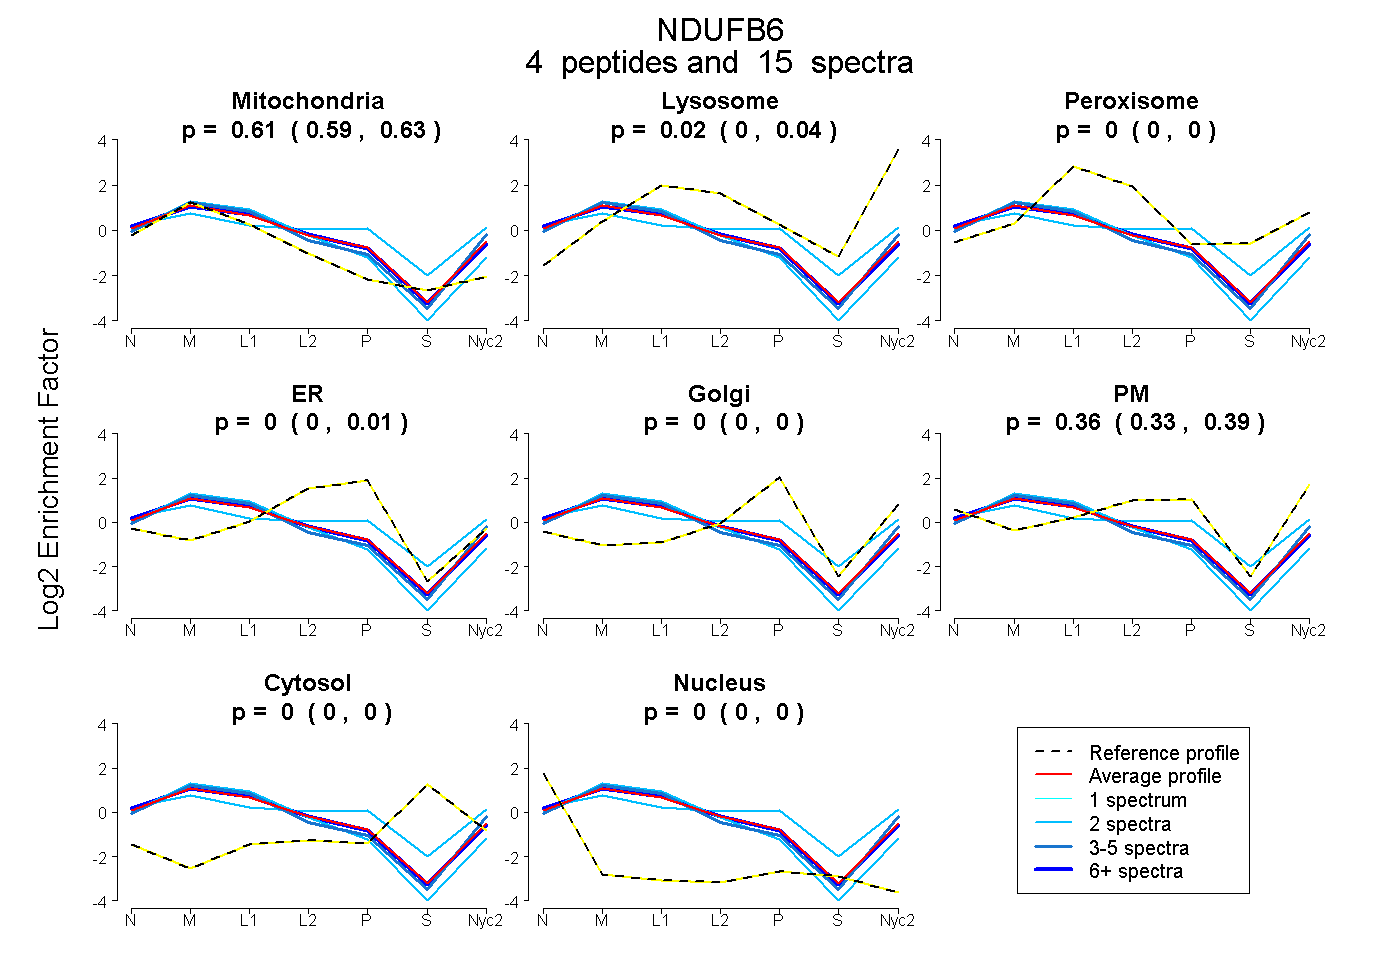
0.595 | 0.627
0.000 | 0.044
0.000 | 0.000
0.000 | 0.010
0.000 | 0.000
0.331 | 0.390
0.000 | 0.000
0.000 | 0.000
3peptides
spectra
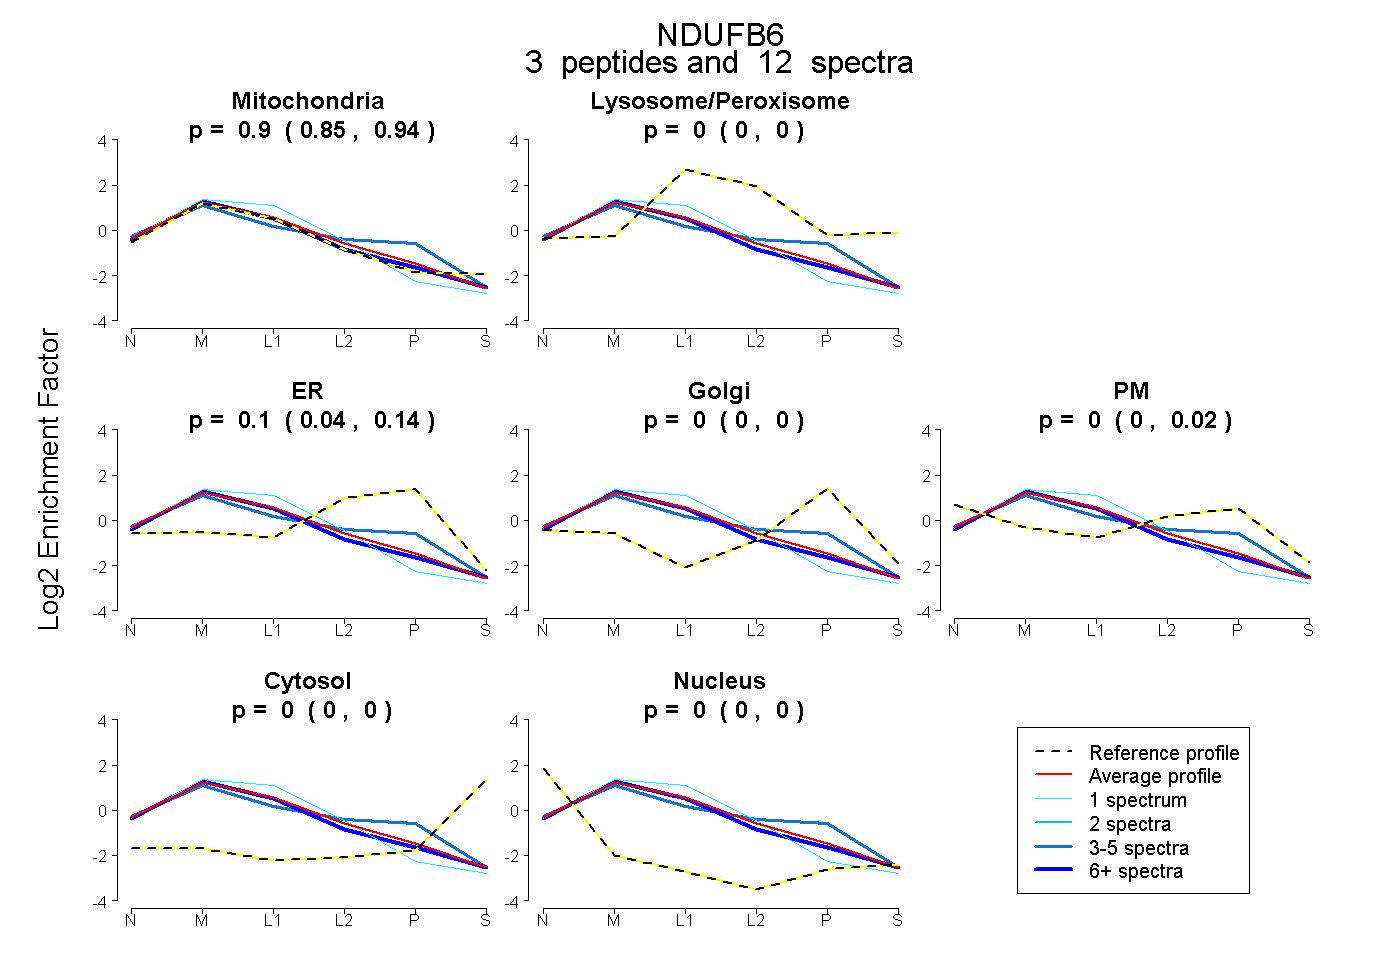
0.849 | 0.942
0.000 | 0.000
0.045 | 0.140
0.000 | 0.000
0.000 | 0.018
0.000 | 0.000
0.000 | 0.000
5peptides
spectra
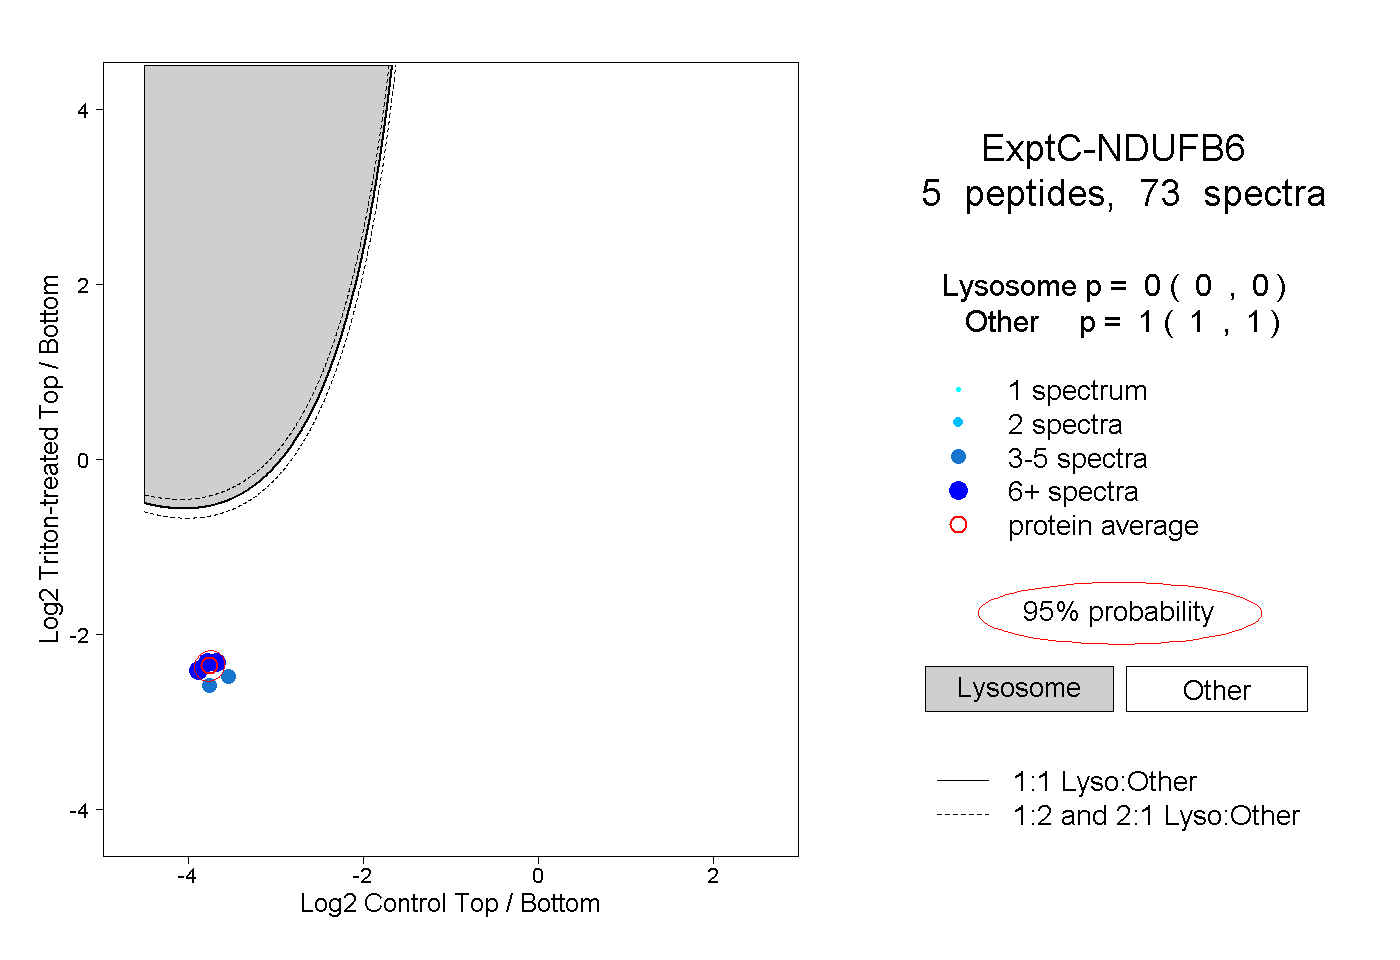
0.000 | 0.000
1.000 | 1.000
4peptides
spectra
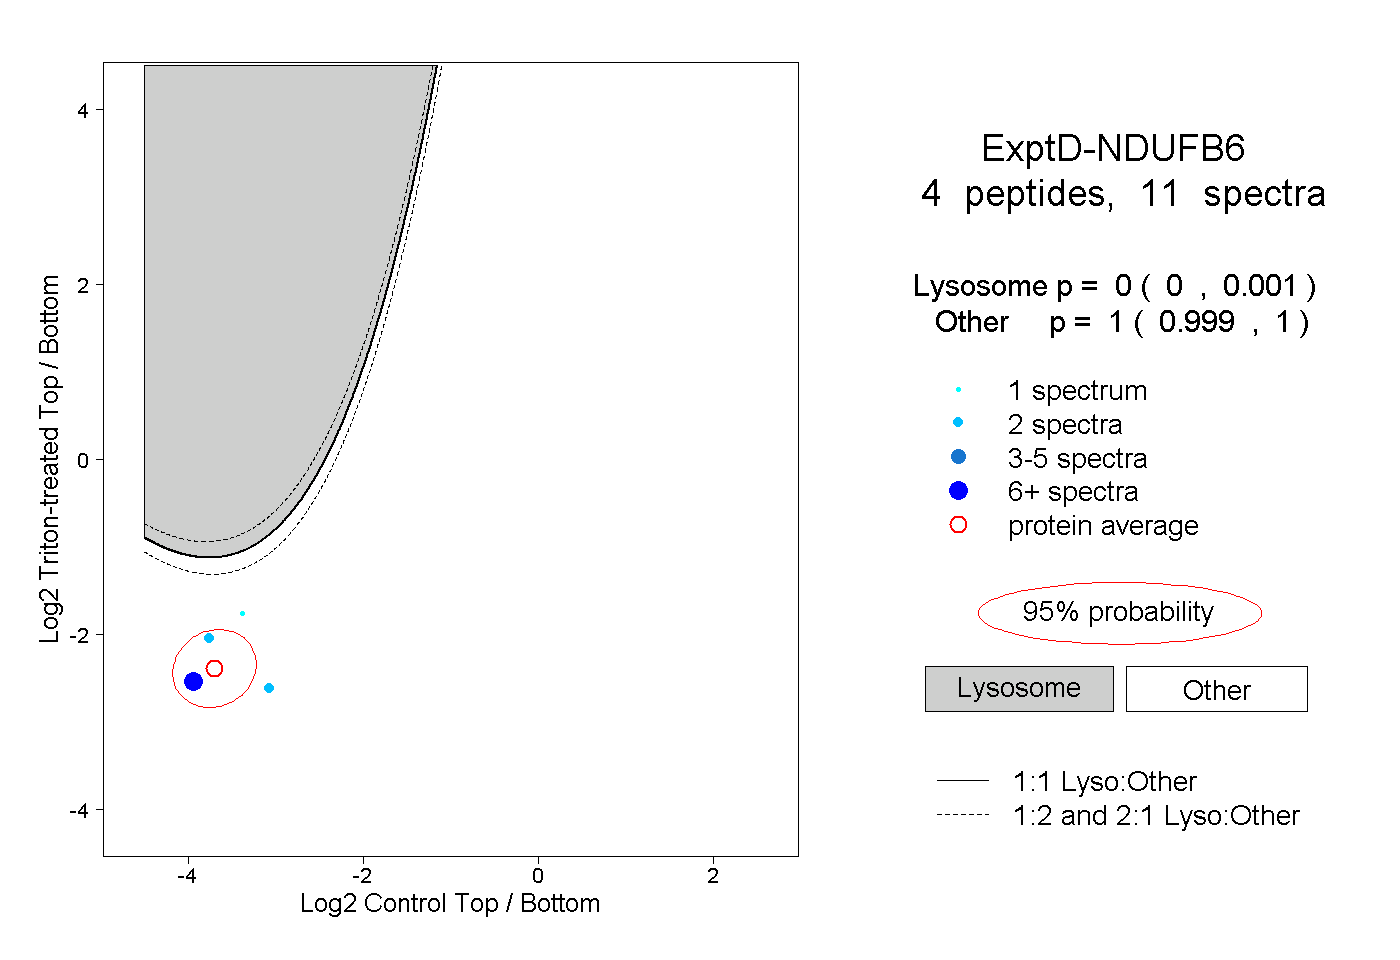
0.000 | 0.001
0.999 | 1.000