NDUFB6
[ENSRNOP00000037051]
Main page
| | | Plot |
Mito |
Lyso |
|
Perox |
ER |
Golgi |
PM |
Cytosol |
Nucleus |
|
| Expt A |
 4
4
peptides |
15
spectra |
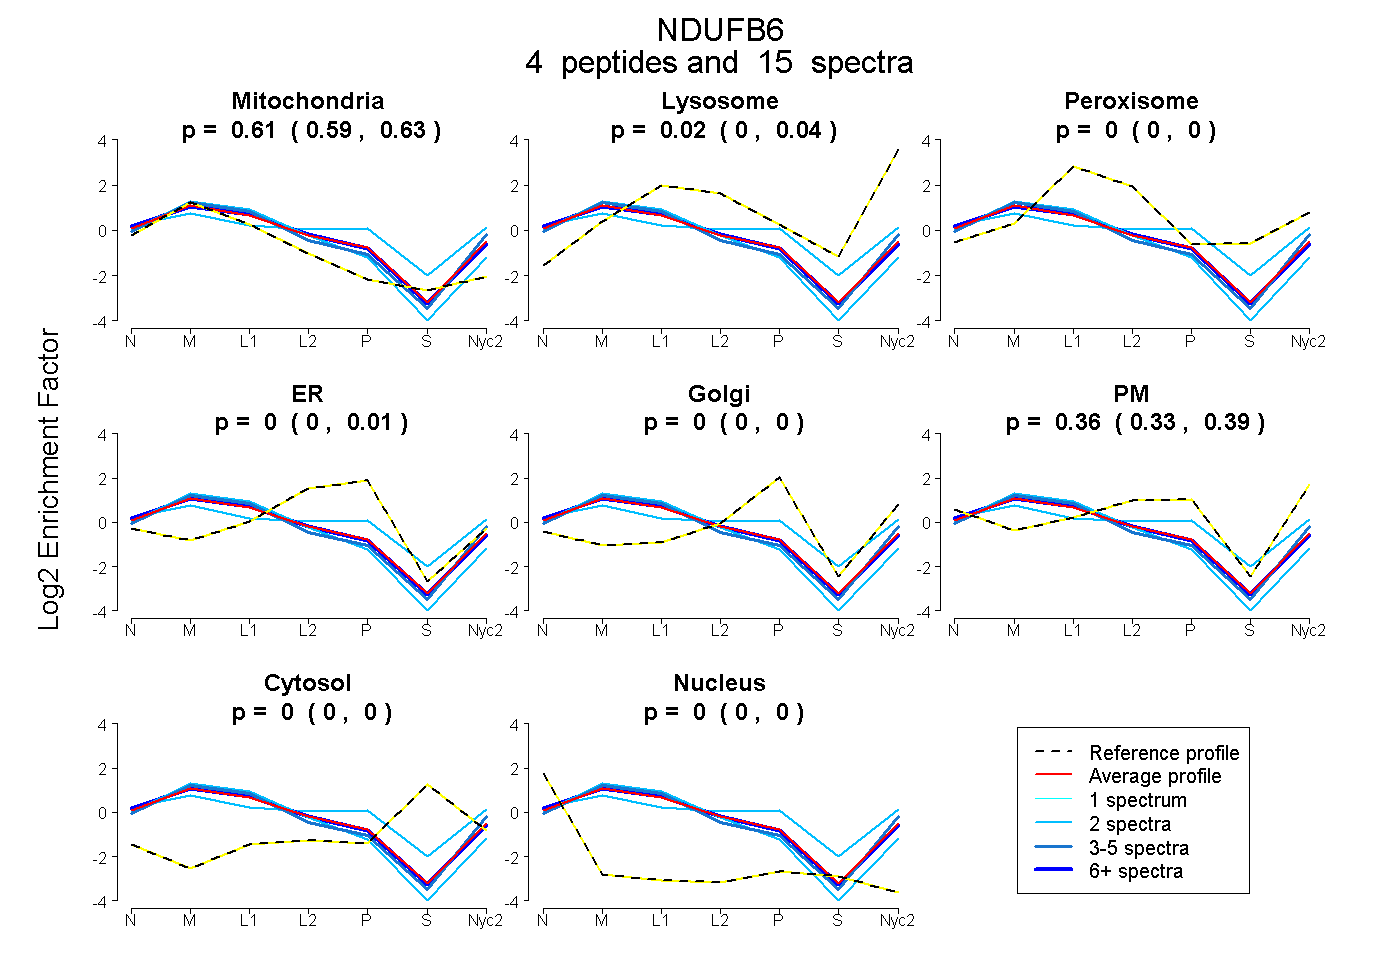 |
0.613
0.595 | 0.627 |
0.023
0.000 | 0.044 |
|
0.000
0.000 | 0.000 |
0.000
0.000 | 0.010 |
0.000
0.000 | 0.000 |
0.364
0.331 | 0.390 |
0.000
0.000 | 0.000 |
0.000
0.000 | 0.000 |
|
| | | Plot |
Mito |
|
Lyso or Perox |
|
ER |
Golgi |
PM |
Cytosol |
Nucleus |
|
| Expt B |
3
peptides |
12
spectra |
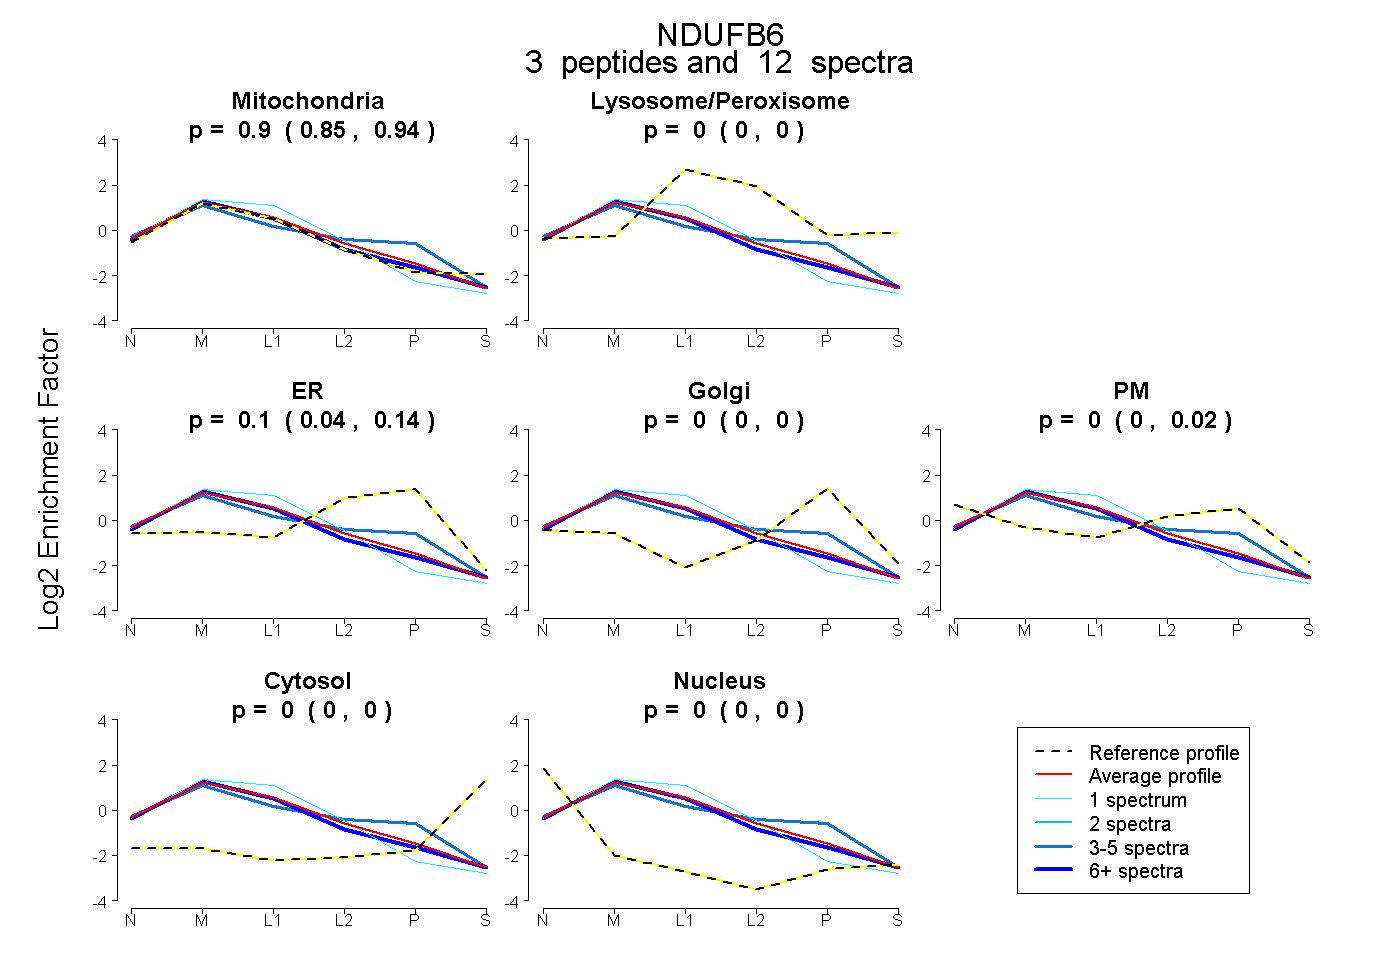 |
0.900
0.849 | 0.942 |
|
0.000
0.000 | 0.000 |
|
0.100
0.045 | 0.140 |
0.000
0.000 | 0.000 |
0.000
0.000 | 0.018 |
0.000
0.000 | 0.000 |
0.000
0.000 | 0.000 |
|
| 3 spectra, DQELSPR |
0.666 |
|
0.000 |
|
0.243 |
0.002 |
0.089 |
0.000 |
0.000 |
|
| 1 spectrum, FWNNFLR |
1.000 |
|
0.000 |
|
0.000 |
0.000 |
0.000 |
0.000 |
0.000 |
|
| 8 spectra, EPVLPPR |
0.954 |
|
0.000 |
|
0.041 |
0.000 |
0.002 |
0.000 |
0.003 |
|
| | | Plot |
|
Lyso |
|
|
|
|
|
|
|
Other |
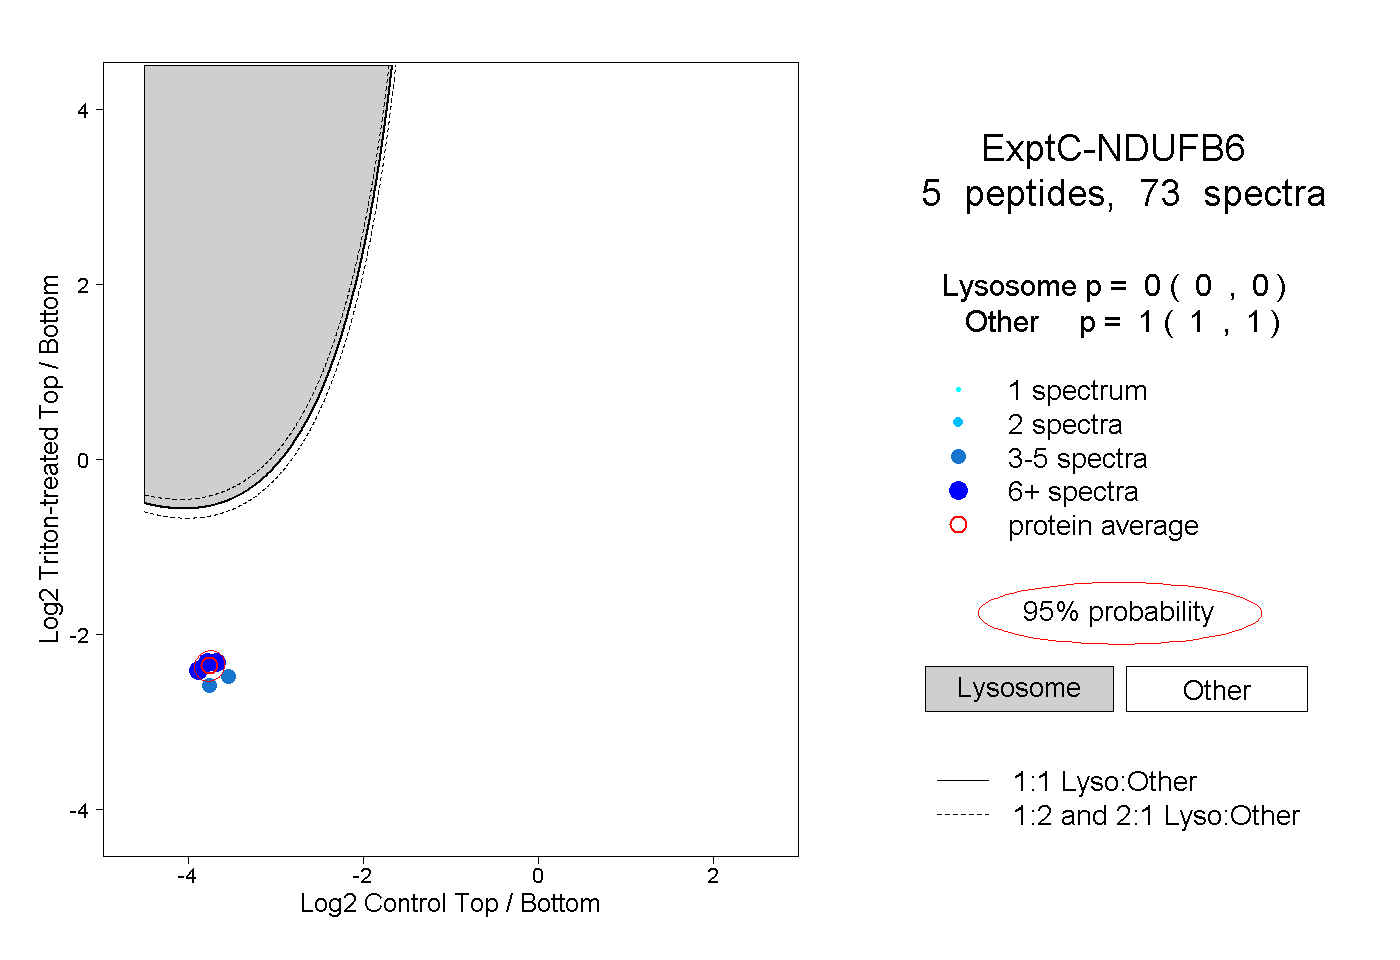
| Expt C |
5
peptides |
73
spectra |
 |
|
0.000
0.000 | 0.000 |
|
|
|
|
|
|
|
1.000
1.000 | 1.000 |
| | | Plot |
|
Lyso |
|
|
|
|
|
|
|
Other |
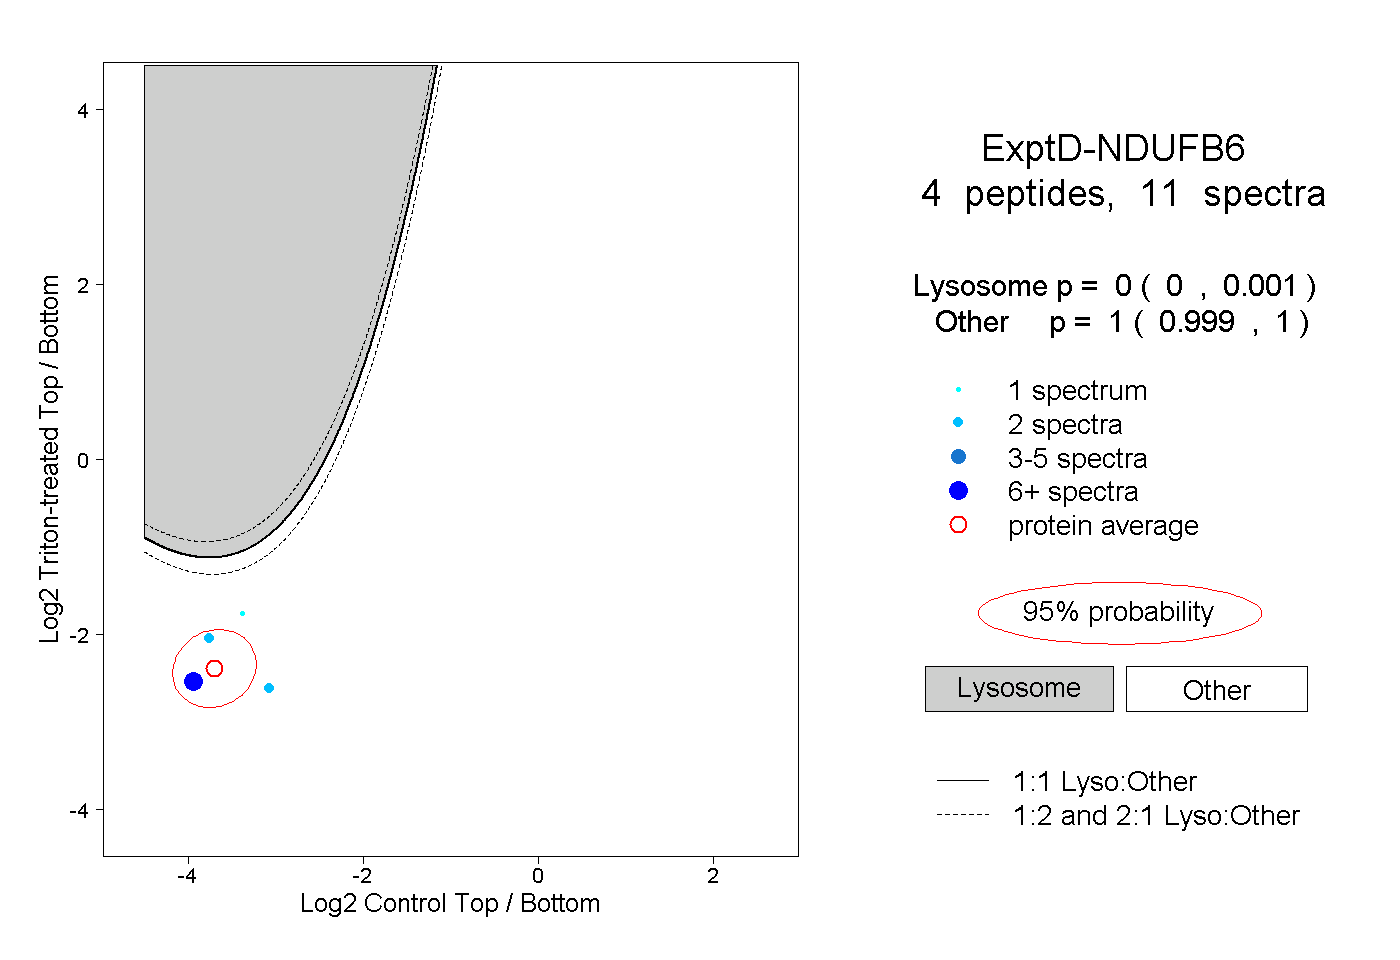
| Expt D |
4
peptides |
11
spectra |
 |
|
0.000
0.000 | 0.001 |
|
|
|
|
|
|
|
1.000
0.999 | 1.000 |