 4
4peptides
spectra
0.595 | 0.627
0.000 | 0.044
0.000 | 0.000
0.000 | 0.010
0.000 | 0.000
0.331 | 0.390
0.000 | 0.000
0.000 | 0.000
| Plot | Mito | Lyso | Perox | ER | Golgi | PM | Cytosol | Nucleus | |||||
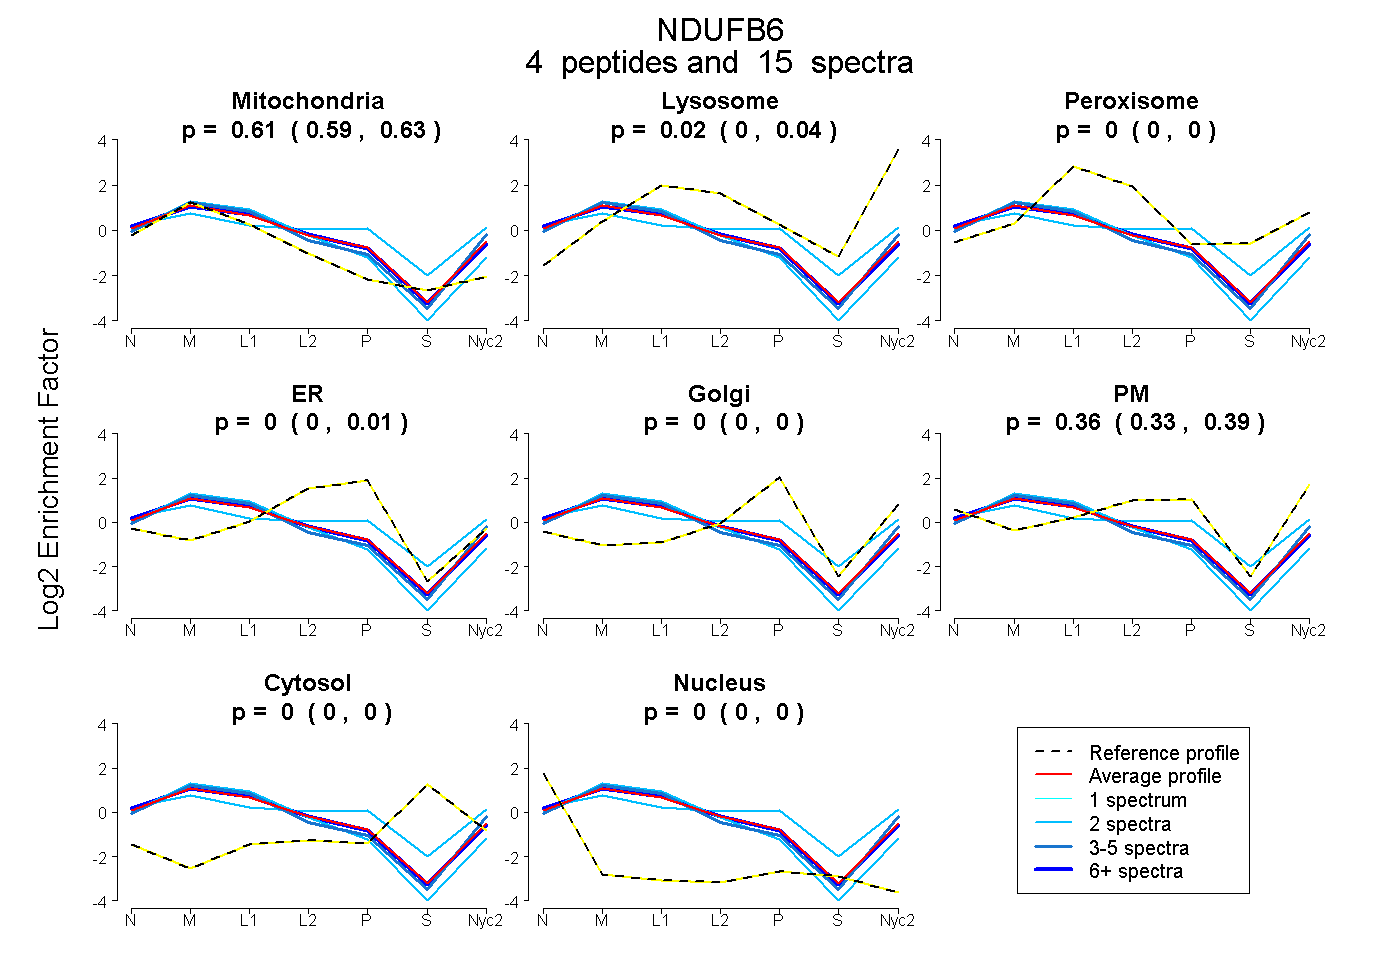
| Expt A |
4 peptides |
15 spectra |
|
0.613 0.595 | 0.627 |
0.023 0.000 | 0.044 |
0.000 0.000 | 0.000 |
0.000 0.000 | 0.010 |
0.000 0.000 | 0.000 |
0.364 0.331 | 0.390 |
0.000 0.000 | 0.000 |
0.000 0.000 | 0.000 |
| 3 spectra, MWPLER | 0.641 | 0.093 | 0.000 | 0.000 | 0.000 | 0.266 | 0.000 | 0.000 | ||
| 2 spectra, IFPGDTILETGEVIPPMR | 0.748 | 0.000 | 0.000 | 0.074 | 0.000 | 0.179 | 0.000 | 0.000 | ||
| 2 spectra, DQELSPR | 0.386 | 0.028 | 0.058 | 0.000 | 0.115 | 0.414 | 0.000 | 0.000 | ||
| 8 spectra, EPVLPPR | 0.624 | 0.003 | 0.000 | 0.000 | 0.000 | 0.373 | 0.000 | 0.000 |
| Plot | Mito | Lyso or Perox | ER | Golgi | PM | Cytosol | Nucleus | ||||||
| Expt B |
3 peptides |
12 spectra |
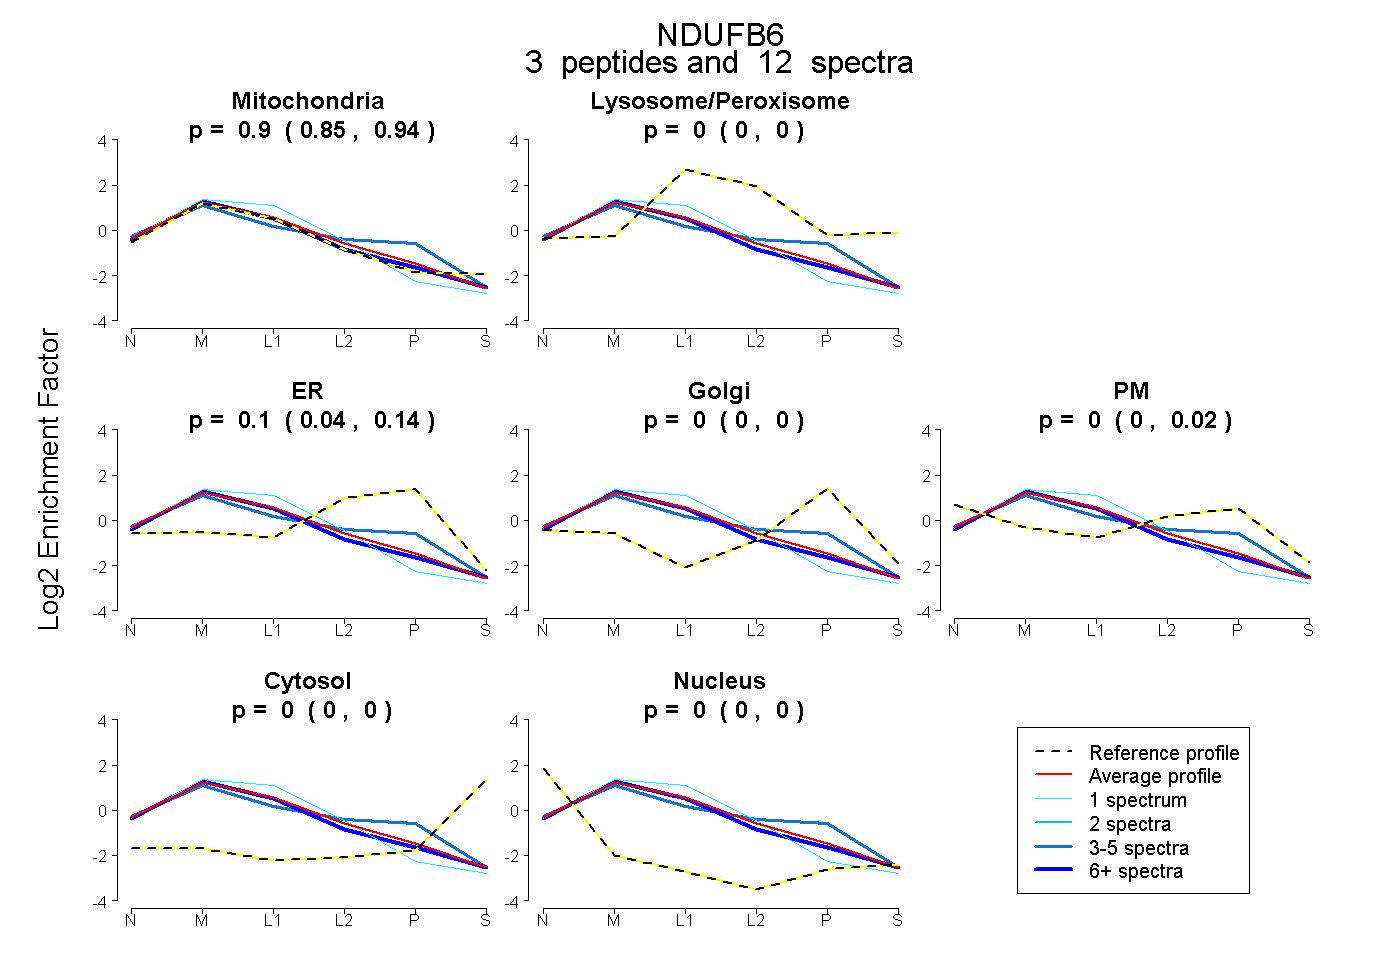 |
0.900 0.849 | 0.942 |
0.000 0.000 | 0.000 |
0.100 0.045 | 0.140 |
0.000 0.000 | 0.000 |
0.000 0.000 | 0.018 |
0.000 0.000 | 0.000 |
0.000 0.000 | 0.000 |
|||
| Plot | Lyso | Other | |||||||||||
| Expt C |
5 peptides |
73 spectra |
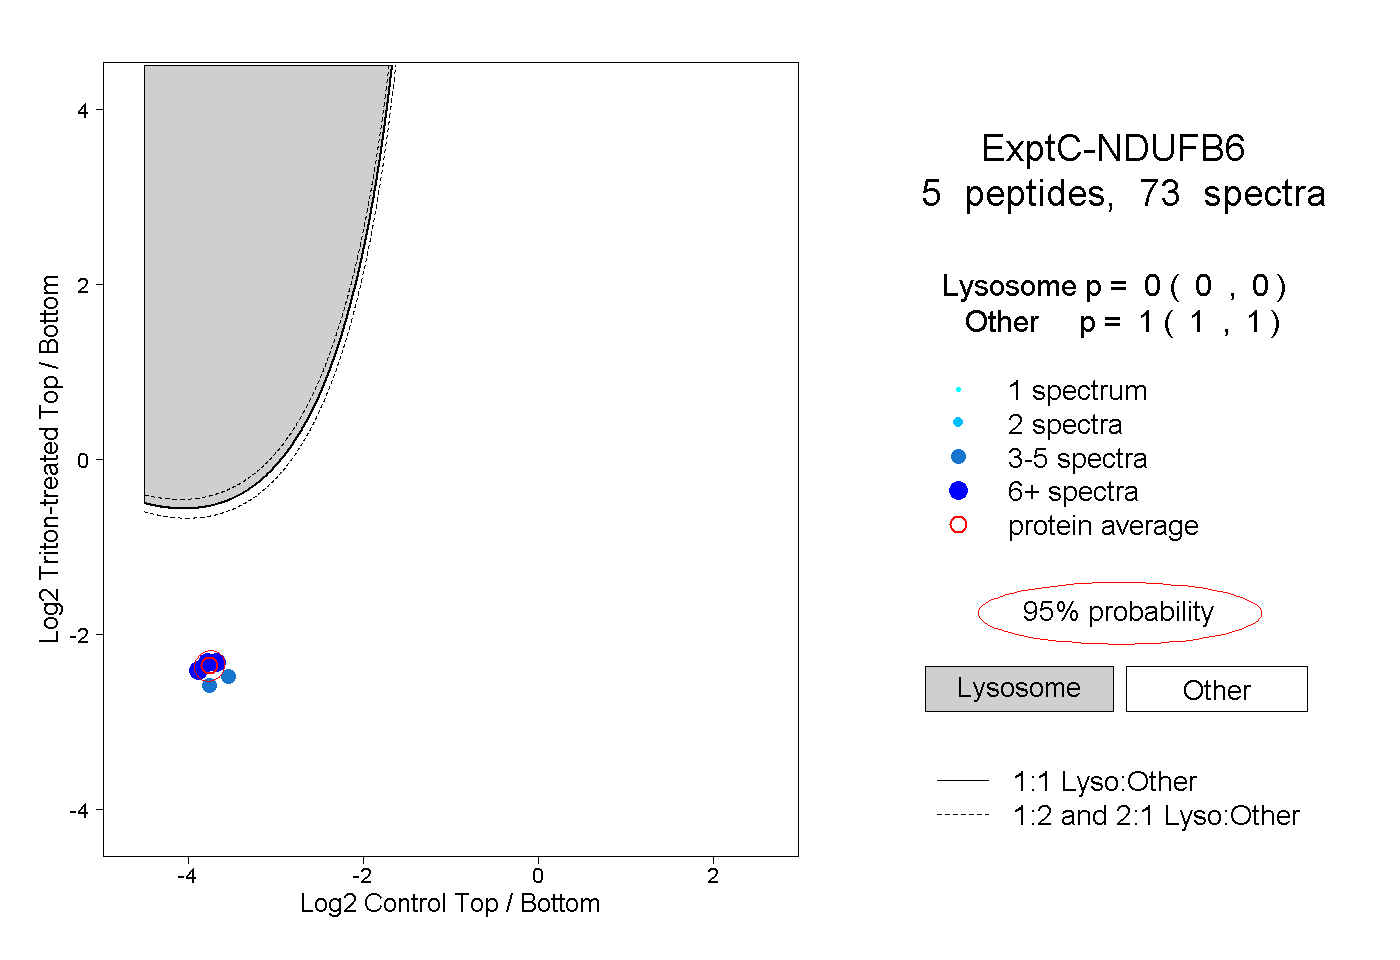 |
0.000 0.000 | 0.000 |
1.000 1.000 | 1.000 |
||||||||
| Plot | Lyso | Other | |||||||||||
| Expt D |
4 peptides |
11 spectra |
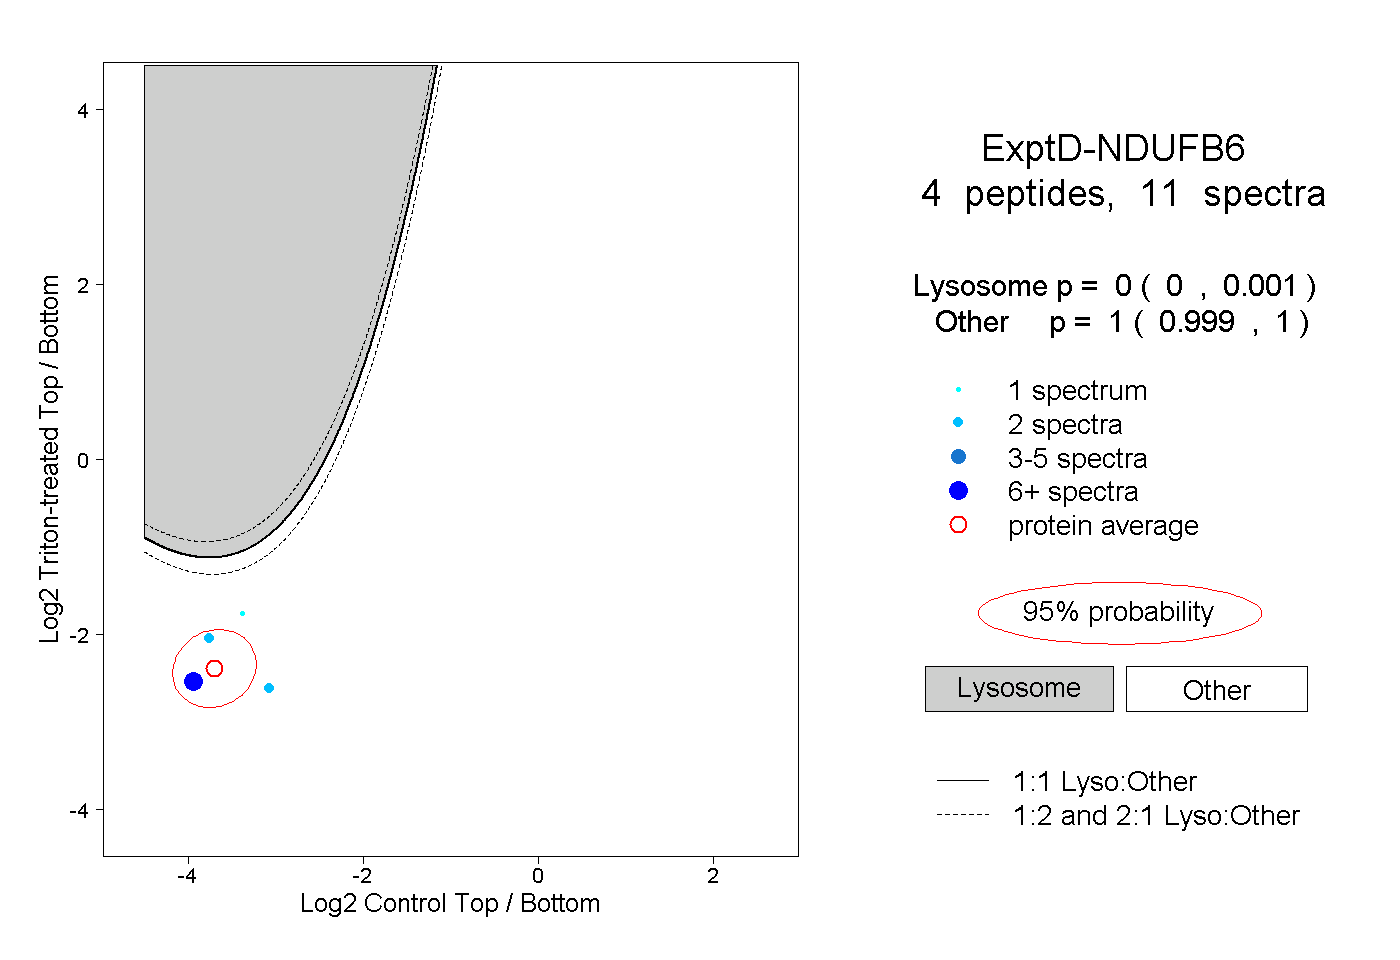 |
0.000 0.000 | 0.001 |
1.000 0.999 | 1.000 |