 15
15peptides
spectra
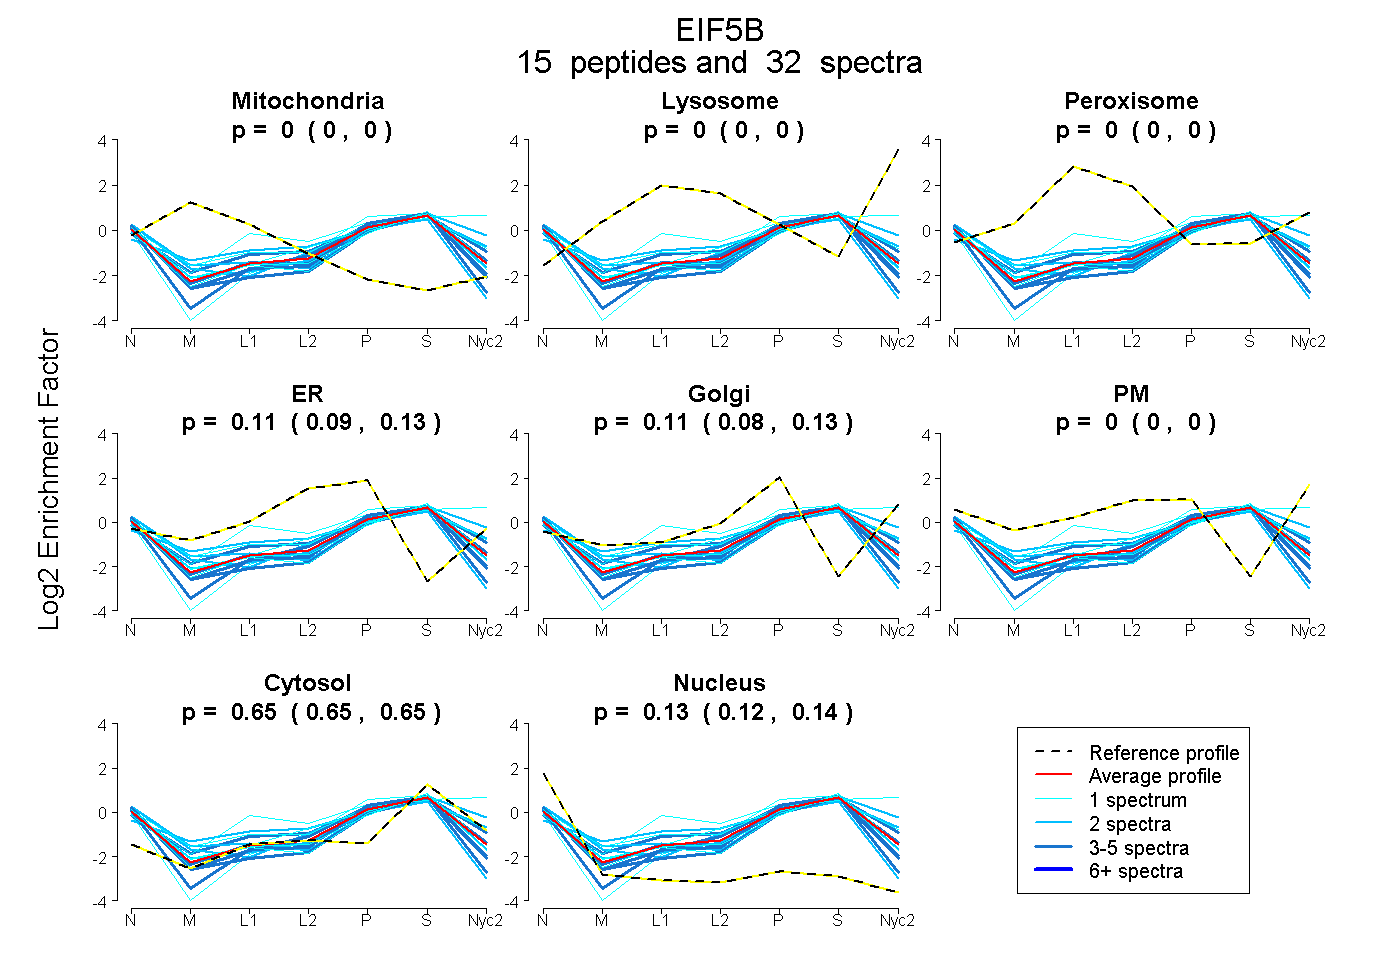
0.000 | 0.000
0.000 | 0.000
0.000 | 0.000
0.088 | 0.134
0.077 | 0.131
0.000 | 0.000
0.647 | 0.653
0.124 | 0.137
5peptides
spectra
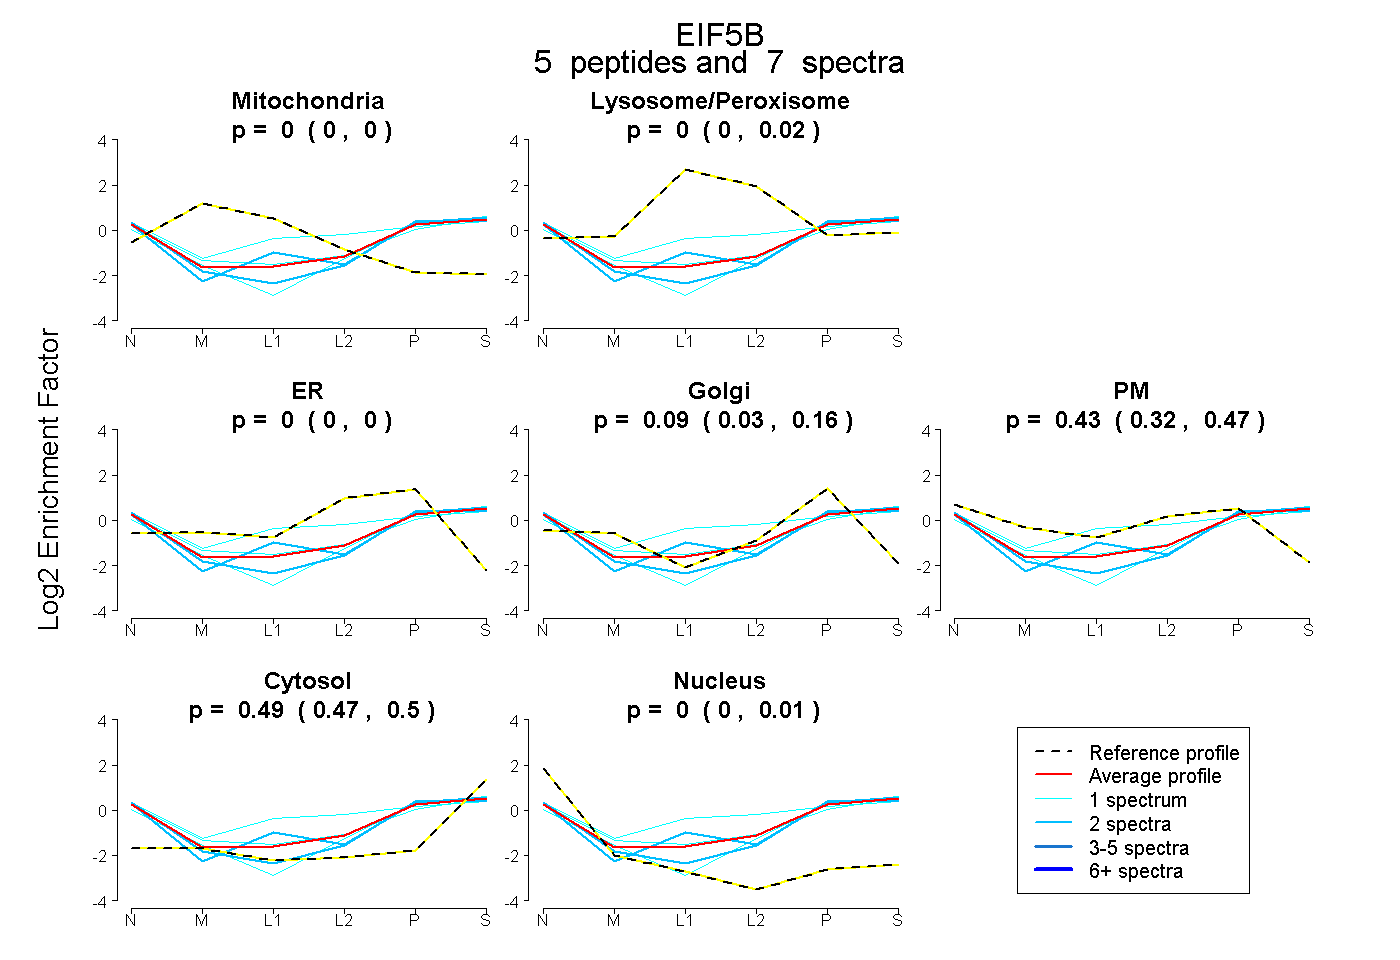
0.000 | 0.000
0.000 | 0.023
0.000 | 0.000
0.030 | 0.161
0.322 | 0.473
0.472 | 0.496
0.000 | 0.008
10peptides
spectra
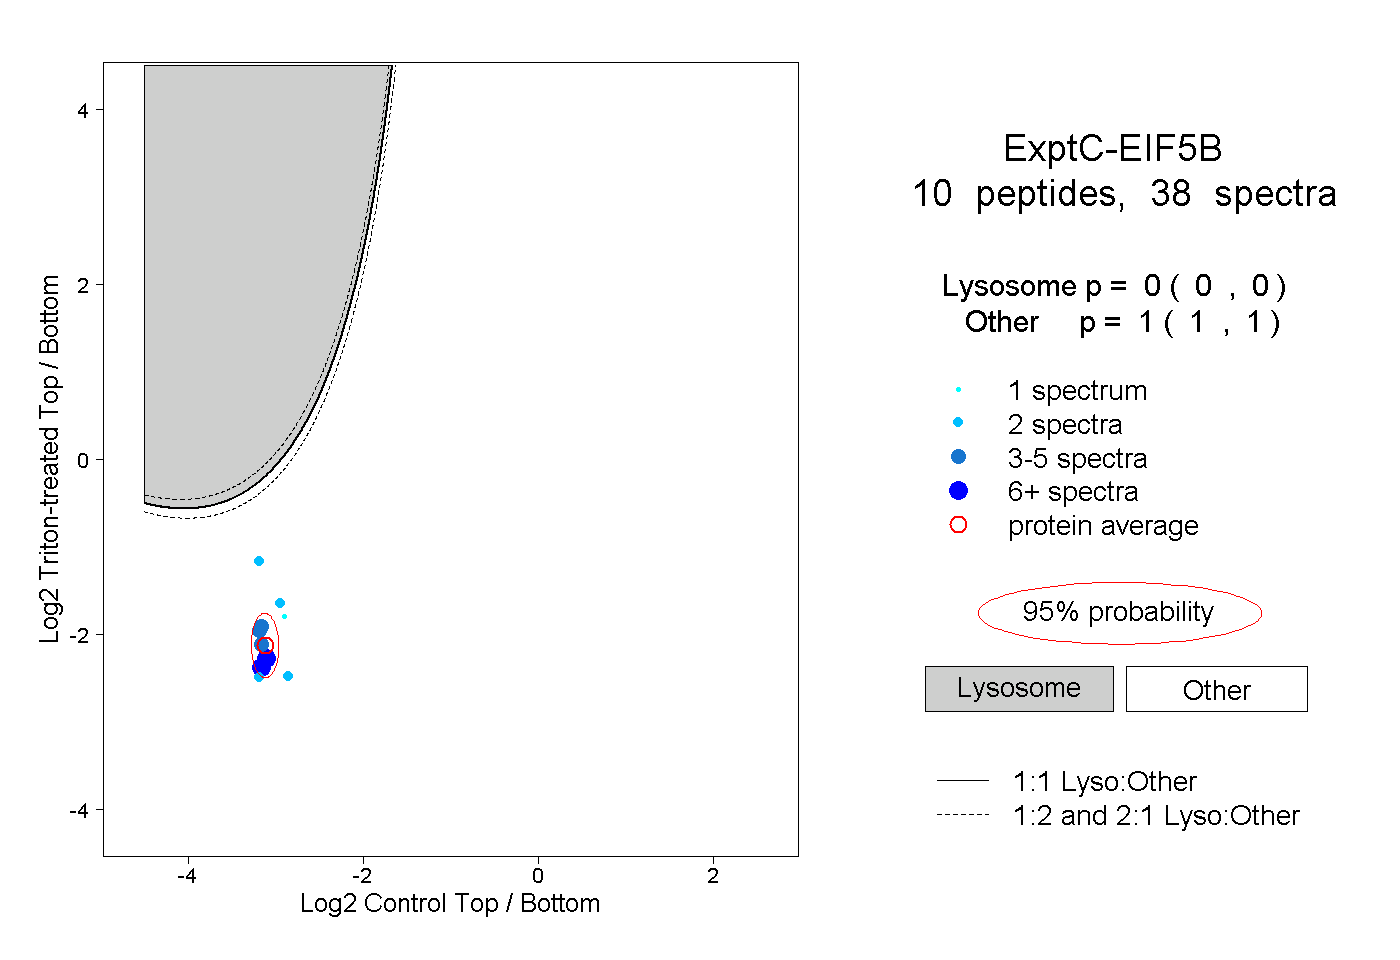
0.000 | 0.000
1.000 | 1.000
2peptides
spectra
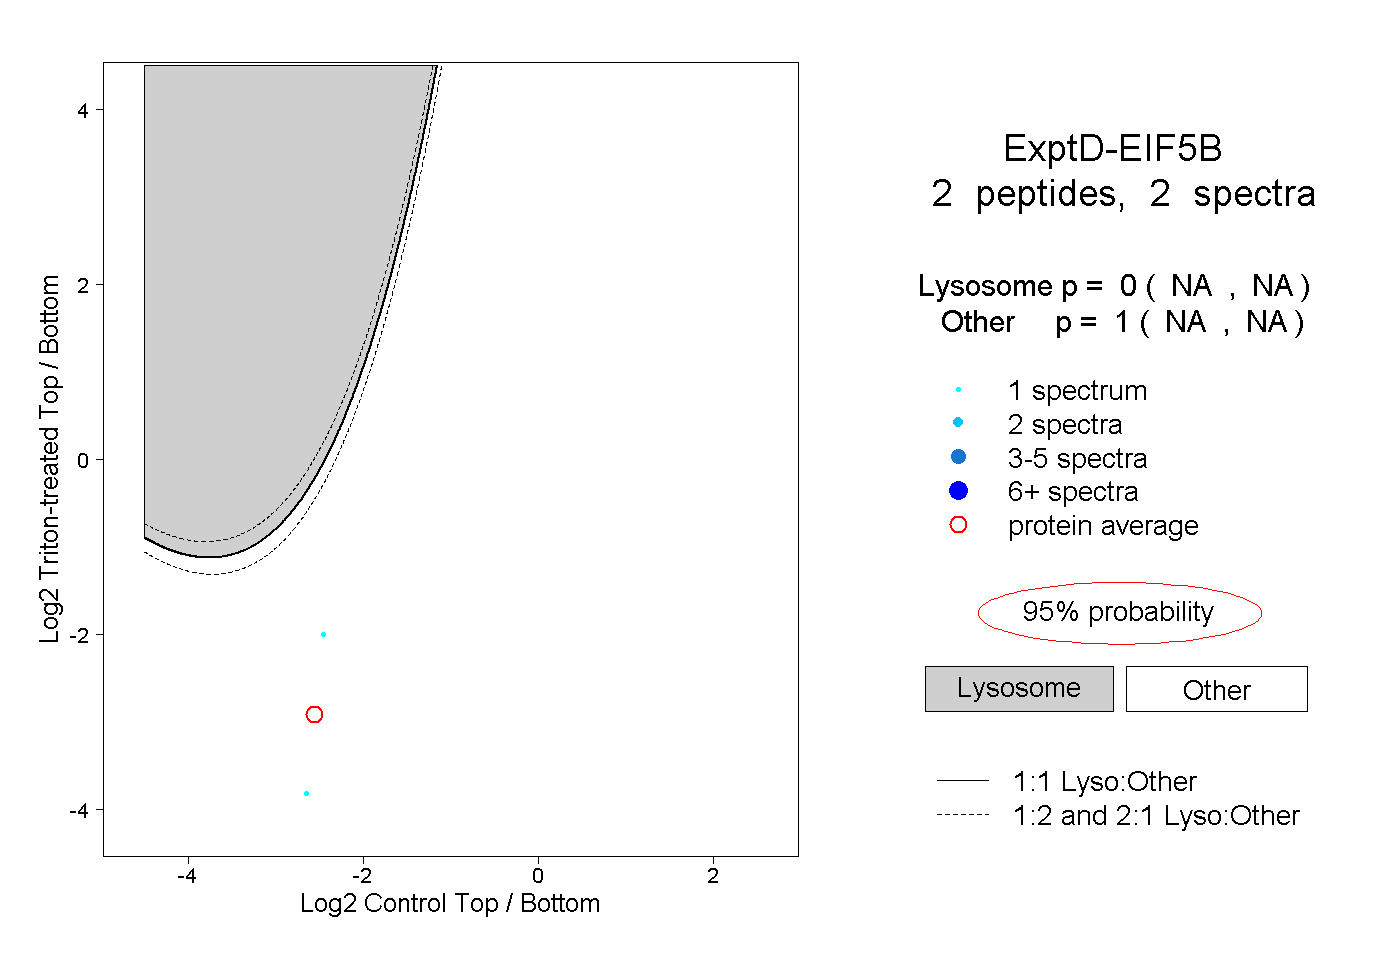
NA | NA
NA | NA