 15
15peptides
spectra
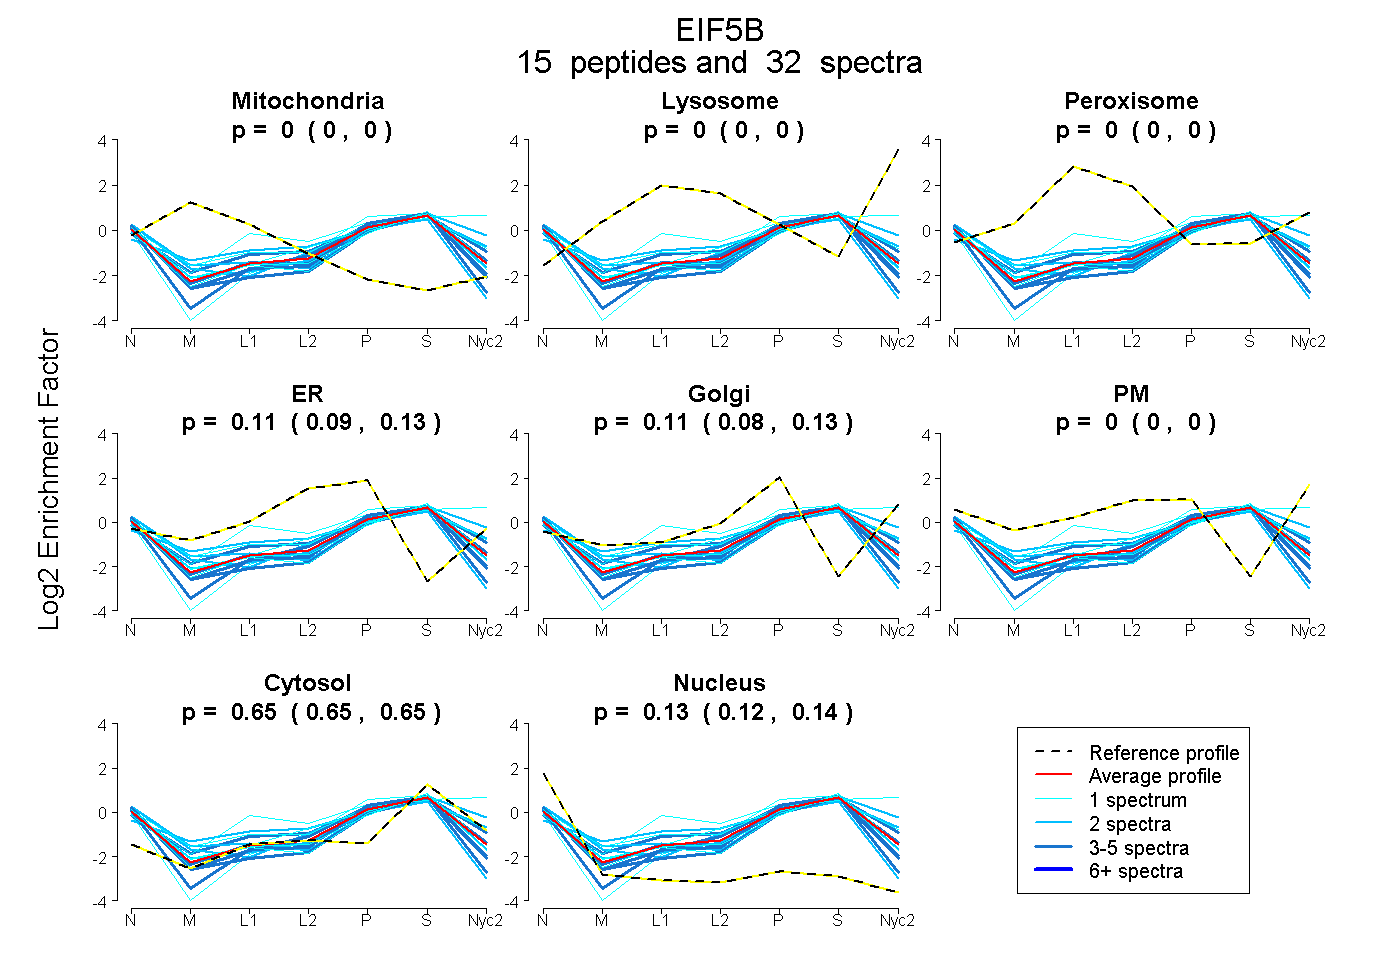
0.000 | 0.000
0.000 | 0.000
0.000 | 0.000
0.088 | 0.134
0.077 | 0.131
0.000 | 0.000
0.647 | 0.653
0.124 | 0.137
| Plot | Mito | Lyso | Perox | ER | Golgi | PM | Cytosol | Nucleus | |||||
| Expt A |
15 peptides |
32 spectra |
|
0.000 0.000 | 0.000 |
0.000 0.000 | 0.000 |
0.000 0.000 | 0.000 |
0.114 0.088 | 0.134 |
0.105 0.077 | 0.131 |
0.000 0.000 | 0.000 |
0.650 0.647 | 0.653 |
0.131 0.124 | 0.137 |
| 3 spectra, NVNTEK | 0.000 | 0.000 | 0.000 | 0.066 | 0.167 | 0.000 | 0.634 | 0.133 | ||
| 3 spectra, AQVMEVK | 0.000 | 0.000 | 0.000 | 0.157 | 0.143 | 0.001 | 0.660 | 0.039 | ||
| 1 spectrum, HLQAQGVEVPSK | 0.000 | 0.050 | 0.020 | 0.000 | 0.000 | 0.369 | 0.561 | 0.000 | ||
| 2 spectra, DELIHELK | 0.000 | 0.000 | 0.000 | 0.070 | 0.112 | 0.000 | 0.667 | 0.151 | ||
| 3 spectra, RPDEEVLVLR | 0.000 | 0.000 | 0.000 | 0.099 | 0.000 | 0.000 | 0.651 | 0.250 | ||
| 1 spectrum, QTLNAIK | 0.000 | 0.000 | 0.027 | 0.065 | 0.200 | 0.063 | 0.587 | 0.057 | ||
| 1 spectrum, TSEVPYAGINIGPVHK | 0.000 | 0.000 | 0.000 | 0.000 | 0.168 | 0.000 | 0.641 | 0.191 | ||
| 1 spectrum, SDWQLIVELK | 0.000 | 0.000 | 0.000 | 0.045 | 0.128 | 0.000 | 0.702 | 0.125 | ||
| 4 spectra, ILPQYIFNSR | 0.000 | 0.000 | 0.000 | 0.000 | 0.112 | 0.000 | 0.636 | 0.252 | ||
| 2 spectra, HIAVFPCK | 0.000 | 0.000 | 0.000 | 0.207 | 0.000 | 0.000 | 0.521 | 0.273 | ||
| 2 spectra, HFEATDILVSK | 0.000 | 0.000 | 0.069 | 0.000 | 0.151 | 0.142 | 0.637 | 0.000 | ||
| 1 spectrum, TLAGLPLLVAYK | 0.000 | 0.000 | 0.000 | 0.214 | 0.000 | 0.000 | 0.679 | 0.107 | ||
| 1 spectrum, AEVTLR | 0.000 | 0.000 | 0.000 | 0.140 | 0.000 | 0.000 | 0.690 | 0.170 | ||
| 2 spectra, GLLLPPPMK | 0.000 | 0.000 | 0.000 | 0.000 | 0.232 | 0.058 | 0.587 | 0.122 | ||
| 5 spectra, DAQEMADSLGVR | 0.000 | 0.000 | 0.000 | 0.165 | 0.000 | 0.000 | 0.665 | 0.171 |
| Plot | Mito | Lyso or Perox | ER | Golgi | PM | Cytosol | Nucleus | ||||||
| Expt B |
5 peptides |
7 spectra |
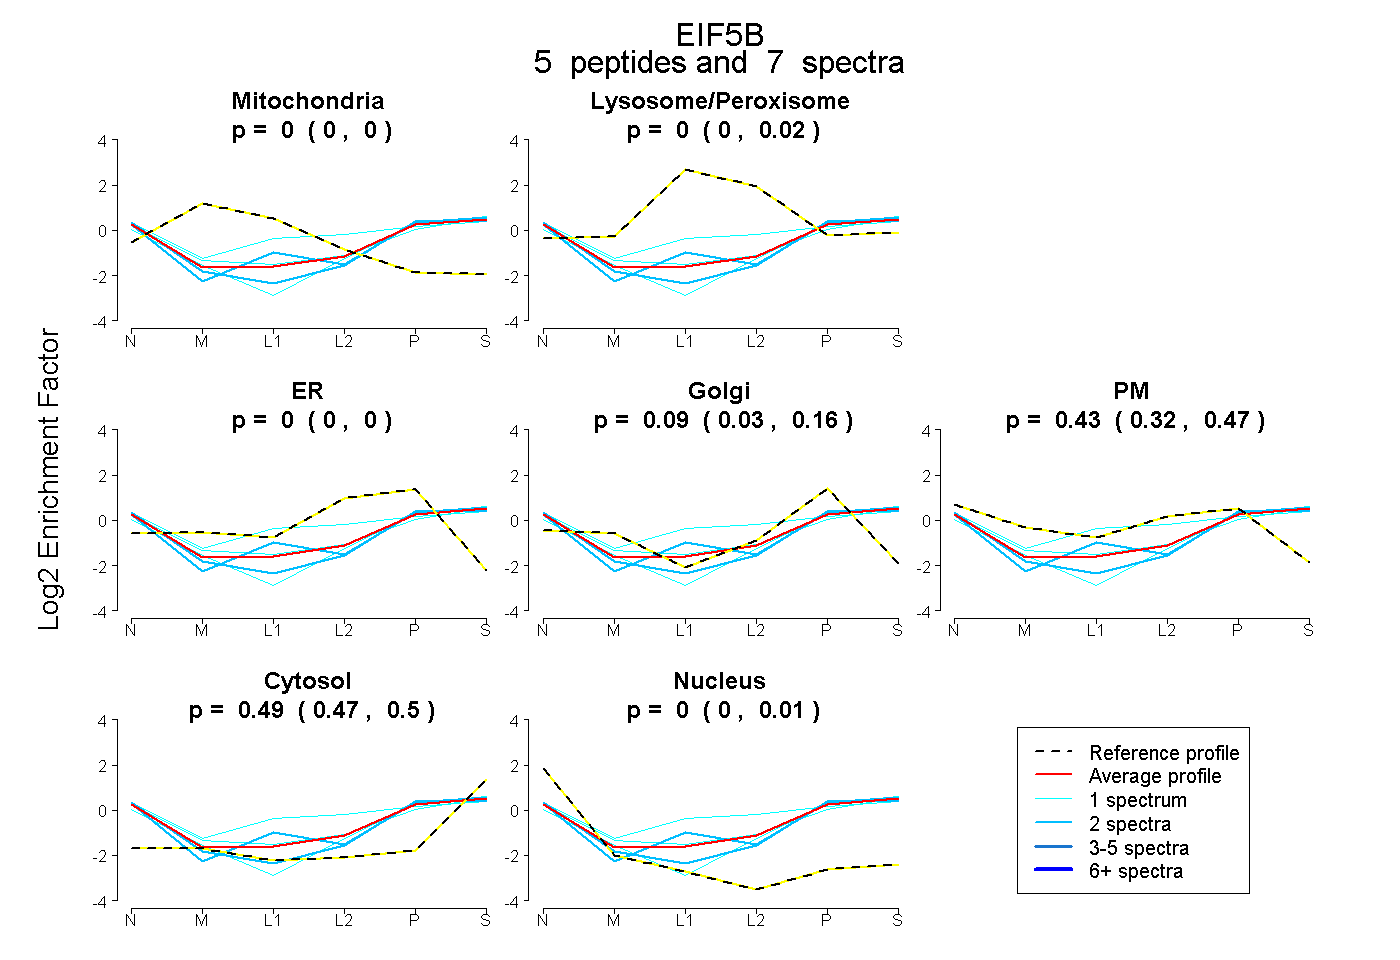 |
0.000 0.000 | 0.000 |
0.000 0.000 | 0.023 |
0.000 0.000 | 0.000 |
0.086 0.030 | 0.161 |
0.427 0.322 | 0.473 |
0.487 0.472 | 0.496 |
0.000 0.000 | 0.008 |
|||
| Plot | Lyso | Other | |||||||||||
| Expt C |
10 peptides |
38 spectra |
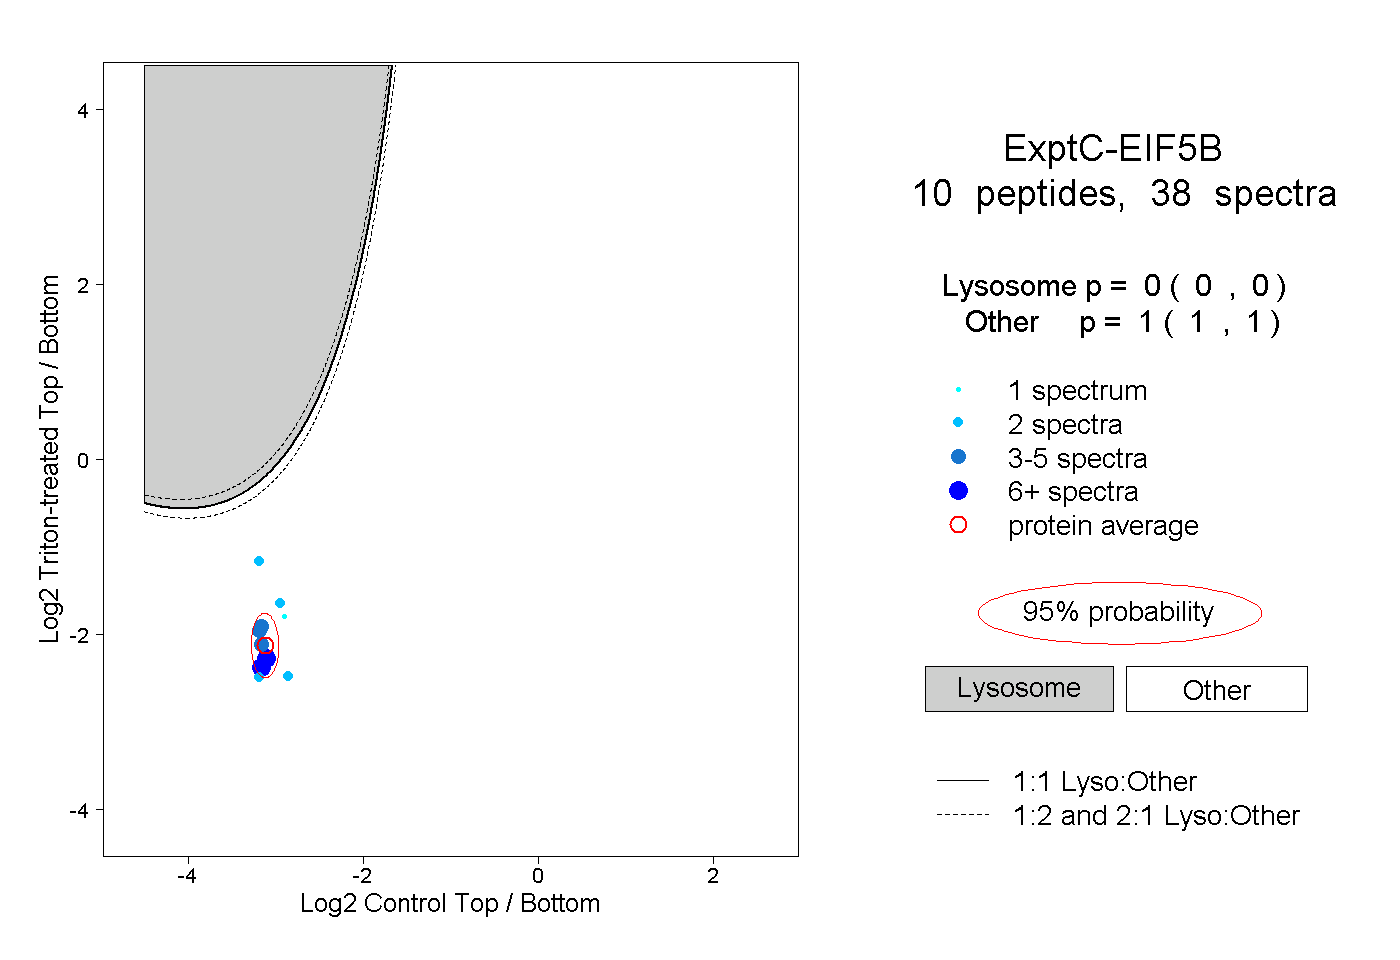 |
0.000 0.000 | 0.000 |
1.000 1.000 | 1.000 |
||||||||
| Plot | Lyso | Other | |||||||||||
| Expt D |
2 peptides |
2 spectra |
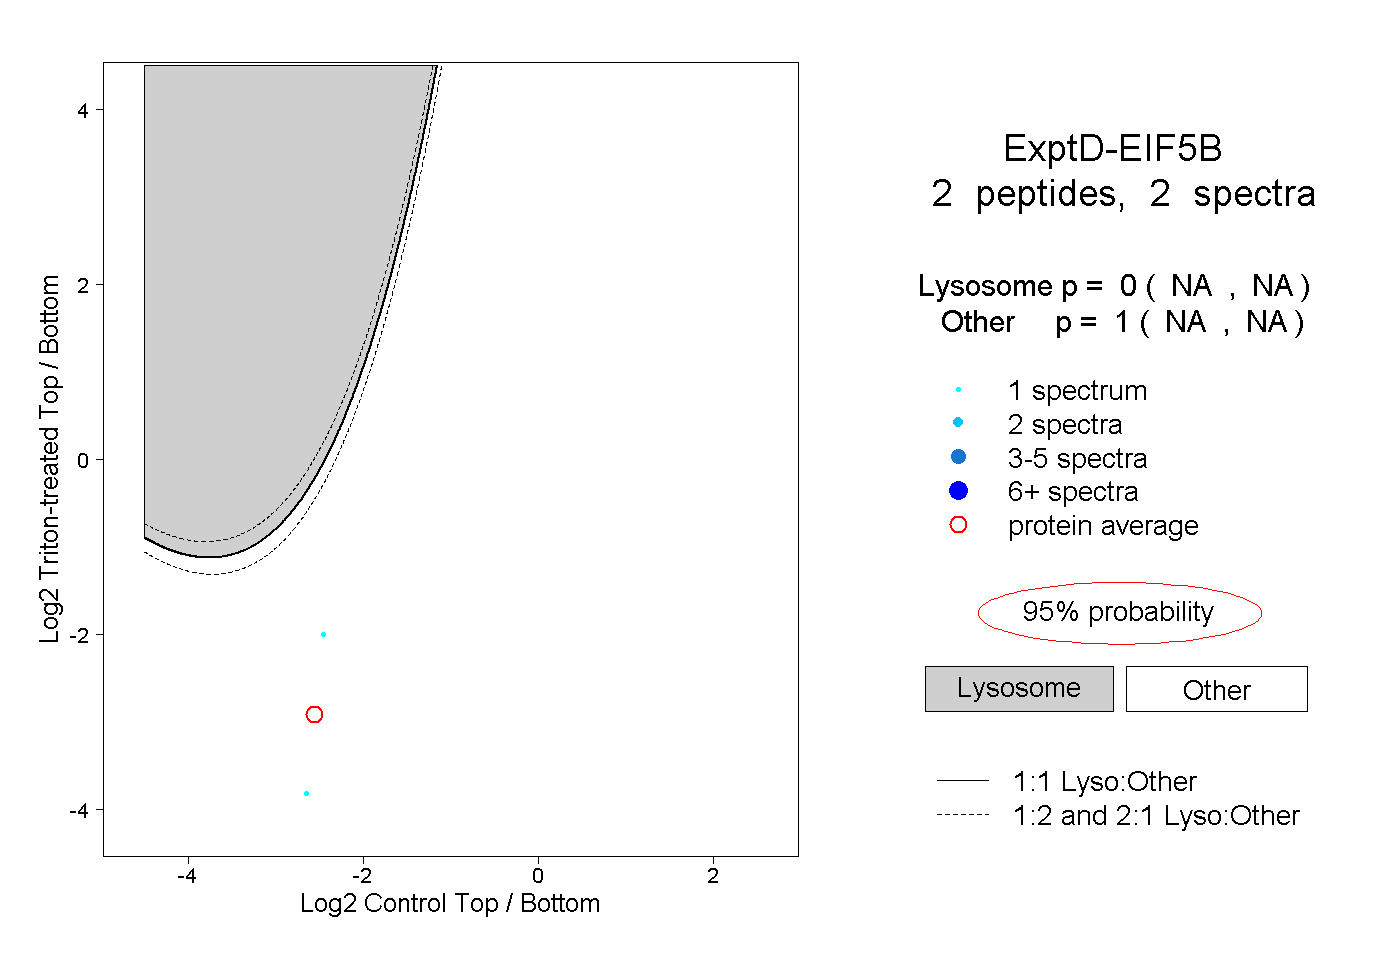 |
0.000 NA | NA |
1.000 NA | NA |