EIF5B
[ENSRNOP00000036844]
Main page
| | | Plot |
Mito |
Lyso |
|
Perox |
ER |
Golgi |
PM |
Cytosol |
Nucleus |
|
| Expt A |
 15
15
peptides |
32
spectra |
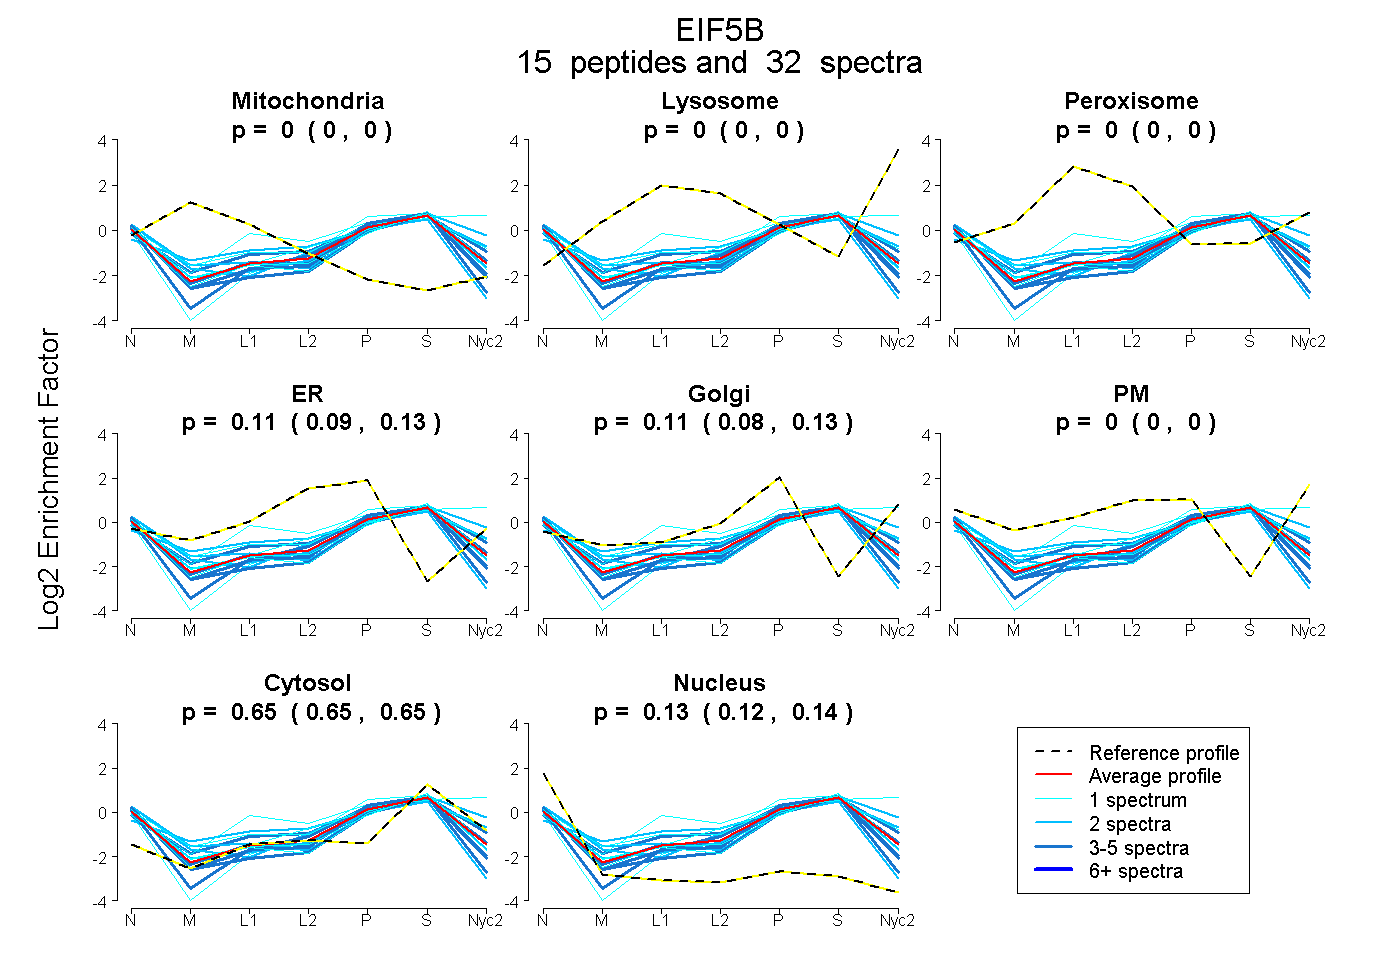 |
0.000
0.000 | 0.000 |
0.000
0.000 | 0.000 |
|
0.000
0.000 | 0.000 |
0.114
0.088 | 0.134 |
0.105
0.077 | 0.131 |
0.000
0.000 | 0.000 |
0.650
0.647 | 0.653 |
0.131
0.124 | 0.137 |
|
| | | Plot |
Mito |
|
Lyso or Perox |
|
ER |
Golgi |
PM |
Cytosol |
Nucleus |
|
| Expt B |
5
peptides |
7
spectra |
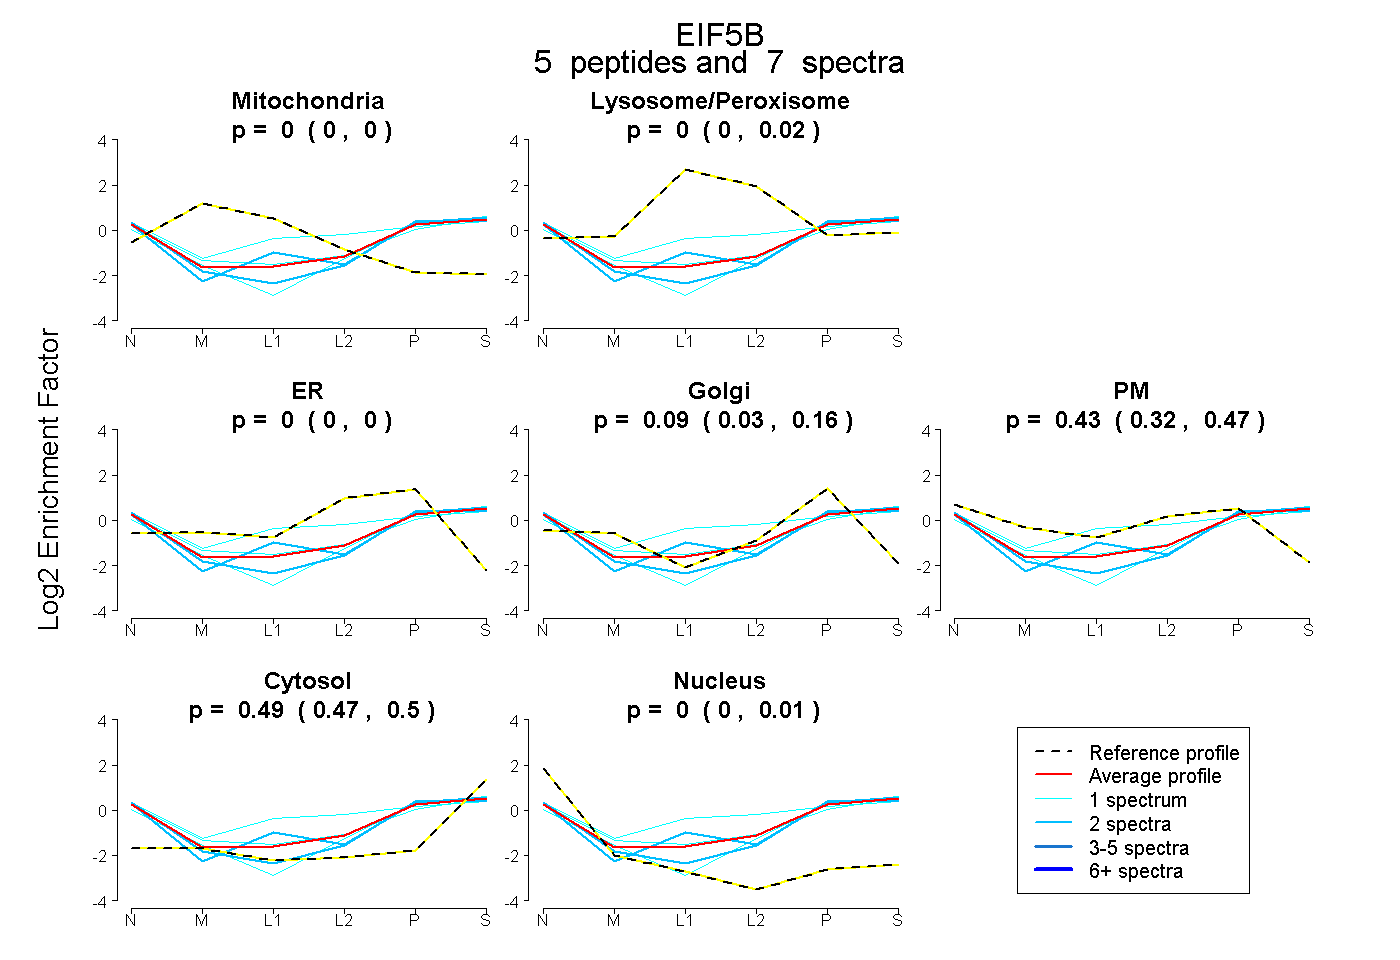 |
0.000
0.000 | 0.000 |
|
0.000
0.000 | 0.023 |
|
0.000
0.000 | 0.000 |
0.086
0.030 | 0.161 |
0.427
0.322 | 0.473 |
0.487
0.472 | 0.496 |
0.000
0.000 | 0.008 |
|
| 2 spectra, RPDEEVLVLR |
0.000 |
|
0.197 |
|
0.000 |
0.284 |
0.000 |
0.400 |
0.119 |
|
| 1 spectrum, HIAVFPCK |
0.000 |
|
0.000 |
|
0.000 |
0.000 |
0.496 |
0.504 |
0.000 |
|
| 1 spectrum, HFEATDILVSK |
0.000 |
|
0.254 |
|
0.000 |
0.000 |
0.408 |
0.337 |
0.000 |
|
| 1 spectrum, ILPQYIFNSR |
0.000 |
|
0.000 |
|
0.000 |
0.467 |
0.007 |
0.500 |
0.026 |
|
| 2 spectra, LEEIEAK |
0.000 |
|
0.000 |
|
0.000 |
0.390 |
0.090 |
0.440 |
0.081 |
|
| | | Plot |
|
Lyso |
|
|
|
|
|
|
|
Other |
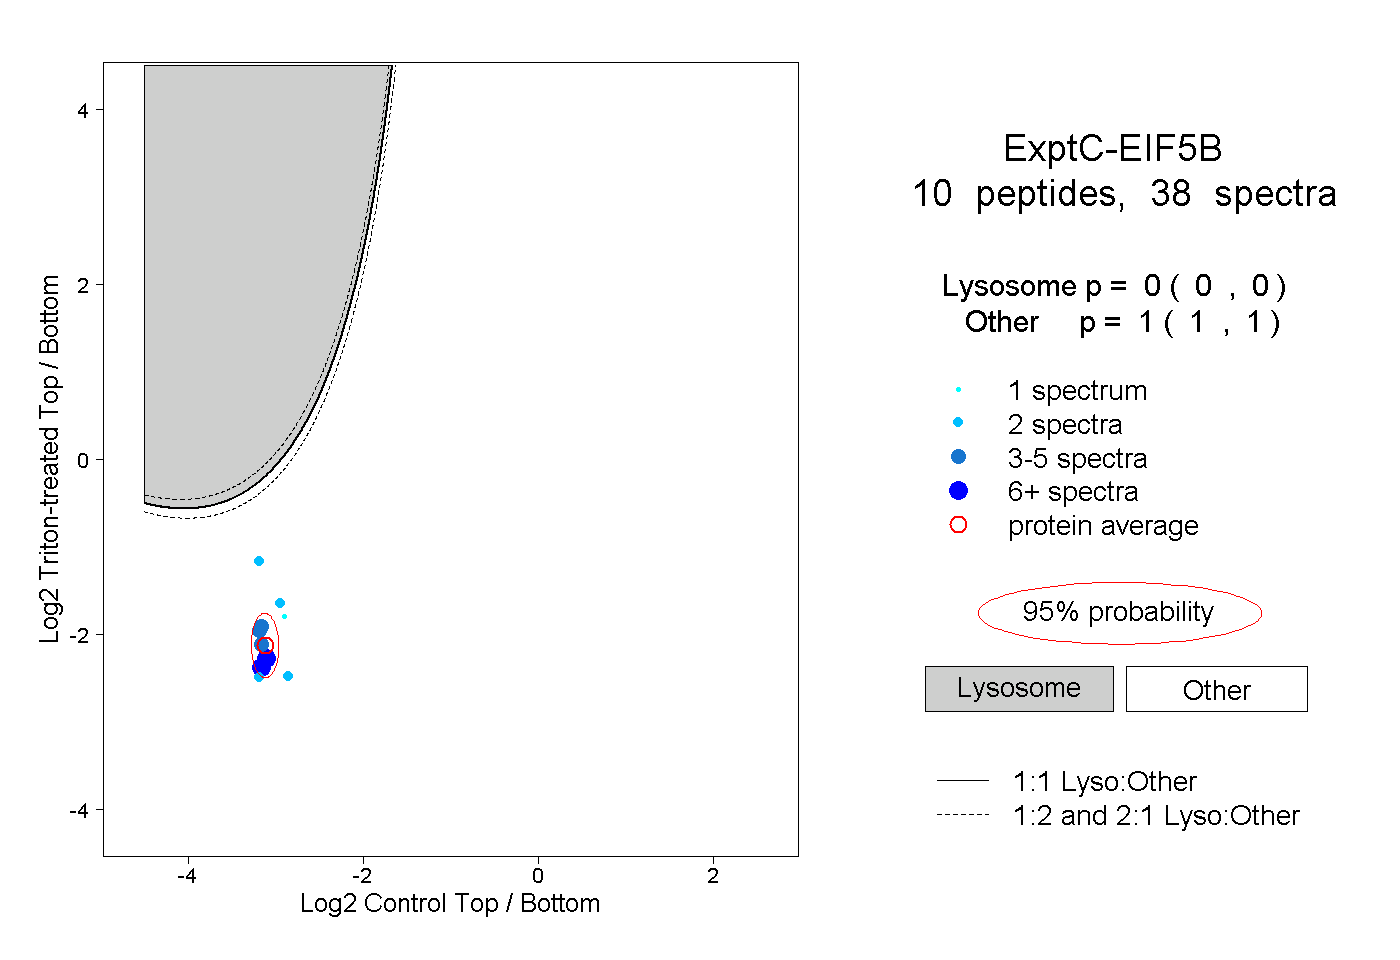
| Expt C |
10
peptides |
38
spectra |
 |
|
0.000
0.000 | 0.000 |
|
|
|
|
|
|
|
1.000
1.000 | 1.000 |
| | | Plot |
|
Lyso |
|
|
|
|
|
|
|
Other |
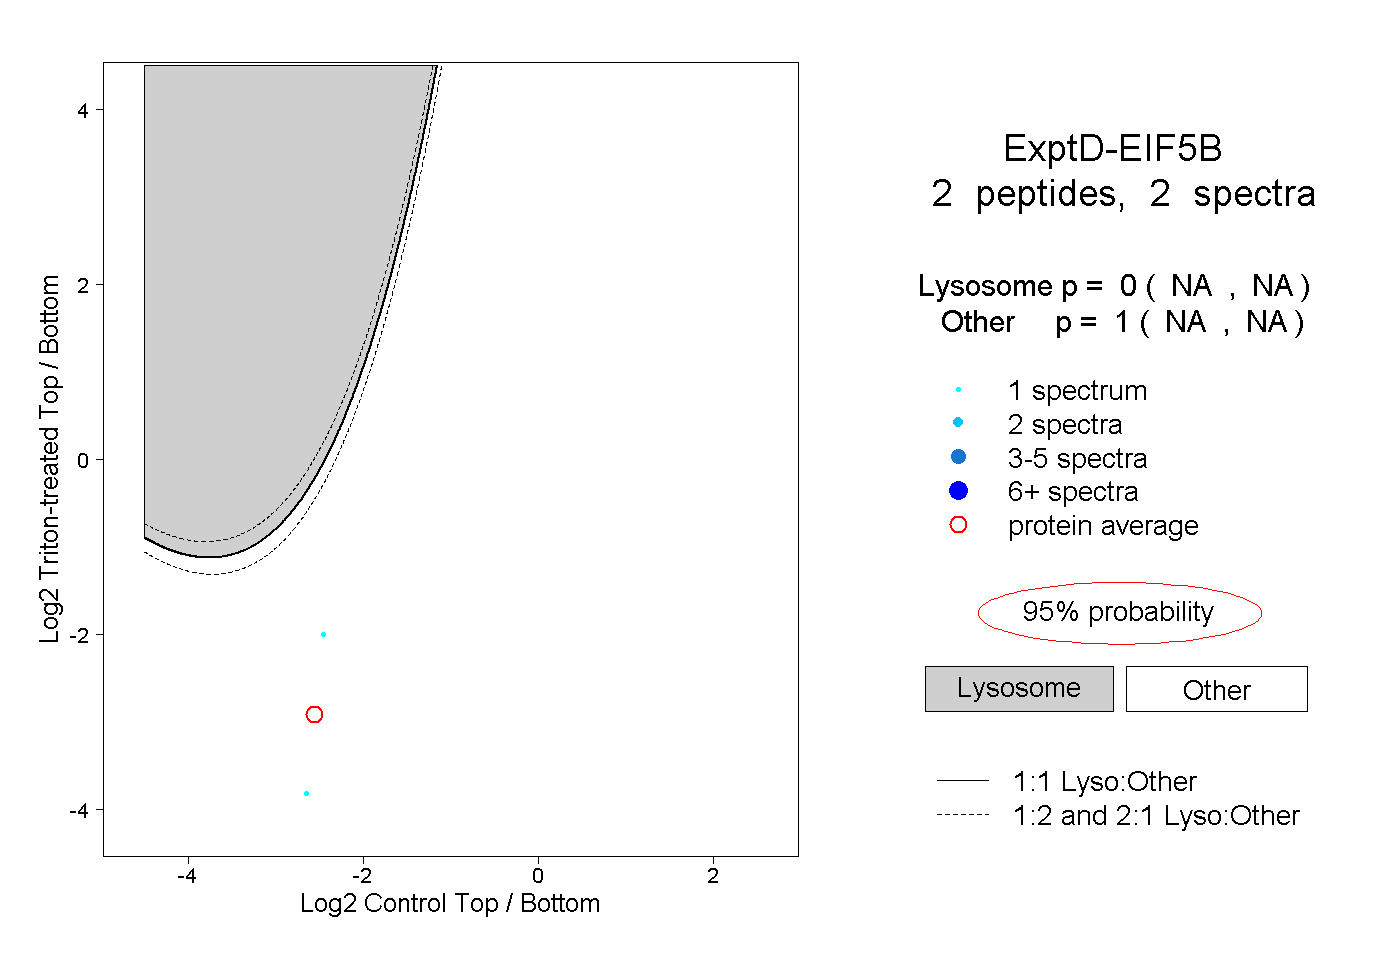
| Expt D |
2
peptides |
2
spectra |
 |
|
0.000
NA | NA |
|
|
|
|
|
|
|
1.000
NA | NA |