 11
11peptides
spectra
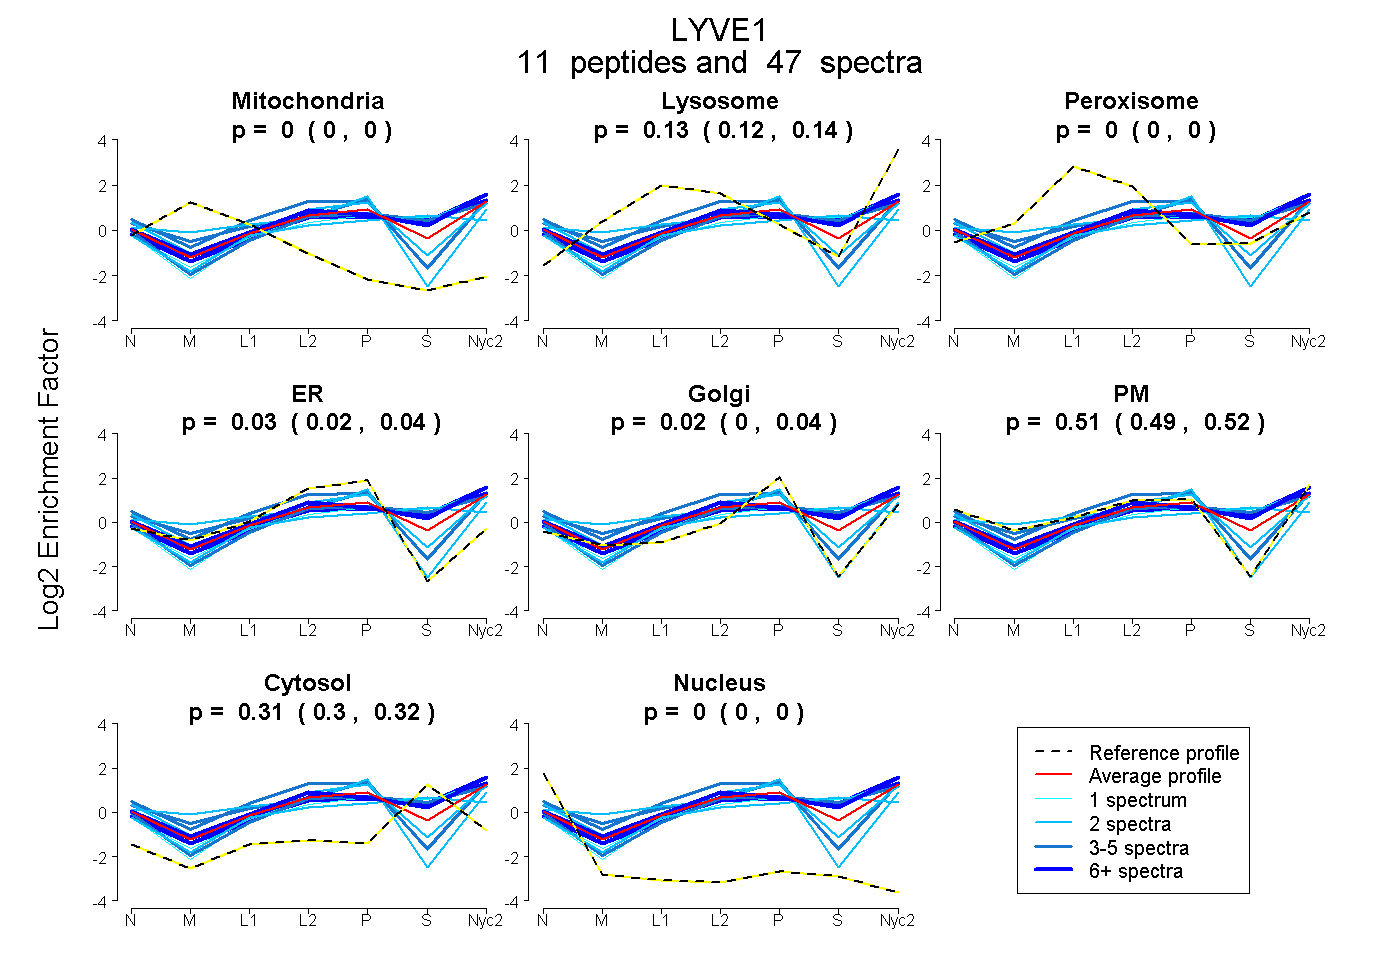
0.000 | 0.000
0.122 | 0.140
0.000 | 0.000
0.017 | 0.043
0.001 | 0.036
0.490 | 0.524
0.297 | 0.317
0.000 | 0.000
5peptides
spectra
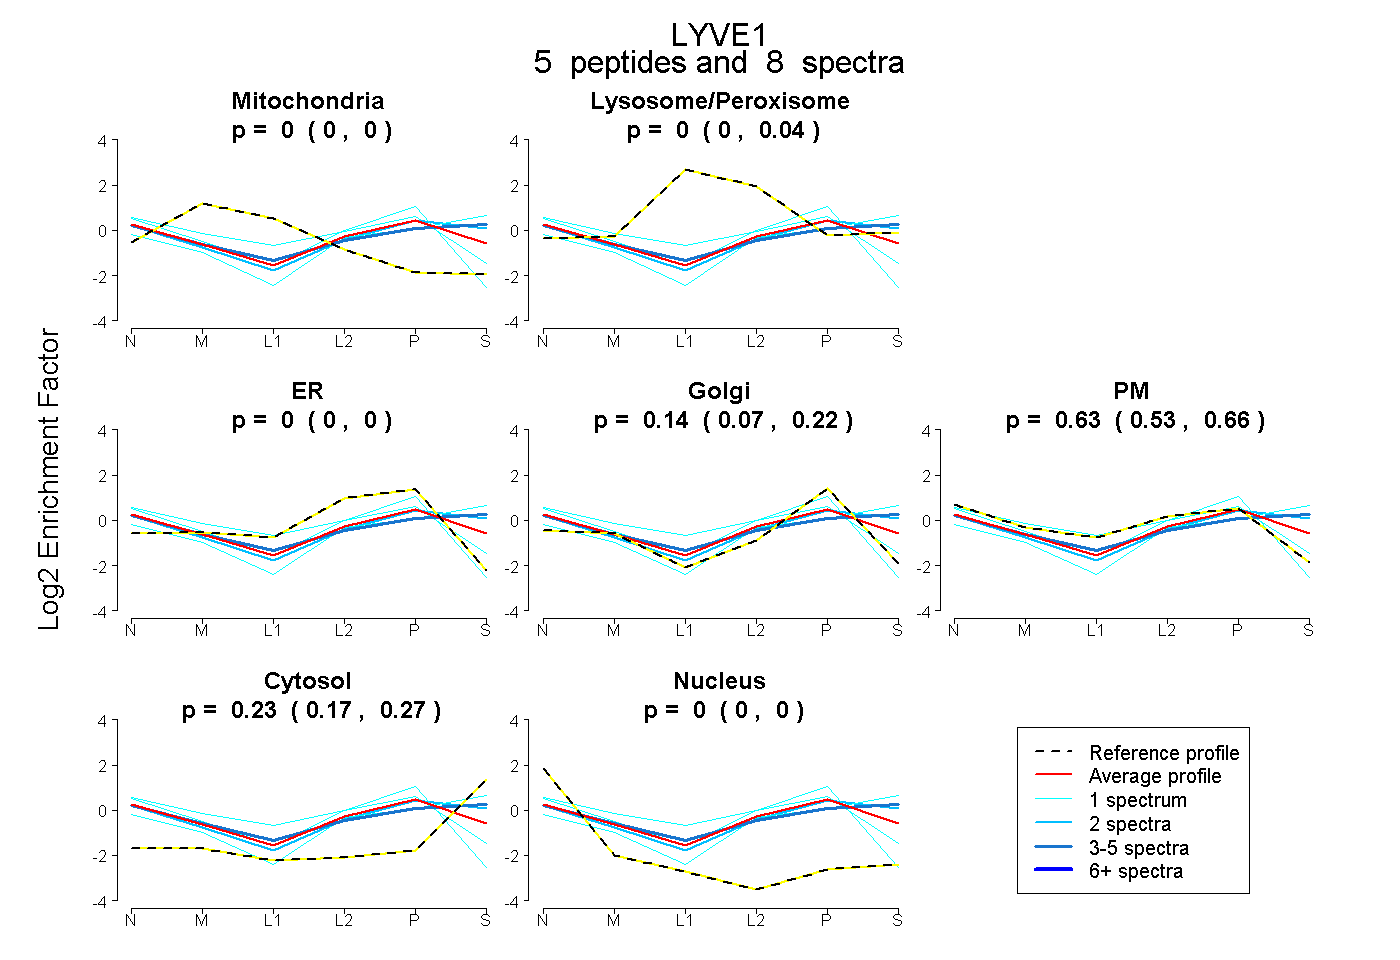
0.000 | 0.000
0.000 | 0.041
0.000 | 0.000
0.074 | 0.223
0.531 | 0.664
0.173 | 0.274
0.000 | 0.000
11peptides
spectra
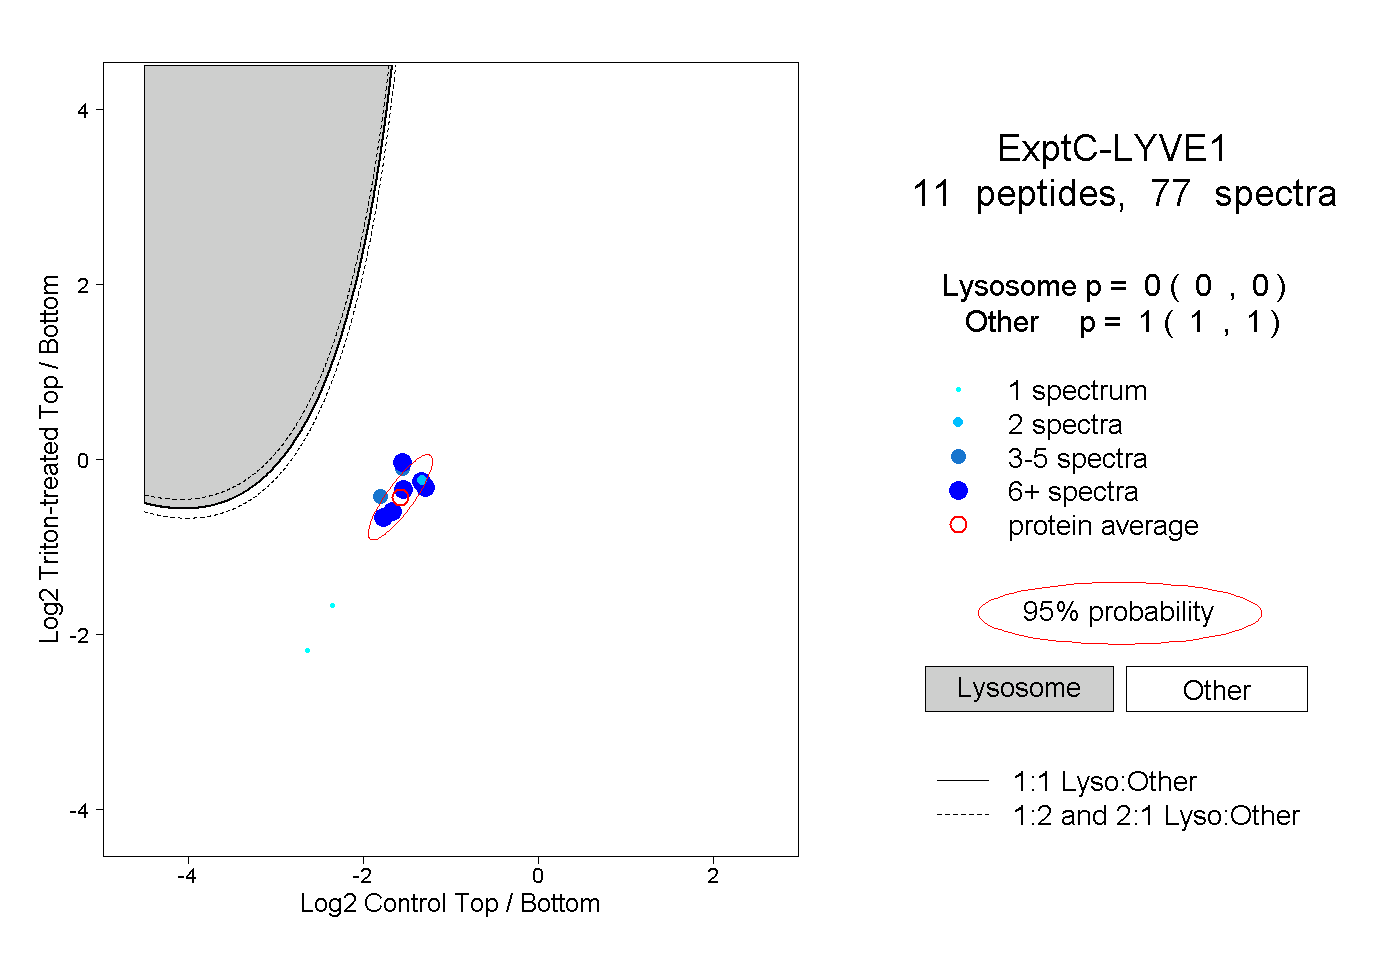
0.000 | 0.000
1.000 | 1.000
3peptides
spectra
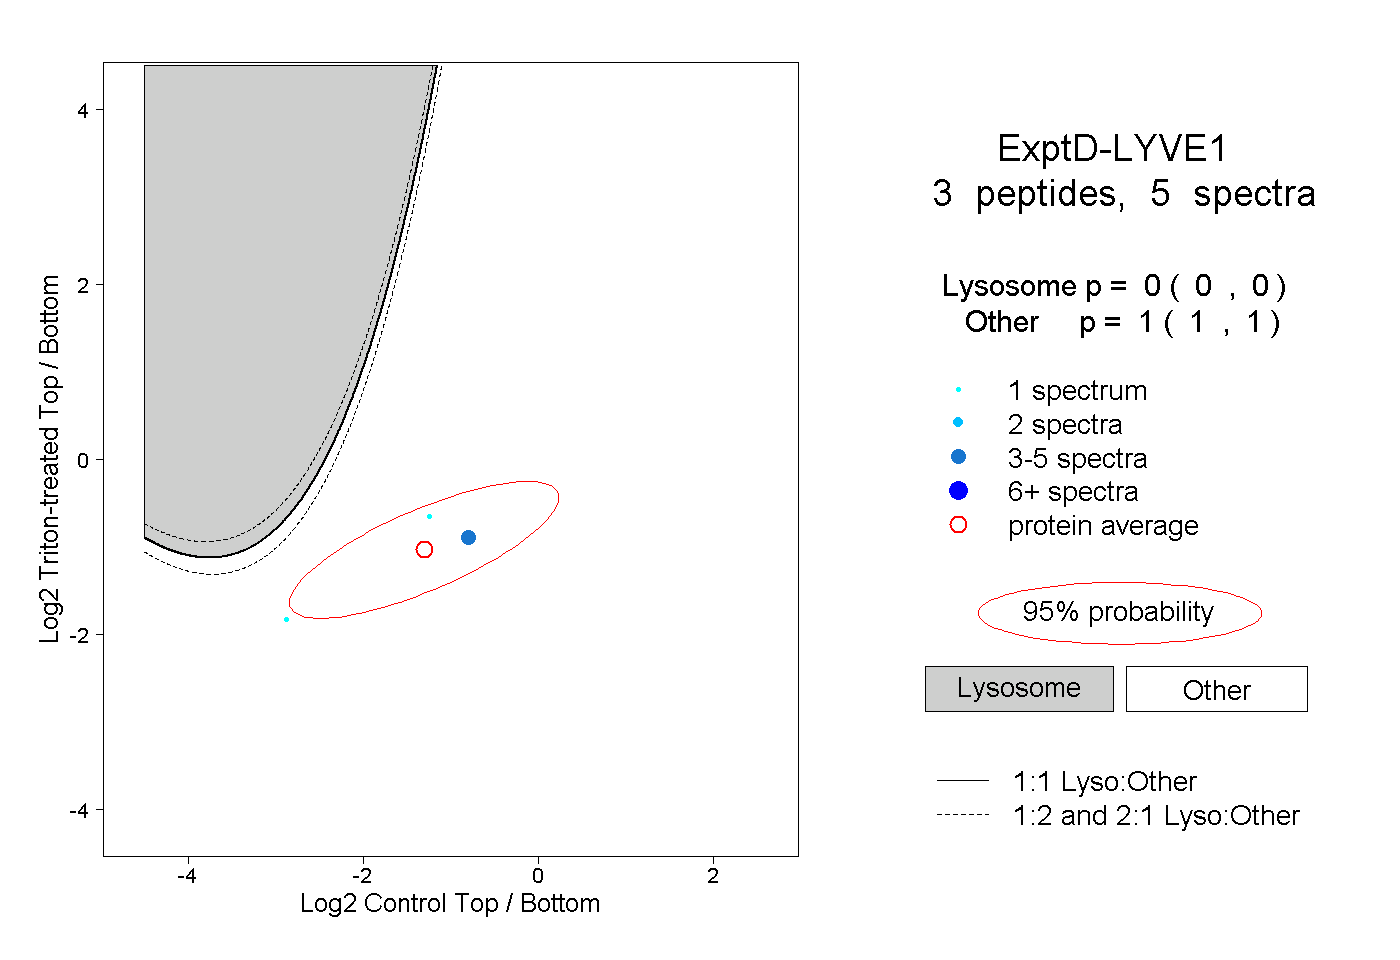
0.000 | 0.000
1.000 | 1.000