 11
11peptides
spectra
0.000 | 0.000
0.122 | 0.140
0.000 | 0.000
0.017 | 0.043
0.001 | 0.036
0.490 | 0.524
0.297 | 0.317
0.000 | 0.000
| Plot | Mito | Lyso | Perox | ER | Golgi | PM | Cytosol | Nucleus | |||||
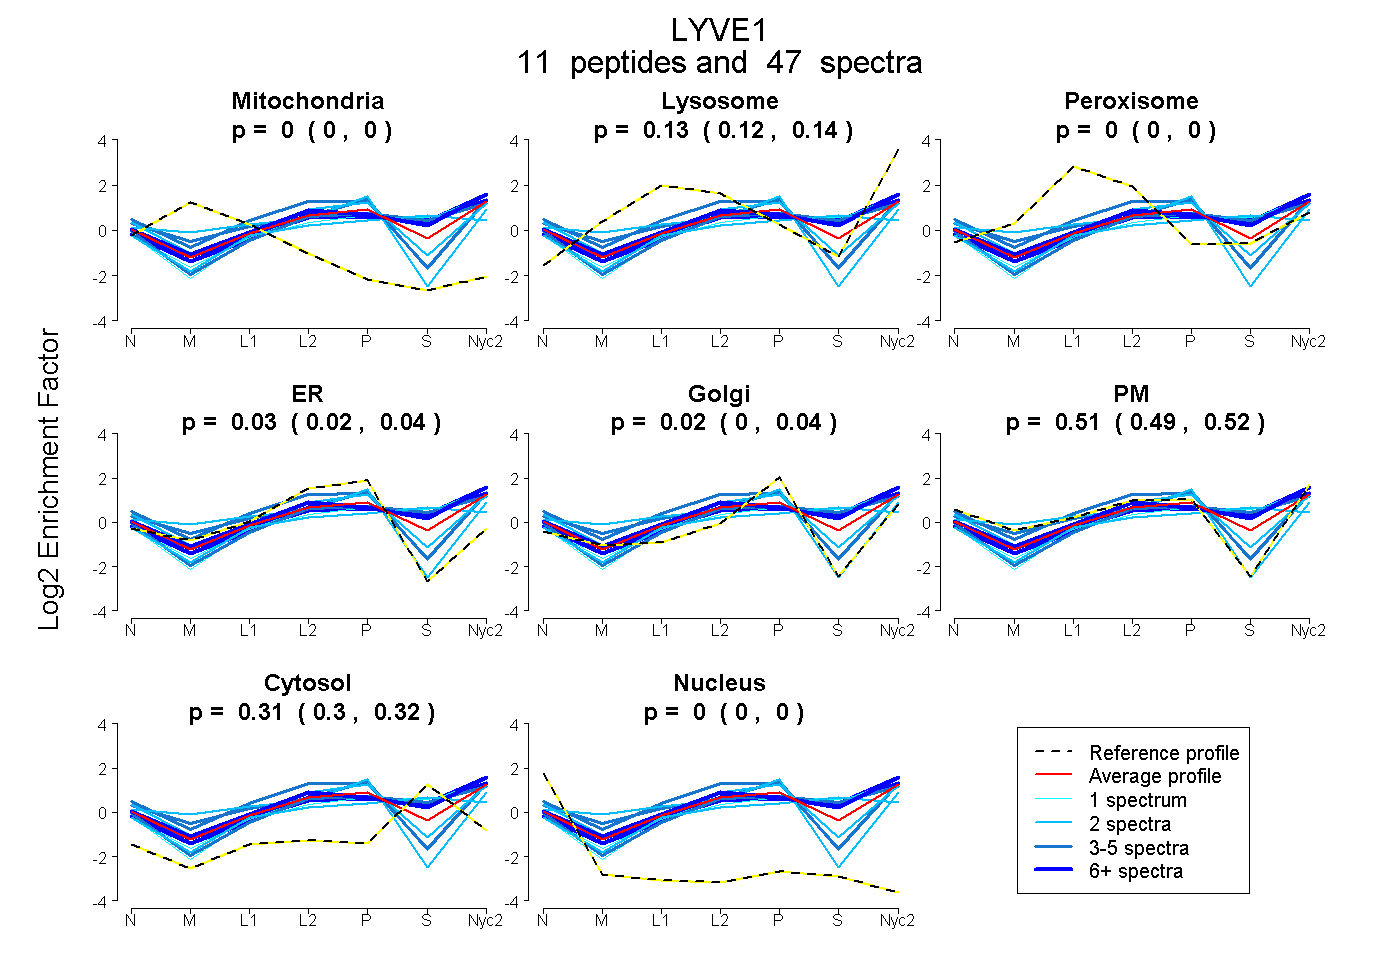
| Expt A |
11 peptides |
47 spectra |
|
0.000 0.000 | 0.000 |
0.132 0.122 | 0.140 |
0.000 0.000 | 0.000 |
0.031 0.017 | 0.043 |
0.020 0.001 | 0.036 |
0.510 0.490 | 0.524 |
0.308 0.297 | 0.317 |
0.000 0.000 | 0.000 |
| 9 spectra, VLGLTLASR | 0.000 | 0.243 | 0.000 | 0.000 | 0.000 | 0.421 | 0.336 | 0.000 | ||
| 2 spectra, NSEEPK | 0.000 | 0.032 | 0.000 | 0.117 | 0.020 | 0.650 | 0.181 | 0.000 | ||
| 2 spectra, SGFETCSYGWVGER | 0.000 | 0.034 | 0.102 | 0.051 | 0.000 | 0.285 | 0.529 | 0.000 | ||
| 3 spectra, NQVESAQK | 0.000 | 0.113 | 0.000 | 0.000 | 0.000 | 0.435 | 0.453 | 0.000 | ||
| 13 spectra, IMGVALVGR | 0.000 | 0.196 | 0.000 | 0.000 | 0.000 | 0.385 | 0.420 | 0.000 | ||
| 1 spectrum, ISPNPK | 0.000 | 0.233 | 0.000 | 0.000 | 0.043 | 0.315 | 0.410 | 0.000 | ||
| 1 spectrum, GVLIWNASPSQK | 0.000 | 0.148 | 0.000 | 0.000 | 0.034 | 0.325 | 0.493 | 0.000 | ||
| 3 spectra, AFPFTNK | 0.000 | 0.009 | 0.115 | 0.000 | 0.305 | 0.534 | 0.037 | 0.000 | ||
| 8 spectra, FSVIPR | 0.000 | 0.254 | 0.000 | 0.000 | 0.000 | 0.353 | 0.393 | 0.000 | ||
| 3 spectra, CLEAEV | 0.000 | 0.017 | 0.091 | 0.150 | 0.000 | 0.693 | 0.049 | 0.000 | ||
| 2 spectra, EMIETK | 0.073 | 0.040 | 0.000 | 0.182 | 0.214 | 0.491 | 0.000 | 0.000 |
| Plot | Mito | Lyso or Perox | ER | Golgi | PM | Cytosol | Nucleus | ||||||
| Expt B |
5 peptides |
8 spectra |
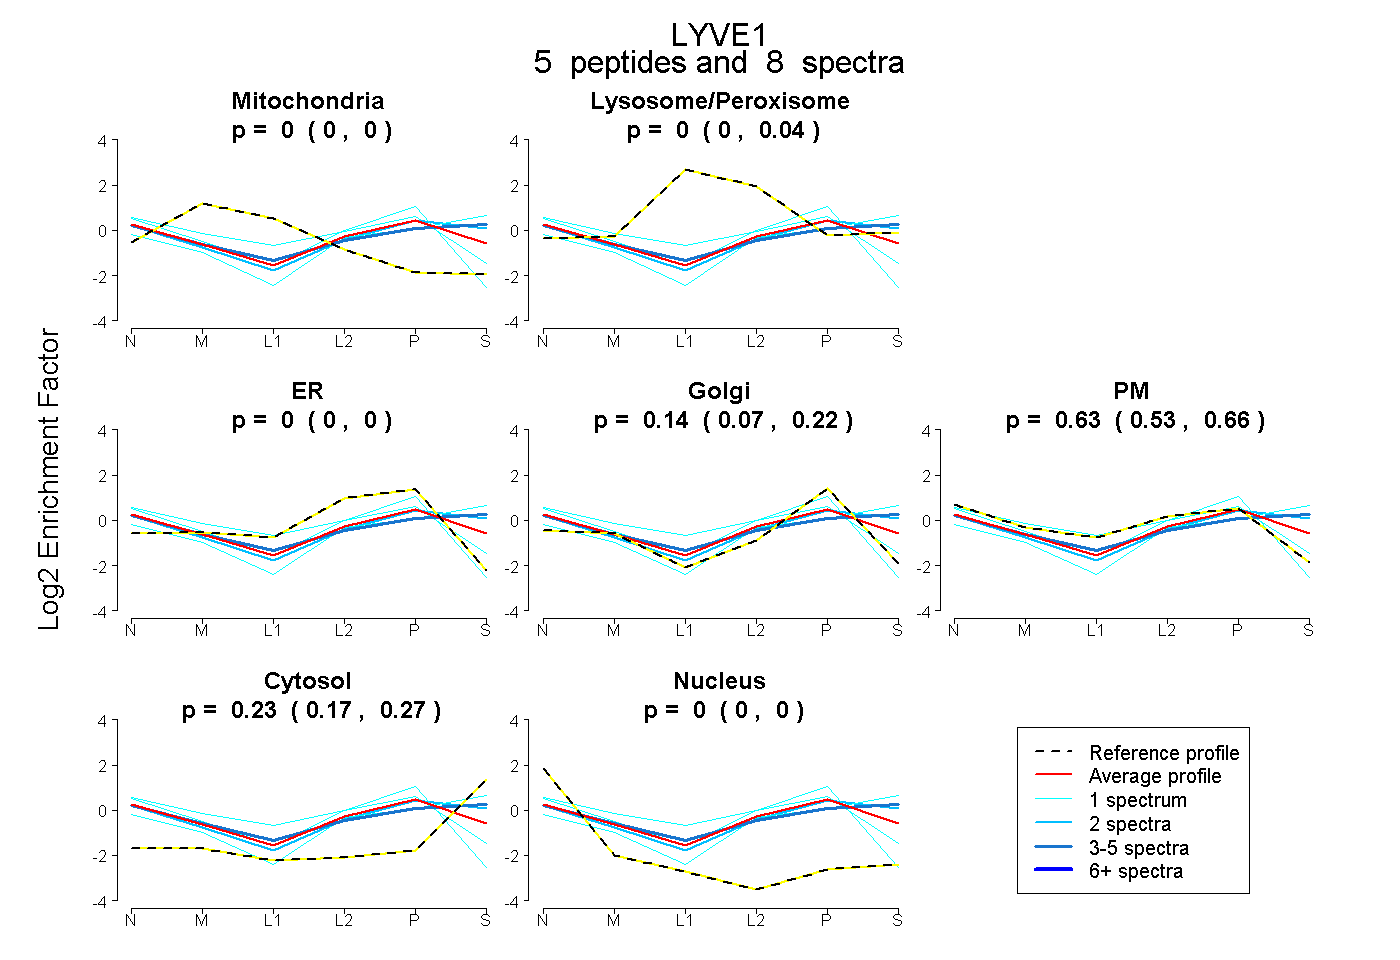 |
0.000 0.000 | 0.000 |
0.000 0.000 | 0.041 |
0.000 0.000 | 0.000 |
0.137 0.074 | 0.223 |
0.630 0.531 | 0.664 |
0.233 0.173 | 0.274 |
0.000 0.000 | 0.000 |
|||
| Plot | Lyso | Other | |||||||||||
| Expt C |
11 peptides |
77 spectra |
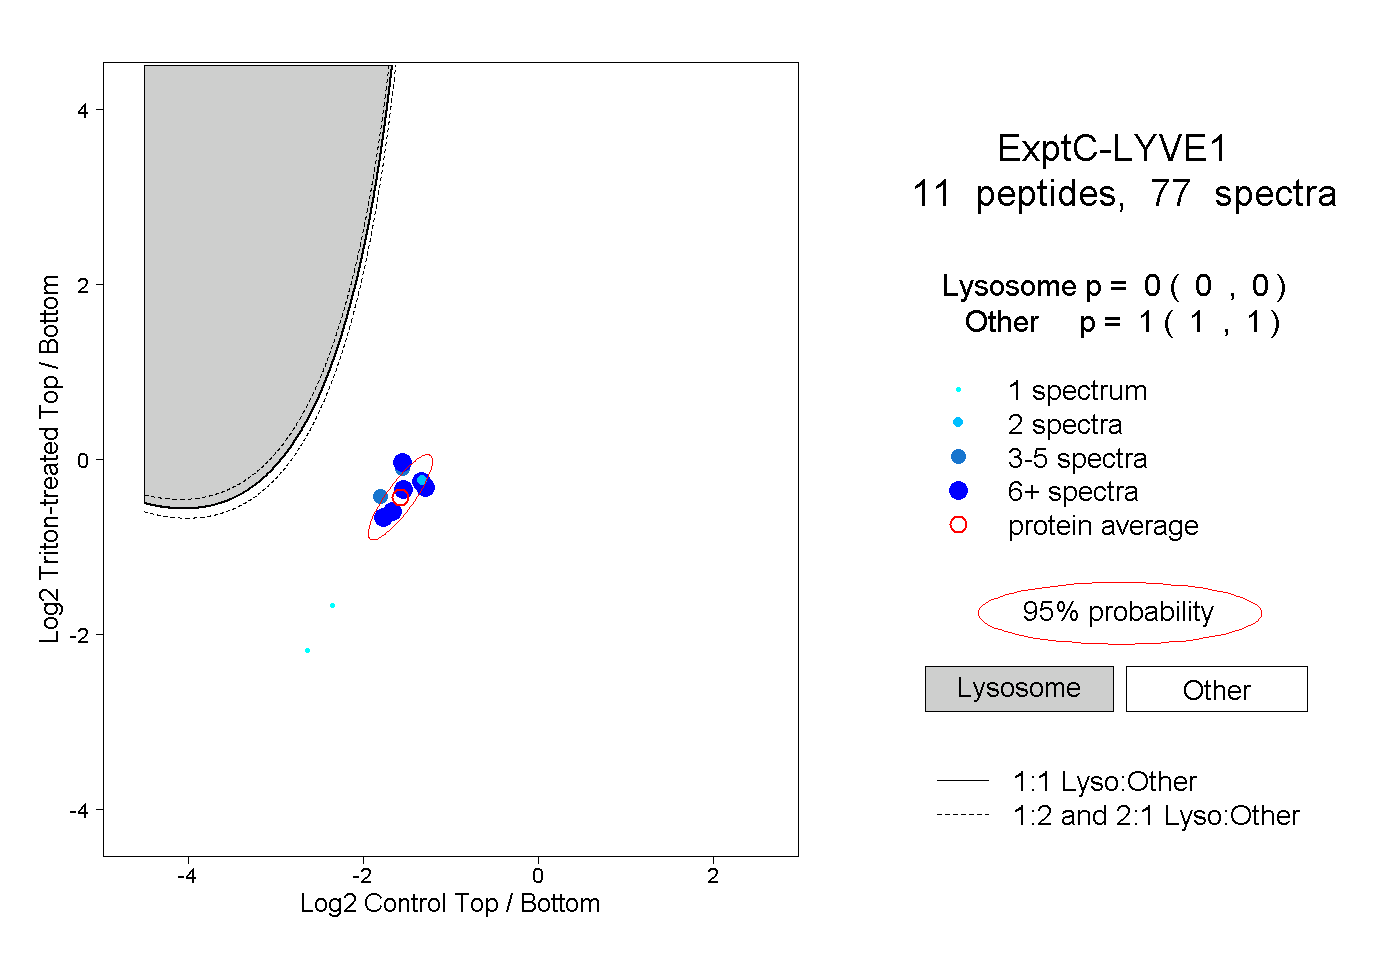 |
0.000 0.000 | 0.000 |
1.000 1.000 | 1.000 |
||||||||
| Plot | Lyso | Other | |||||||||||
| Expt D |
3 peptides |
5 spectra |
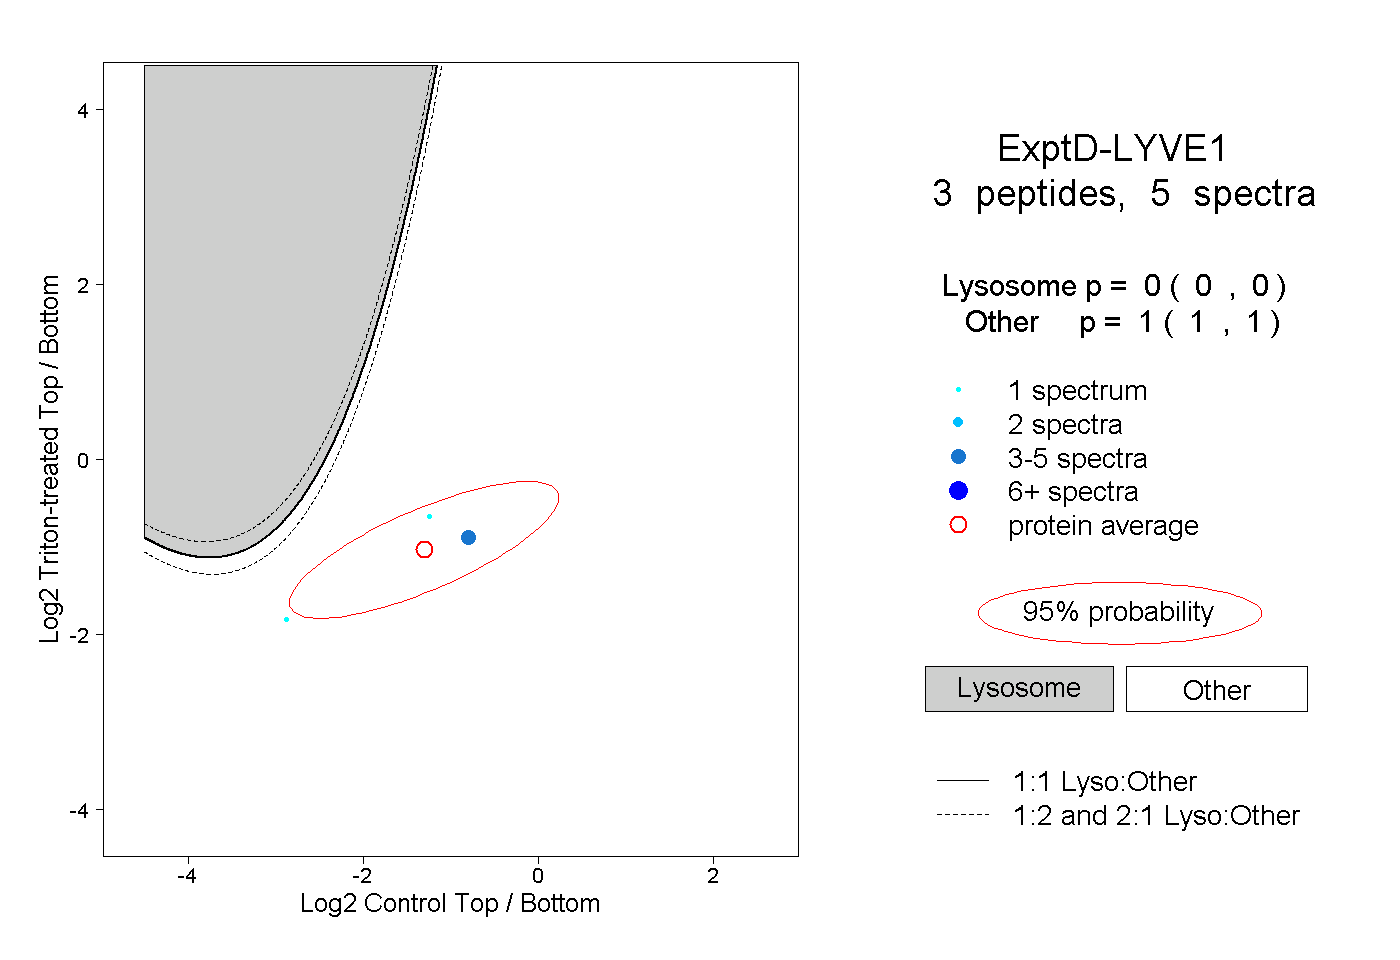 |
0.000 0.000 | 0.000 |
1.000 1.000 | 1.000 |