LYVE1
[ENSRNOP00000036731]
Main page
| | | Plot |
Mito |
Lyso |
|
Perox |
ER |
Golgi |
PM |
Cytosol |
Nucleus |
|
| Expt A |
 11
11
peptides |
47
spectra |
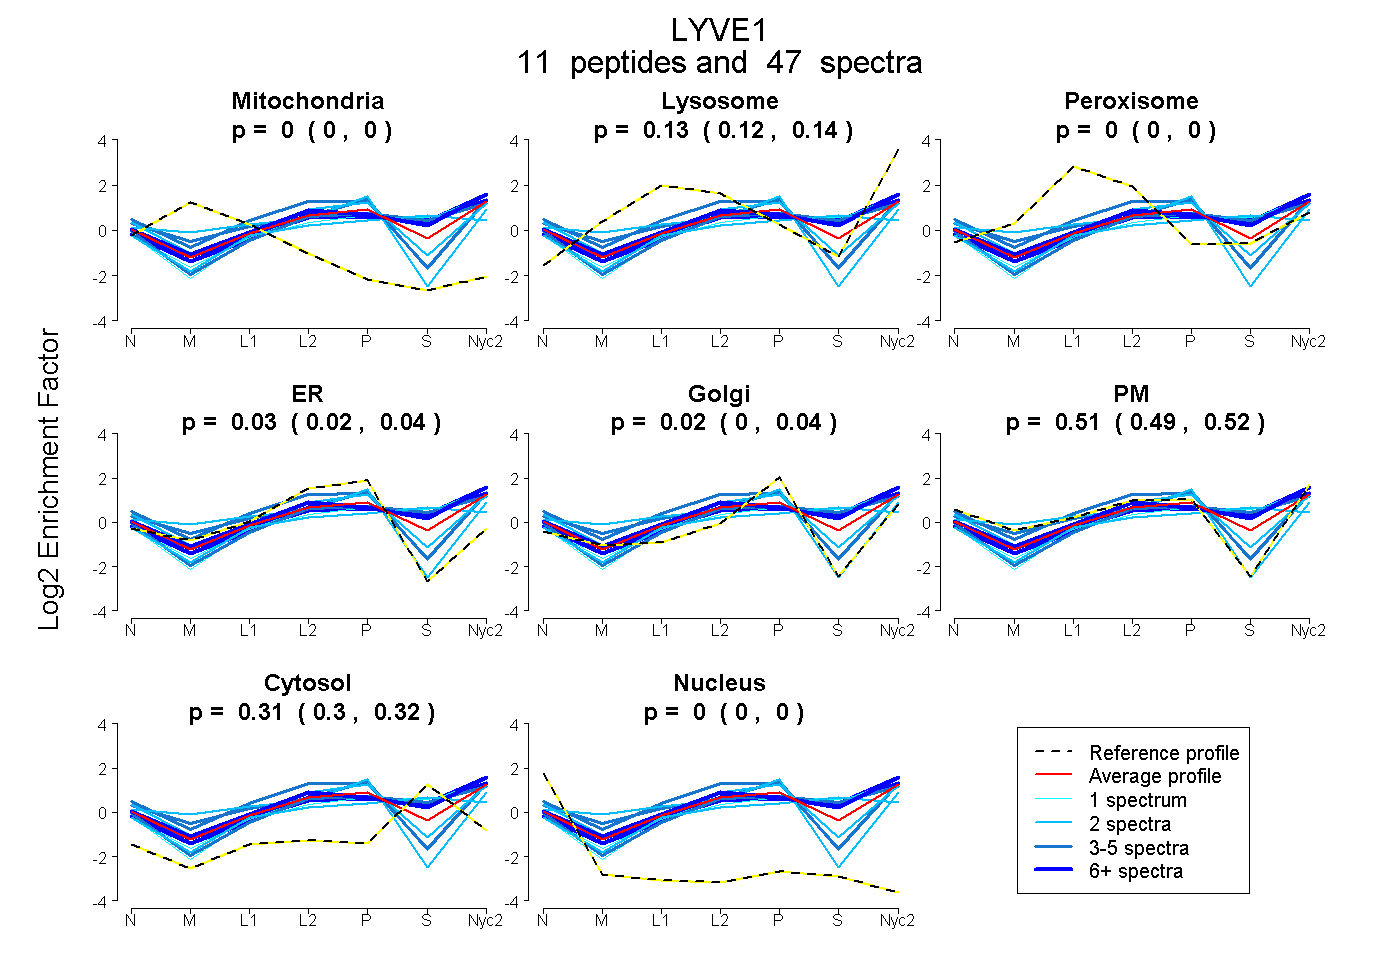 |
0.000
0.000 | 0.000 |
0.132
0.122 | 0.140 |
|
0.000
0.000 | 0.000 |
0.031
0.017 | 0.043 |
0.020
0.001 | 0.036 |
0.510
0.490 | 0.524 |
0.308
0.297 | 0.317 |
0.000
0.000 | 0.000 |
|
| | | Plot |
Mito |
|
Lyso or Perox |
|
ER |
Golgi |
PM |
Cytosol |
Nucleus |
|
| Expt B |
5
peptides |
8
spectra |
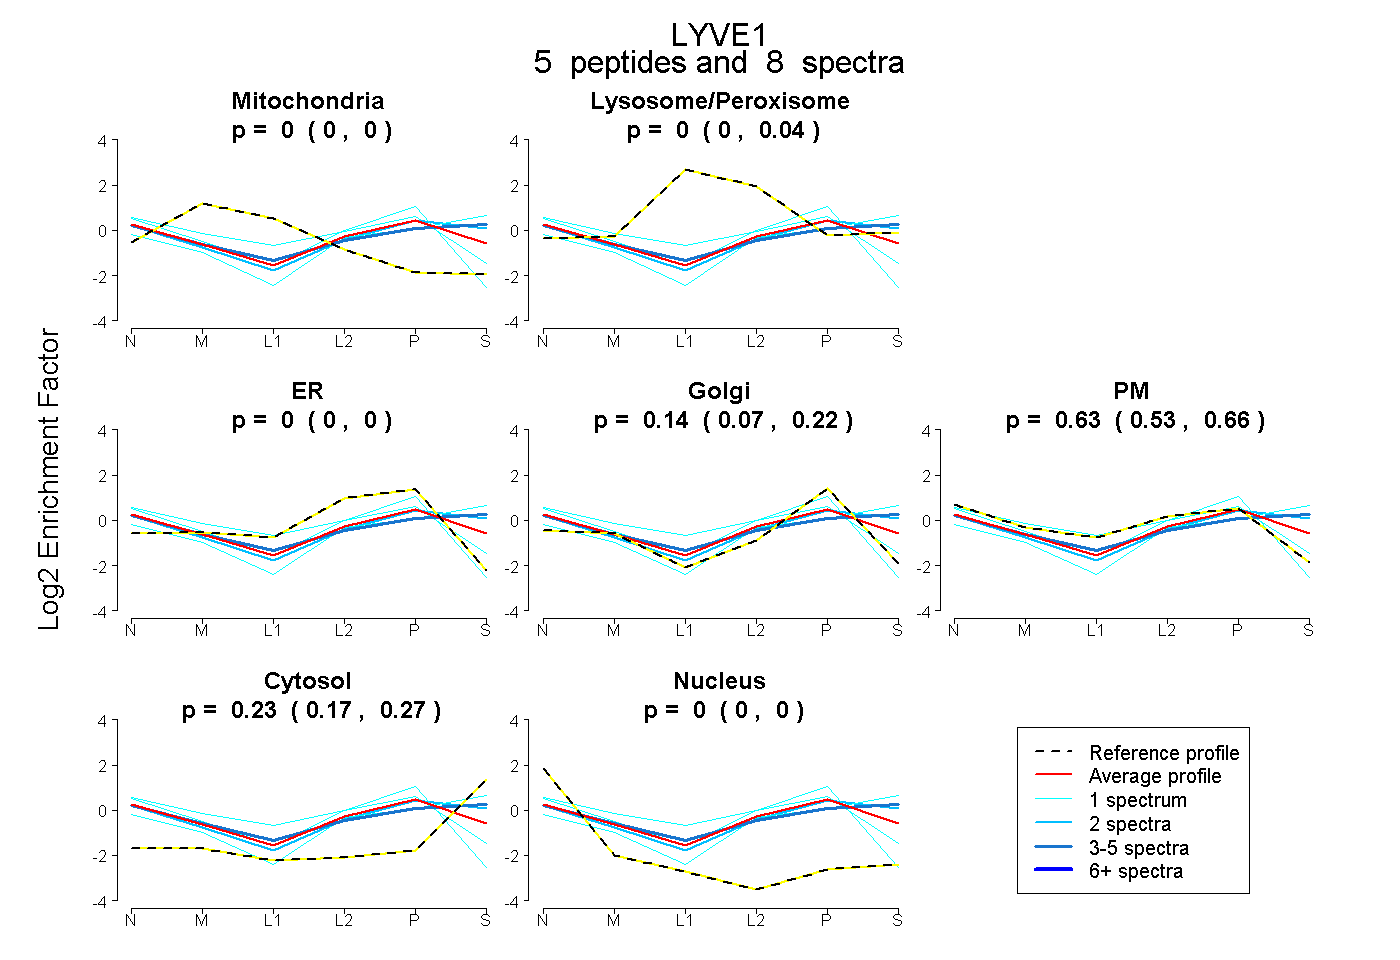 |
0.000
0.000 | 0.000 |
|
0.000
0.000 | 0.041 |
|
0.000
0.000 | 0.000 |
0.137
0.074 | 0.223 |
0.630
0.531 | 0.664 |
0.233
0.173 | 0.274 |
0.000
0.000 | 0.000 |
|
| 3 spectra, VLGLTLASR |
0.000 |
|
0.065 |
|
0.000 |
0.000 |
0.554 |
0.381 |
0.000 |
|
| 1 spectrum, NSEEPK |
0.000 |
|
0.000 |
|
0.181 |
0.313 |
0.469 |
0.000 |
0.037 |
|
| 2 spectra, FSVIPR |
0.000 |
|
0.000 |
|
0.000 |
0.129 |
0.528 |
0.343 |
0.000 |
|
| 1 spectrum, AFPFTNK |
0.008 |
|
0.072 |
|
0.000 |
0.099 |
0.793 |
0.028 |
0.000 |
|
| 1 spectrum, IMGVALVGR |
0.000 |
|
0.000 |
|
0.061 |
0.141 |
0.305 |
0.493 |
0.000 |
|
| | | Plot |
|
Lyso |
|
|
|
|
|
|
|
Other |
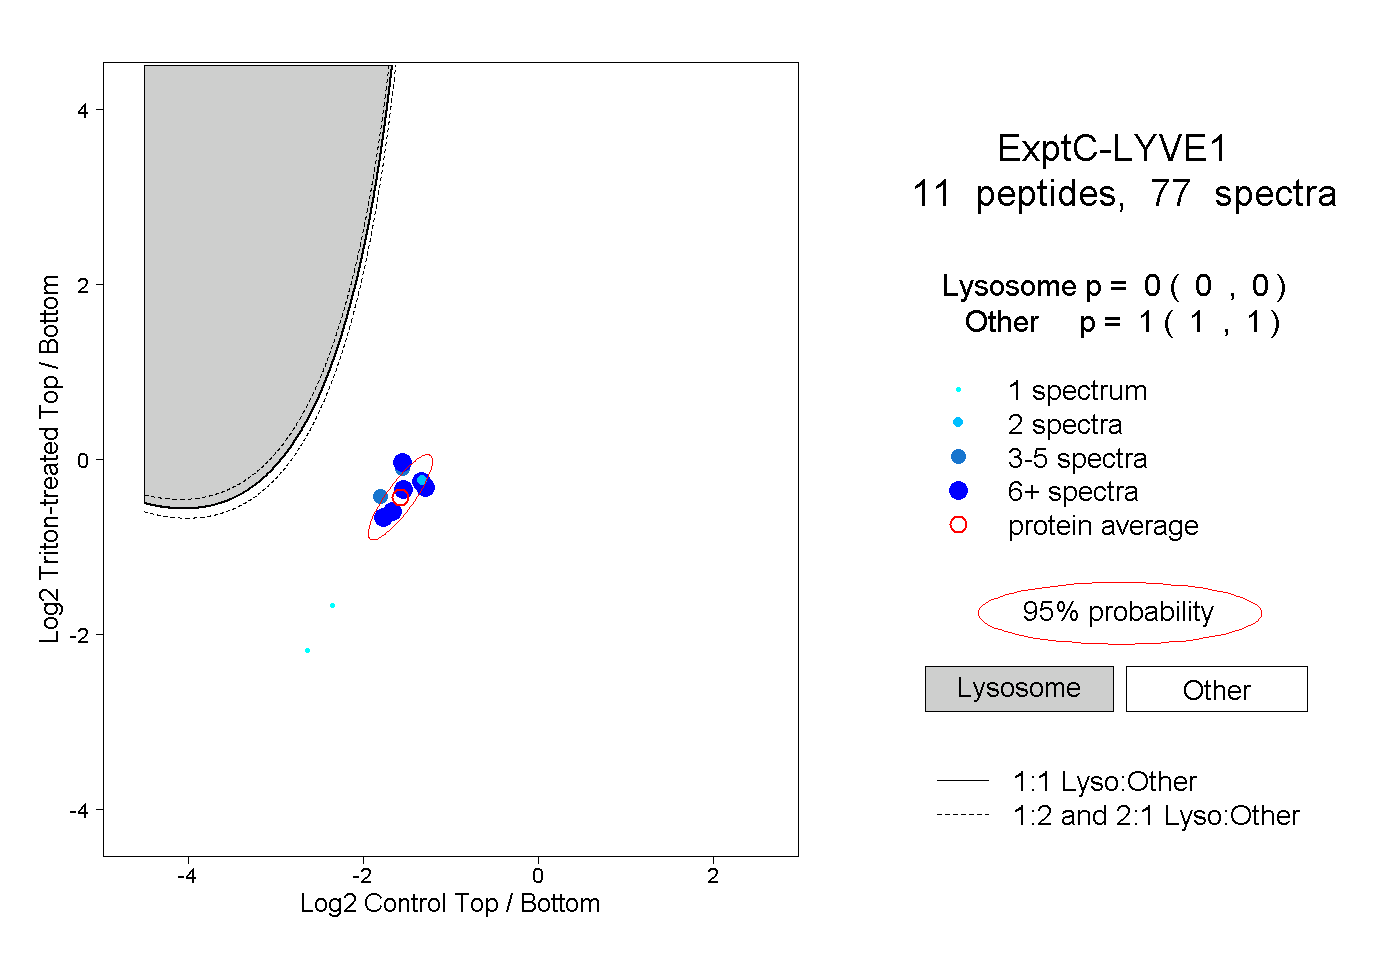
| Expt C |
11
peptides |
77
spectra |
 |
|
0.000
0.000 | 0.000 |
|
|
|
|
|
|
|
1.000
1.000 | 1.000 |
| | | Plot |
|
Lyso |
|
|
|
|
|
|
|
Other |
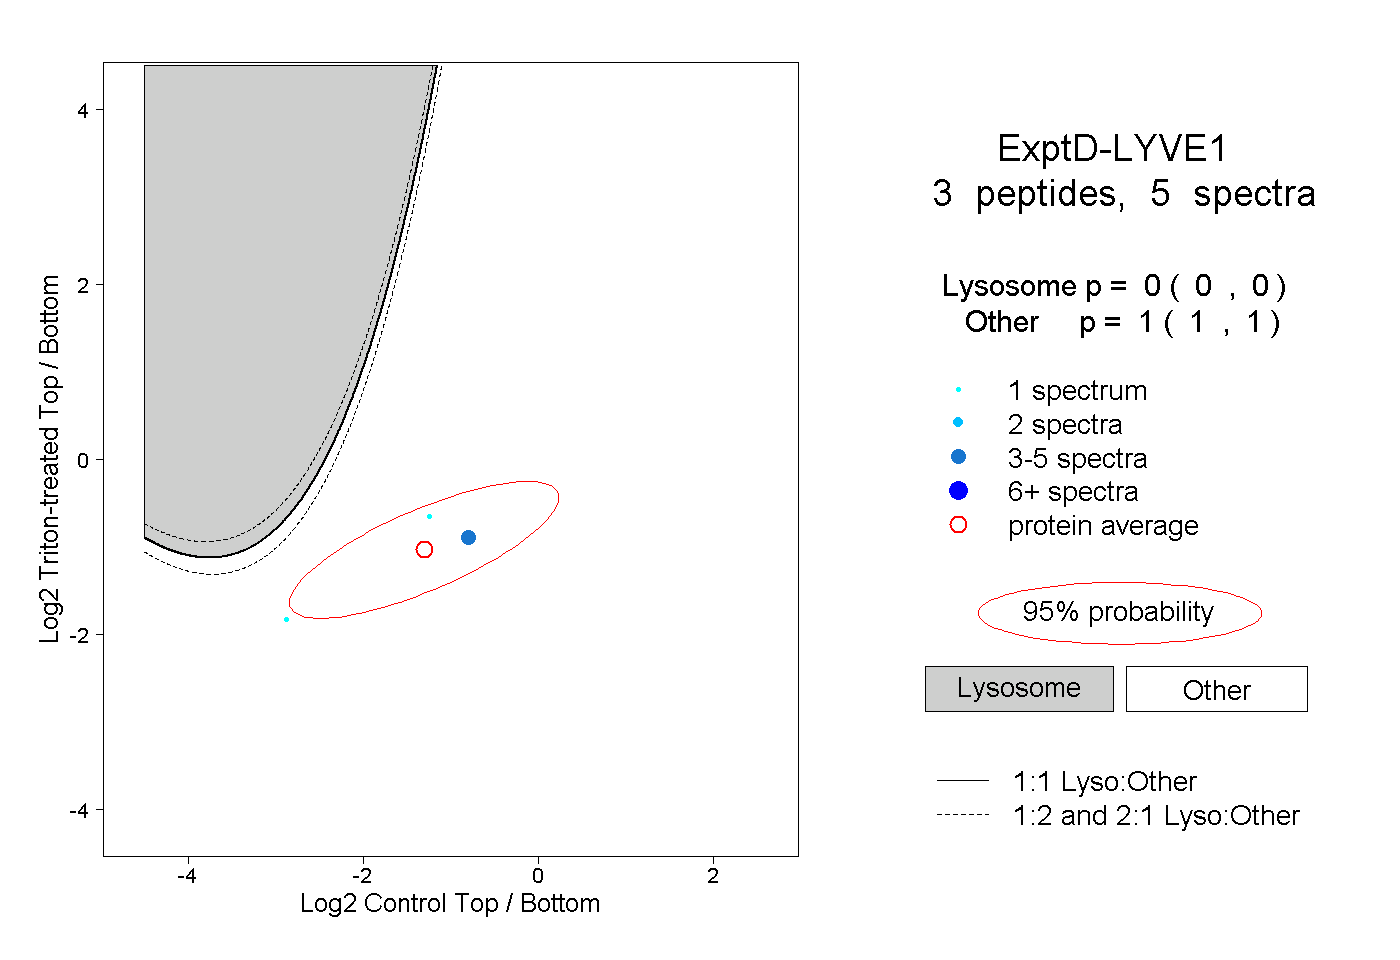
| Expt D |
3
peptides |
5
spectra |
 |
|
0.000
0.000 | 0.000 |
|
|
|
|
|
|
|
1.000
1.000 | 1.000 |