 19
19peptides
spectra
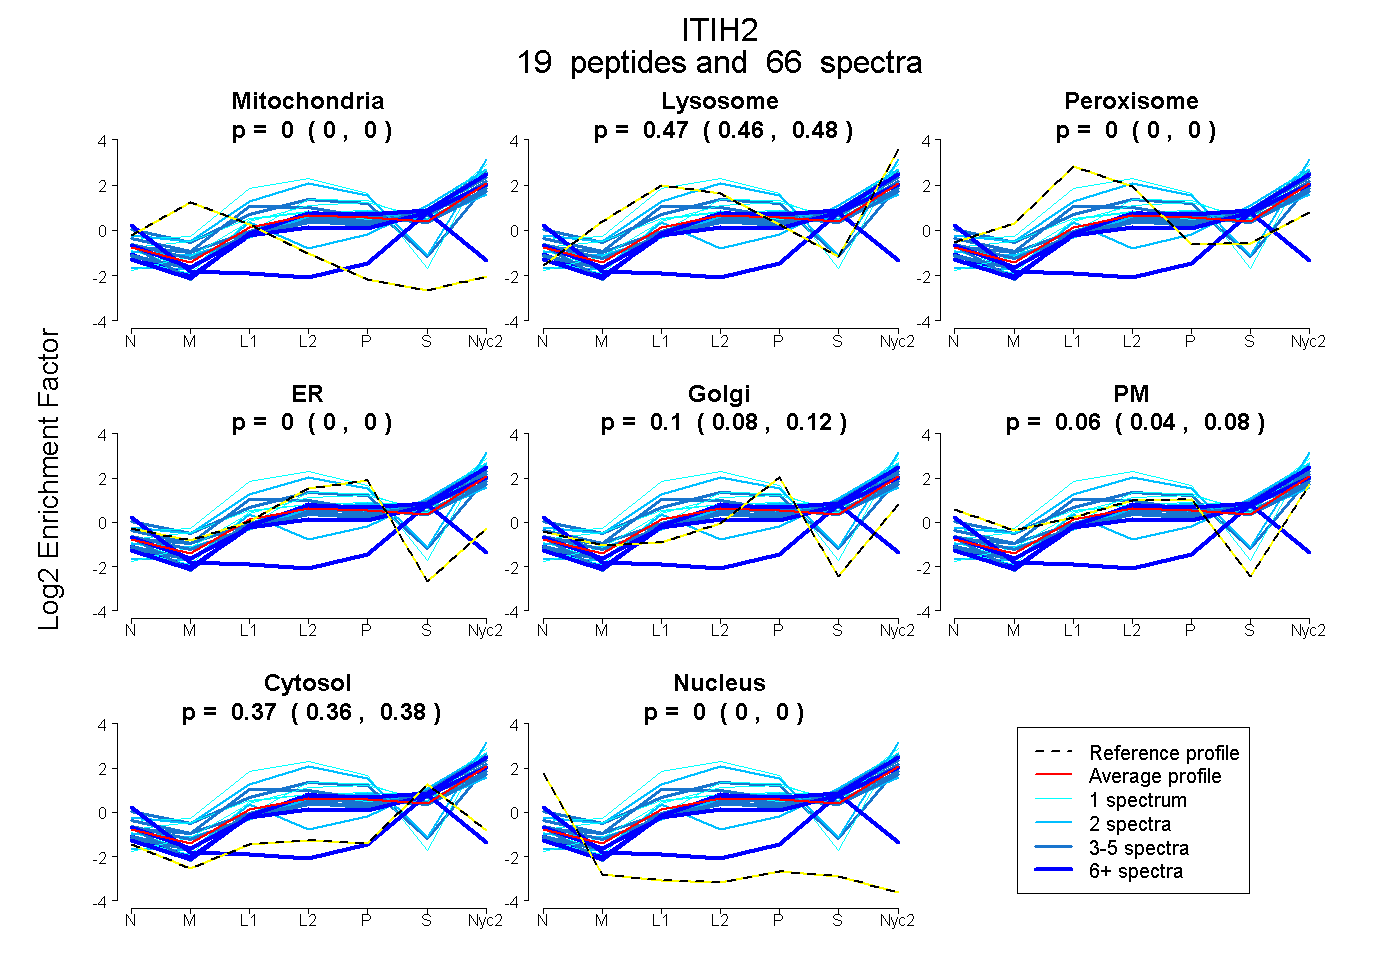
0.000 | 0.000
0.459 | 0.479
0.000 | 0.000
0.000 | 0.000
0.079 | 0.115
0.042 | 0.081
0.361 | 0.376
0.000 | 0.000
7peptides
spectra
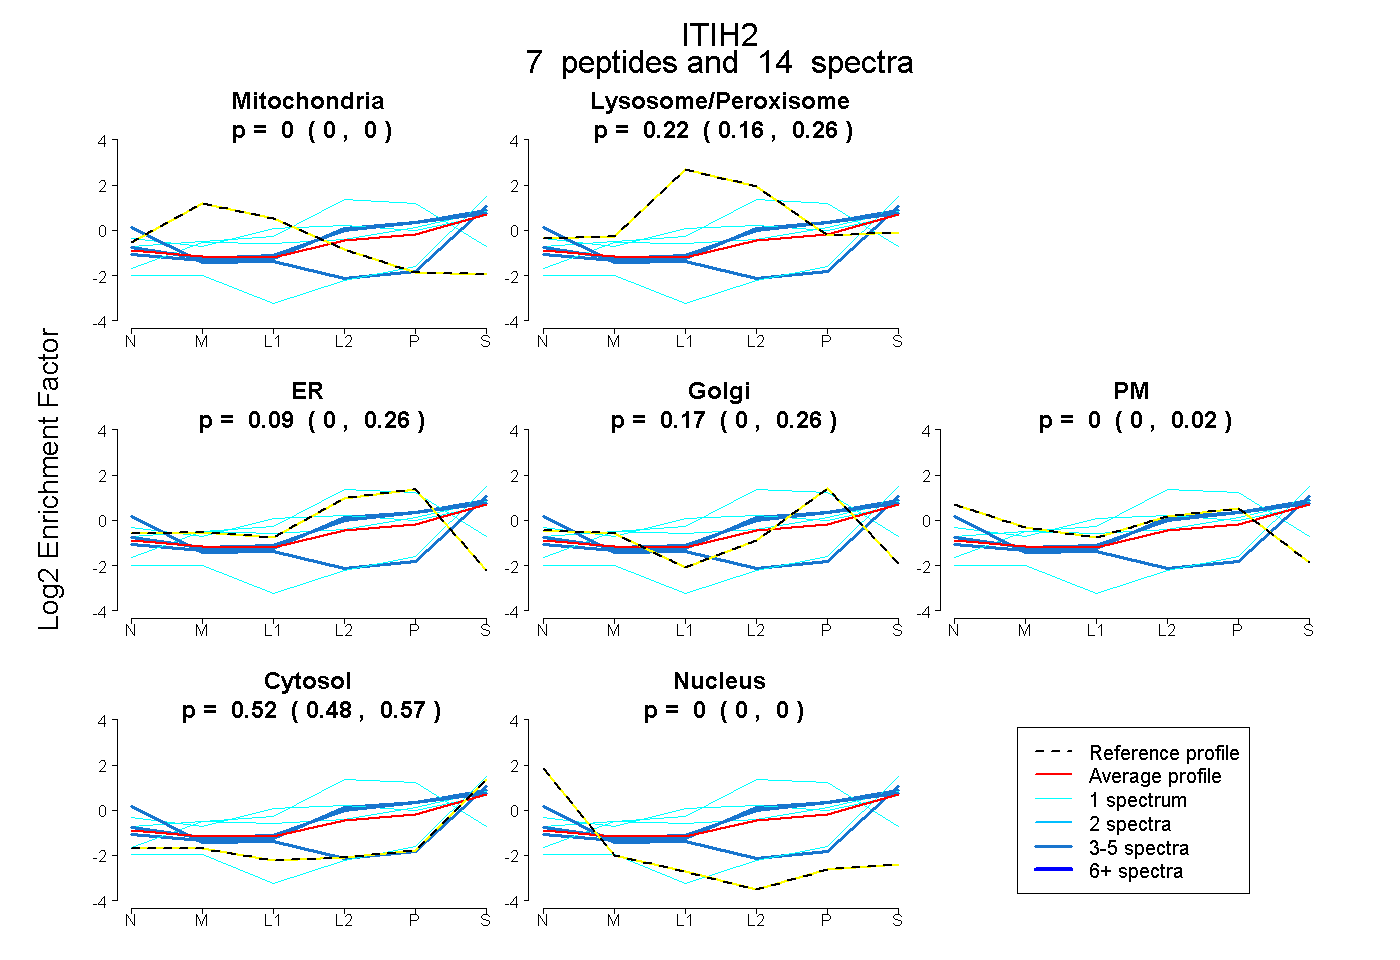
0.000 | 0.000
0.165 | 0.261
0.000 | 0.257
0.000 | 0.264
0.000 | 0.018
0.479 | 0.566
0.000 | 0.000
27peptides
spectra
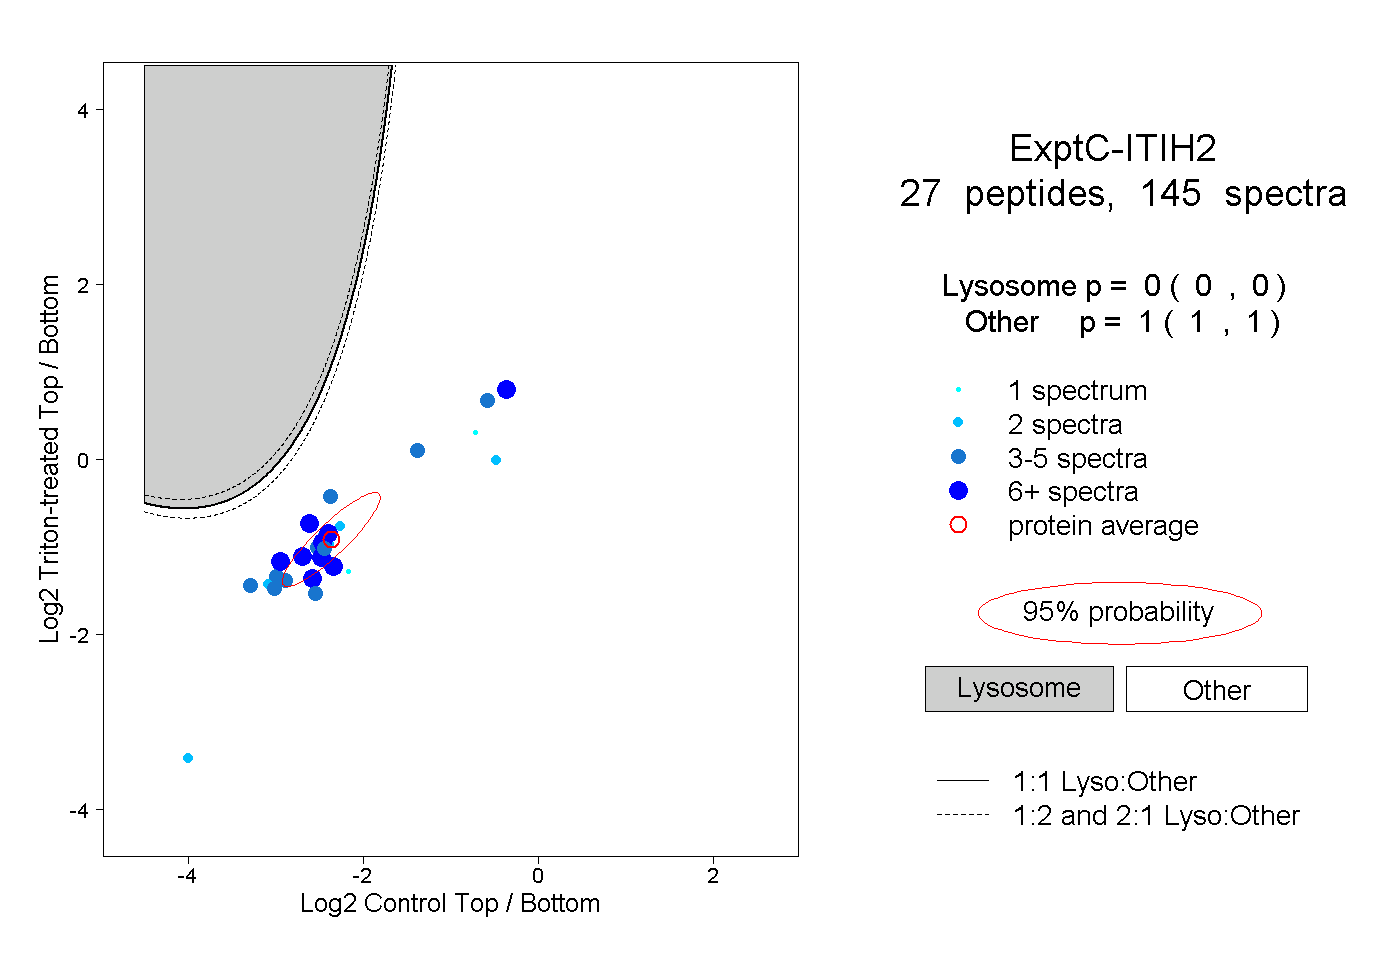
0.000 | 0.000
1.000 | 1.000
10peptides
spectra
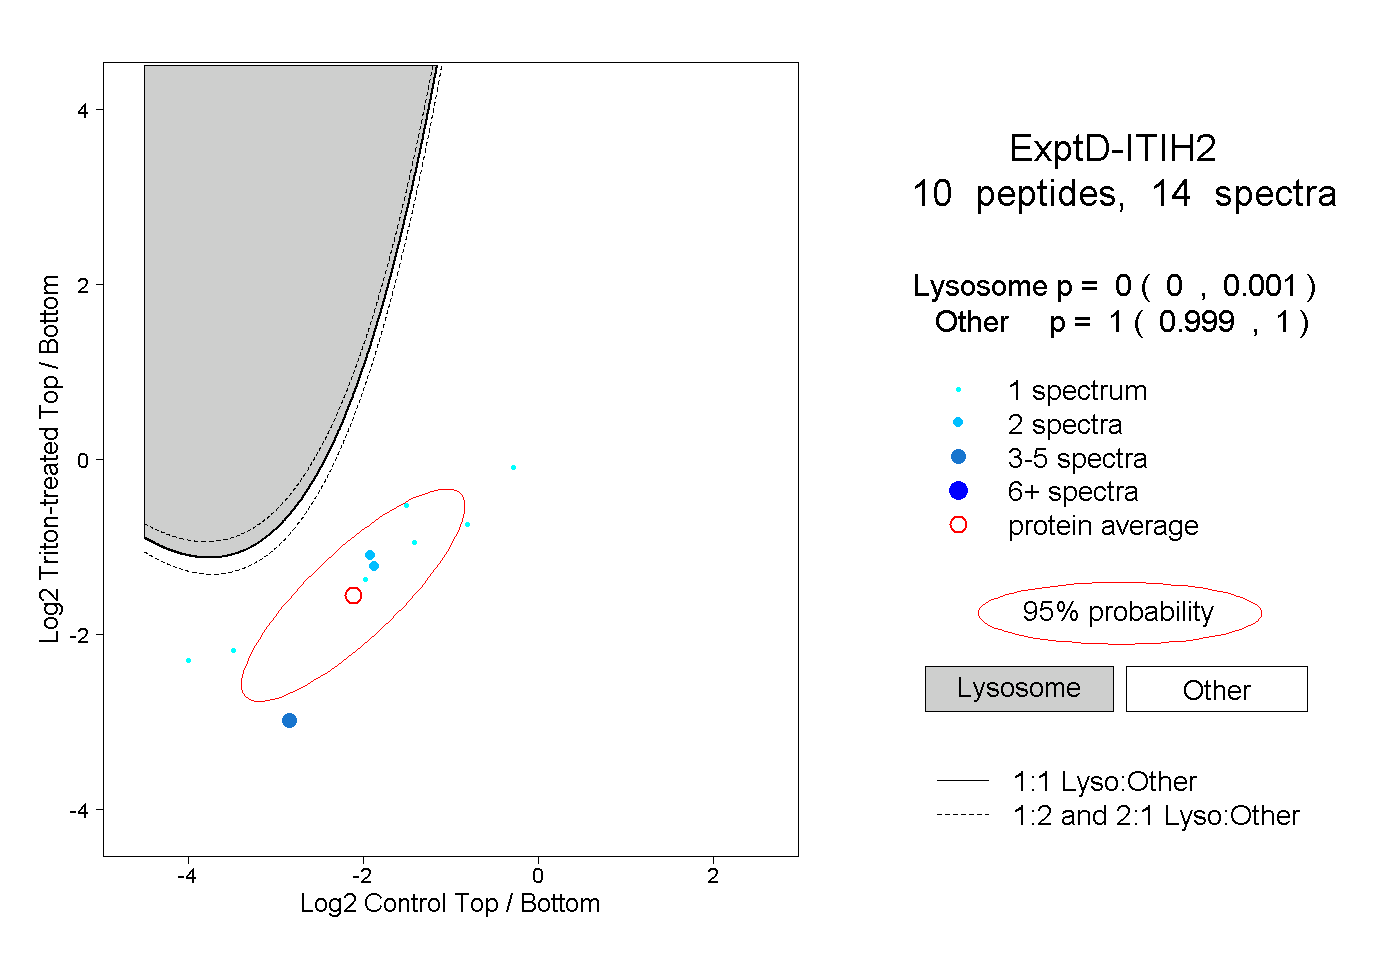
0.000 | 0.001
0.999 | 1.000