 19
19peptides
spectra
0.000 | 0.000
0.459 | 0.479
0.000 | 0.000
0.000 | 0.000
0.079 | 0.115
0.042 | 0.081
0.361 | 0.376
0.000 | 0.000
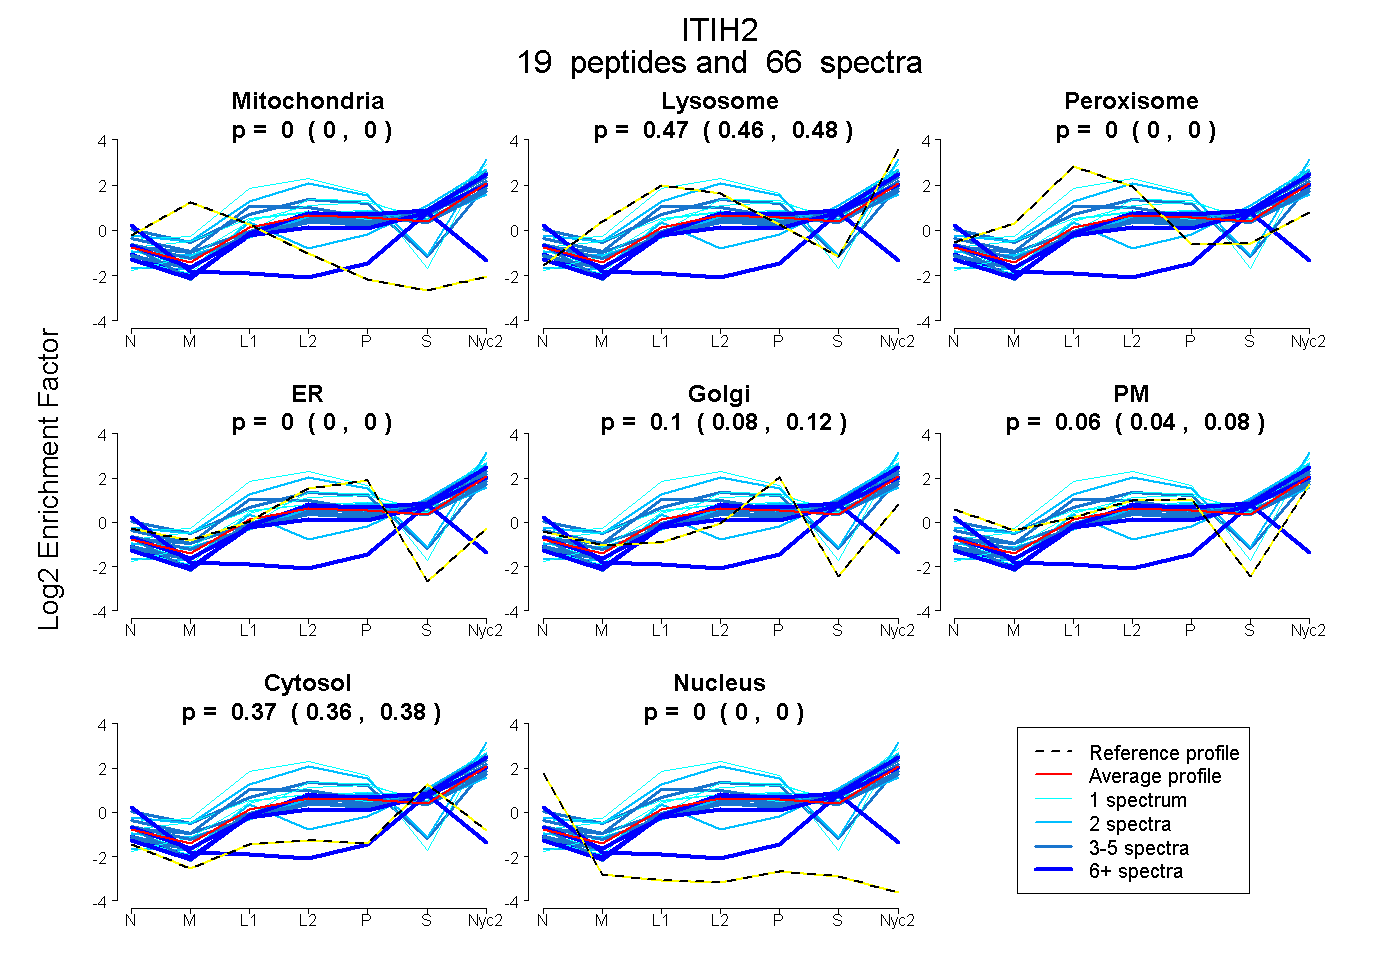
| Plot | Mito | Lyso | Perox | ER | Golgi | PM | Cytosol | Nucleus | |||||
| Expt A |
19 peptides |
66 spectra |
|
0.000 0.000 | 0.000 |
0.470 0.459 | 0.479 |
0.000 0.000 | 0.000 |
0.000 0.000 | 0.000 |
0.098 0.079 | 0.115 |
0.063 0.042 | 0.081 |
0.369 0.361 | 0.376 |
0.000 0.000 | 0.000 |
| 7 spectra, VQFELHYQEVK | 0.000 | 0.406 | 0.000 | 0.000 | 0.000 | 0.097 | 0.497 | 0.000 | ||
| 1 spectrum, IHLQPGK | 0.000 | 0.469 | 0.000 | 0.000 | 0.259 | 0.000 | 0.272 | 0.000 | ||
| 3 spectra, GFIDGHYK | 0.000 | 0.296 | 0.027 | 0.095 | 0.000 | 0.519 | 0.064 | 0.000 | ||
| 2 spectra, MATTTIQSK | 0.000 | 0.397 | 0.000 | 0.000 | 0.235 | 0.000 | 0.368 | 0.000 | ||
| 4 spectra, TEDQFSVVDFNHNVR | 0.000 | 0.432 | 0.000 | 0.000 | 0.028 | 0.116 | 0.425 | 0.000 | ||
| 1 spectrum, LGFYFQK | 0.000 | 0.658 | 0.000 | 0.154 | 0.000 | 0.188 | 0.000 | 0.000 | ||
| 9 spectra, ALYSQAR | 0.000 | 0.456 | 0.000 | 0.000 | 0.085 | 0.000 | 0.459 | 0.000 | ||
| 2 spectra, AHVSFKPTVAQQR | 0.000 | 0.492 | 0.000 | 0.000 | 0.000 | 0.000 | 0.508 | 0.000 | ||
| 2 spectra, LSWSDTAR | 0.000 | 0.580 | 0.000 | 0.034 | 0.000 | 0.387 | 0.000 | 0.000 | ||
| 6 spectra, VQSTITSR | 0.000 | 0.498 | 0.000 | 0.000 | 0.069 | 0.000 | 0.432 | 0.000 | ||
| 4 spectra, QTVEAMK | 0.000 | 0.351 | 0.198 | 0.000 | 0.000 | 0.179 | 0.272 | 0.000 | ||
| 3 spectra, LSNENR | 0.000 | 0.503 | 0.000 | 0.000 | 0.054 | 0.000 | 0.443 | 0.000 | ||
| 1 spectrum, SLSEDSGEEMDSVDPVTLYSYK | 0.000 | 0.627 | 0.000 | 0.000 | 0.096 | 0.000 | 0.277 | 0.000 | ||
| 5 spectra, SLAPTAASK | 0.000 | 0.355 | 0.000 | 0.000 | 0.000 | 0.120 | 0.525 | 0.000 | ||
| 1 spectrum, FLHVPDTFEGHFQGVPVISK | 0.000 | 0.615 | 0.000 | 0.000 | 0.032 | 0.000 | 0.353 | 0.000 | ||
| 1 spectrum, NDLVSATK | 0.000 | 0.640 | 0.000 | 0.000 | 0.000 | 0.073 | 0.286 | 0.000 | ||
| 6 spectra, THPQTER | 0.028 | 0.000 | 0.000 | 0.000 | 0.000 | 0.021 | 0.716 | 0.234 | ||
| 5 spectra, FYNQVSTPLLR | 0.000 | 0.429 | 0.000 | 0.000 | 0.018 | 0.156 | 0.397 | 0.000 | ||
| 3 spectra, IQPSGGTNINEALLR | 0.000 | 0.544 | 0.000 | 0.000 | 0.000 | 0.000 | 0.456 | 0.000 |
| Plot | Mito | Lyso or Perox | ER | Golgi | PM | Cytosol | Nucleus | ||||||
| Expt B |
7 peptides |
14 spectra |
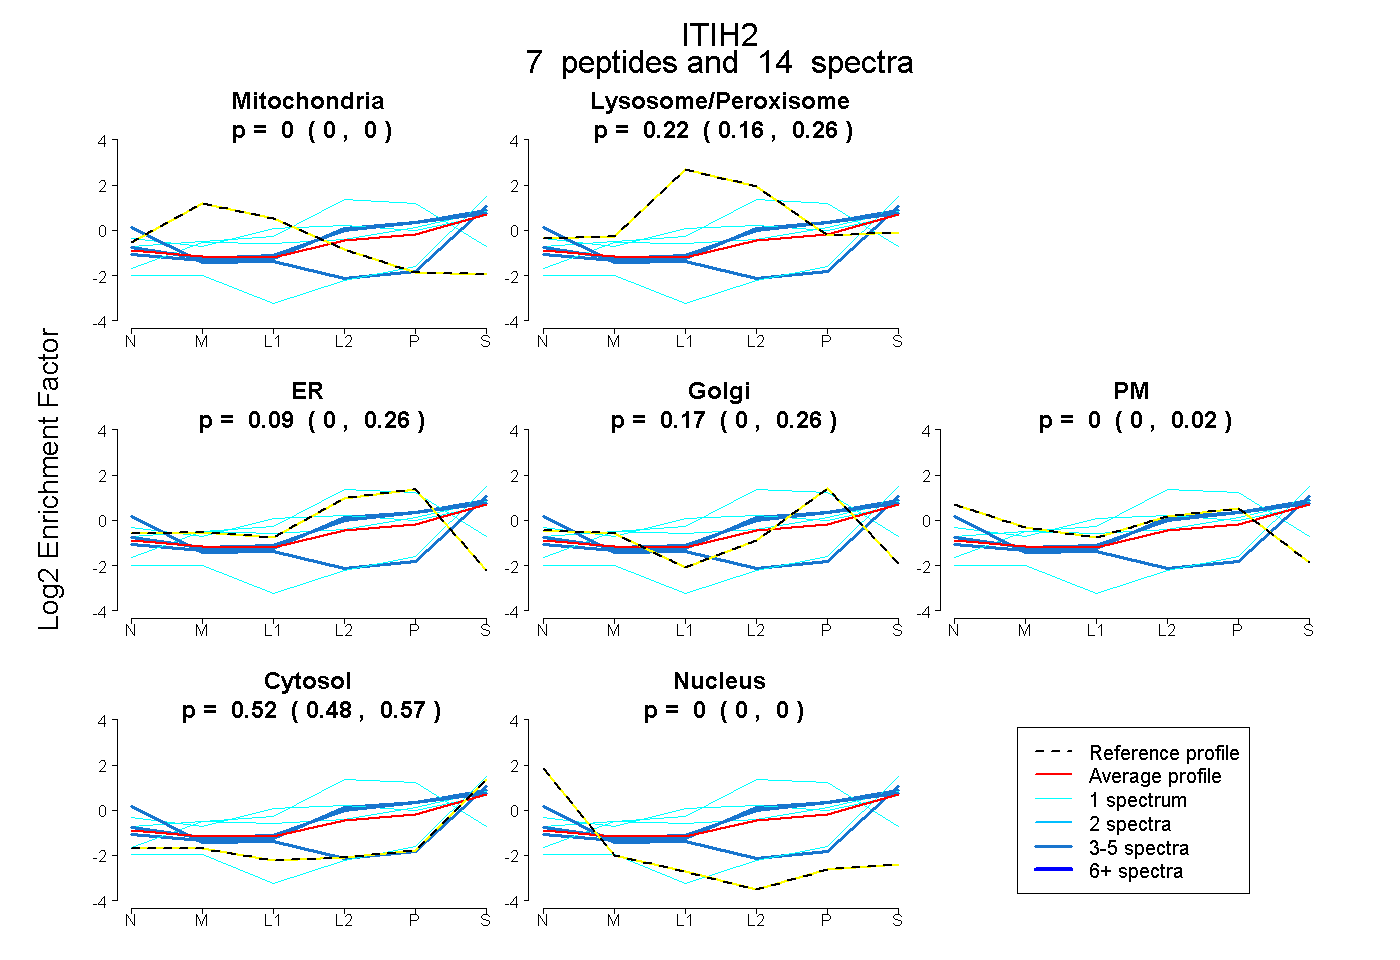 |
0.000 0.000 | 0.000 |
0.224 0.165 | 0.261 |
0.087 0.000 | 0.257 |
0.167 0.000 | 0.264 |
0.000 0.000 | 0.018 |
0.522 0.479 | 0.566 |
0.000 0.000 | 0.000 |
|||
| Plot | Lyso | Other | |||||||||||
| Expt C |
27 peptides |
145 spectra |
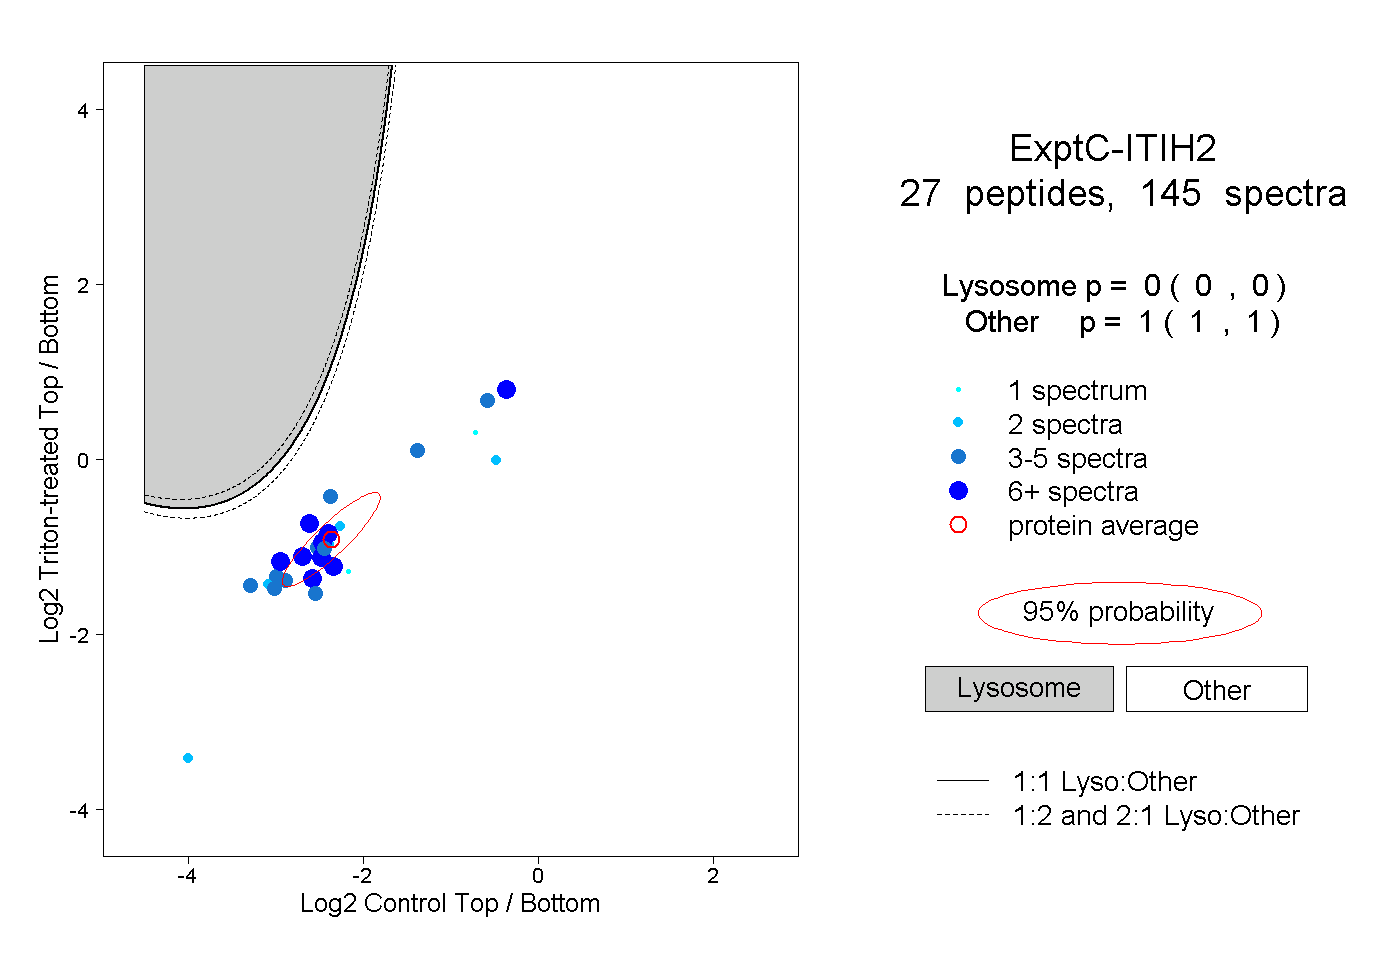 |
0.000 0.000 | 0.000 |
1.000 1.000 | 1.000 |
||||||||
| Plot | Lyso | Other | |||||||||||
| Expt D |
10 peptides |
14 spectra |
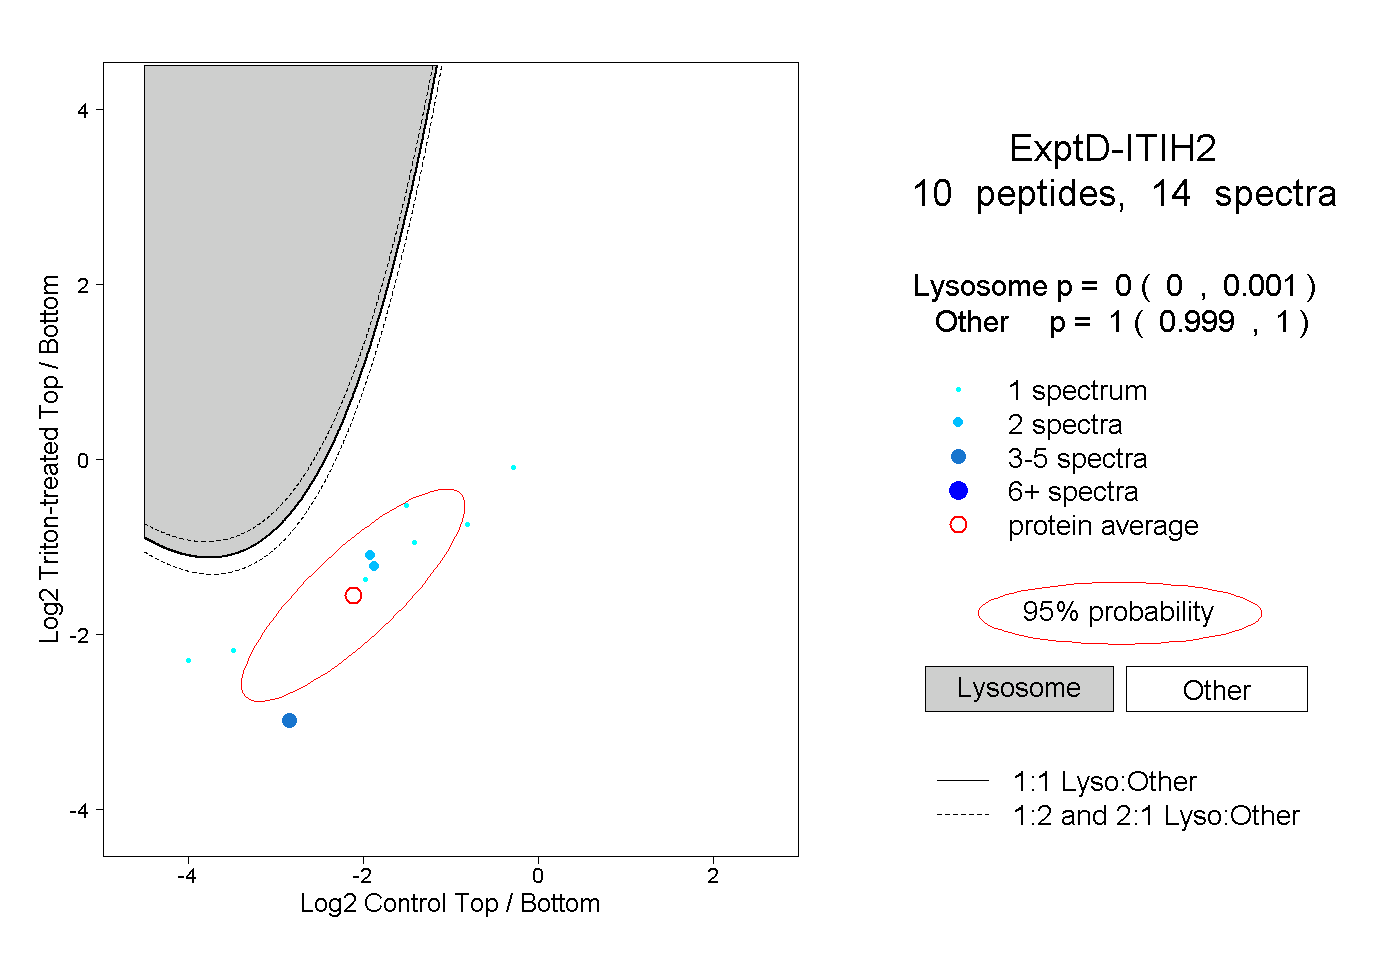 |
0.000 0.000 | 0.001 |
1.000 0.999 | 1.000 |