ITIH2
[ENSRNOP00000036443]
Main page
| | | Plot |
Mito |
Lyso |
|
Perox |
ER |
Golgi |
PM |
Cytosol |
Nucleus |
|
| Expt A |
 19
19
peptides |
66
spectra |
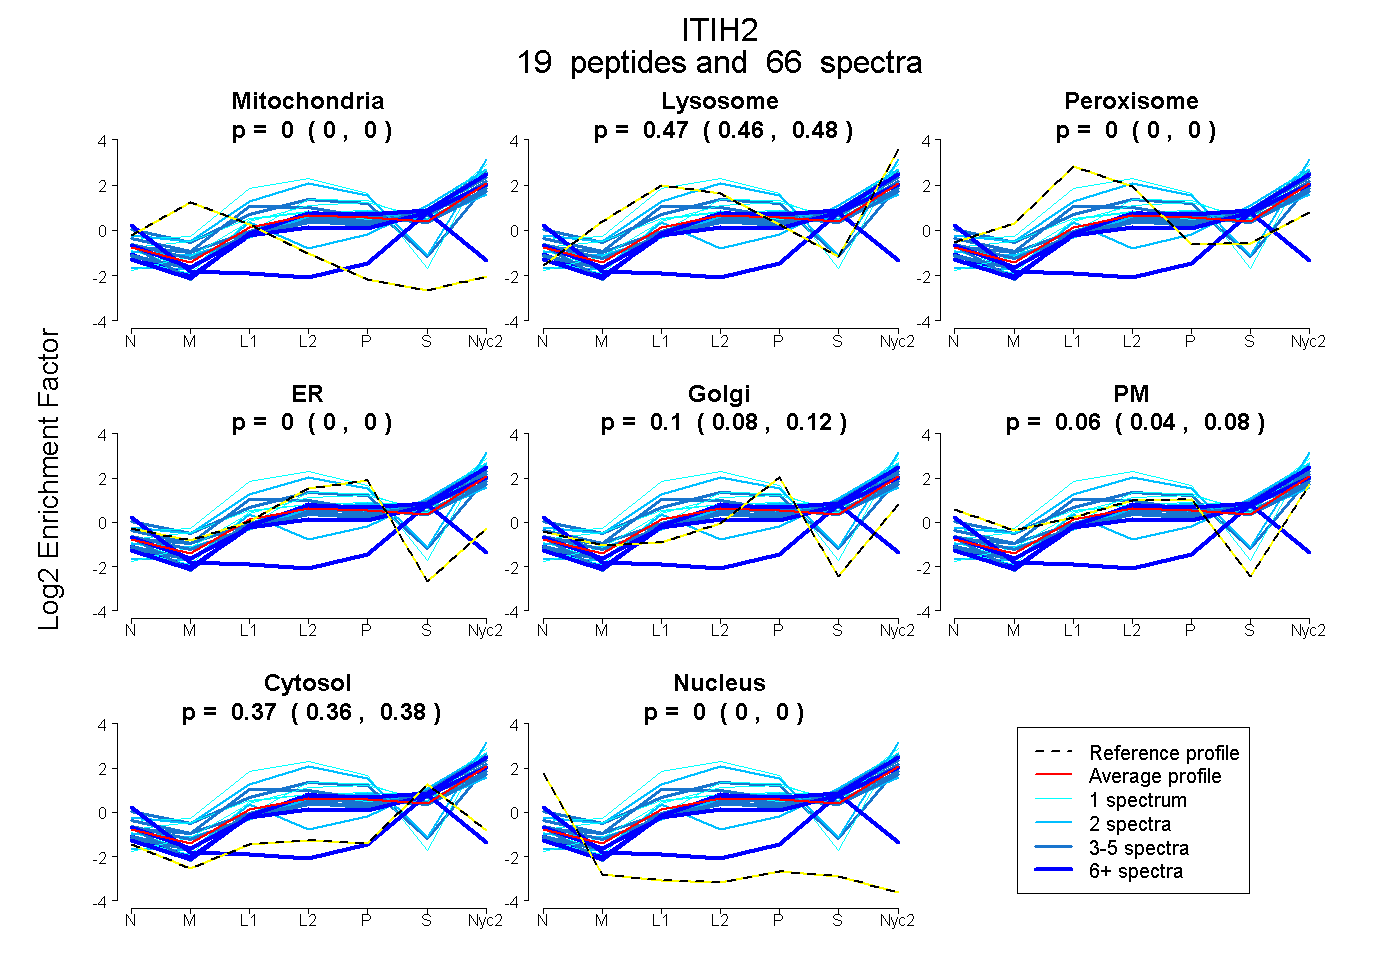 |
0.000
0.000 | 0.000 |
0.470
0.459 | 0.479 |
|
0.000
0.000 | 0.000 |
0.000
0.000 | 0.000 |
0.098
0.079 | 0.115 |
0.063
0.042 | 0.081 |
0.369
0.361 | 0.376 |
0.000
0.000 | 0.000 |
|
| | | Plot |
Mito |
|
Lyso or Perox |
|
ER |
Golgi |
PM |
Cytosol |
Nucleus |
|
| Expt B |
7
peptides |
14
spectra |
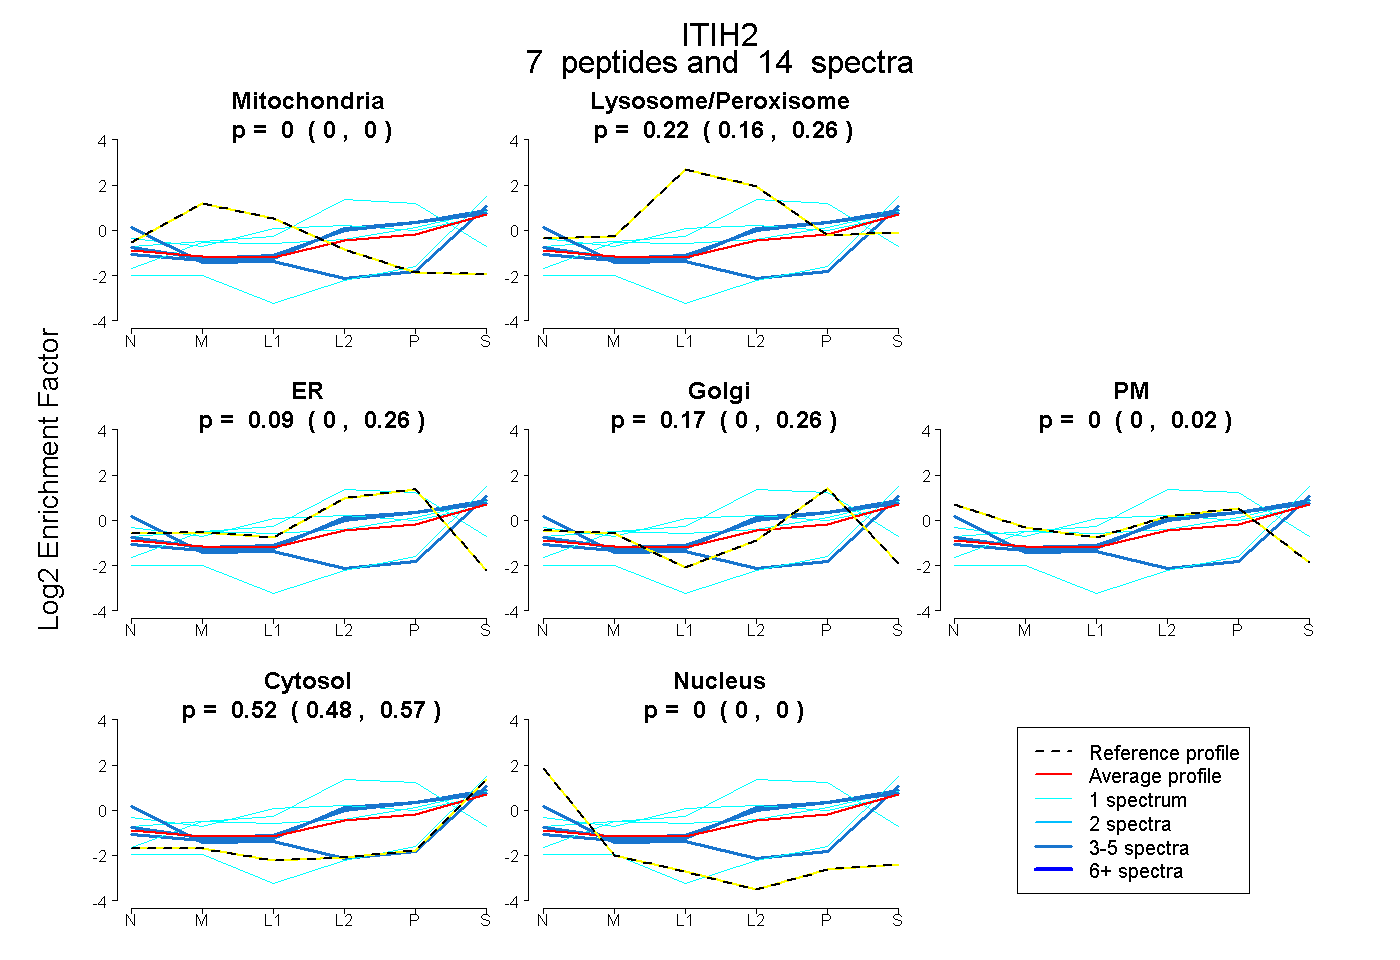 |
0.000
0.000 | 0.000 |
|
0.224
0.165 | 0.261 |
|
0.087
0.000 | 0.257 |
0.167
0.000 | 0.264 |
0.000
0.000 | 0.018 |
0.522
0.479 | 0.566 |
0.000
0.000 | 0.000 |
|
| 1 spectrum, TIDDLLR |
0.000 |
|
0.000 |
|
0.000 |
0.000 |
0.000 |
1.000 |
0.000 |
|
| 1 spectrum, IHLQPGK |
0.000 |
|
0.475 |
|
0.000 |
0.127 |
0.070 |
0.329 |
0.000 |
|
| 3 spectra, ALYSQAR |
0.000 |
|
0.164 |
|
0.335 |
0.000 |
0.000 |
0.500 |
0.000 |
|
| 3 spectra, VQSTITSR |
0.000 |
|
0.214 |
|
0.235 |
0.101 |
0.000 |
0.450 |
0.000 |
|
| 1 spectrum, LGFYFQK |
0.000 |
|
0.255 |
|
0.657 |
0.000 |
0.000 |
0.088 |
0.000 |
|
| 1 spectrum, NDLVSATK |
0.000 |
|
0.336 |
|
0.000 |
0.201 |
0.000 |
0.463 |
0.000 |
|
| 4 spectra, THPQTER |
0.000 |
|
0.144 |
|
0.000 |
0.000 |
0.000 |
0.611 |
0.245 |
|
| | | Plot |
|
Lyso |
|
|
|
|
|
|
|
Other |
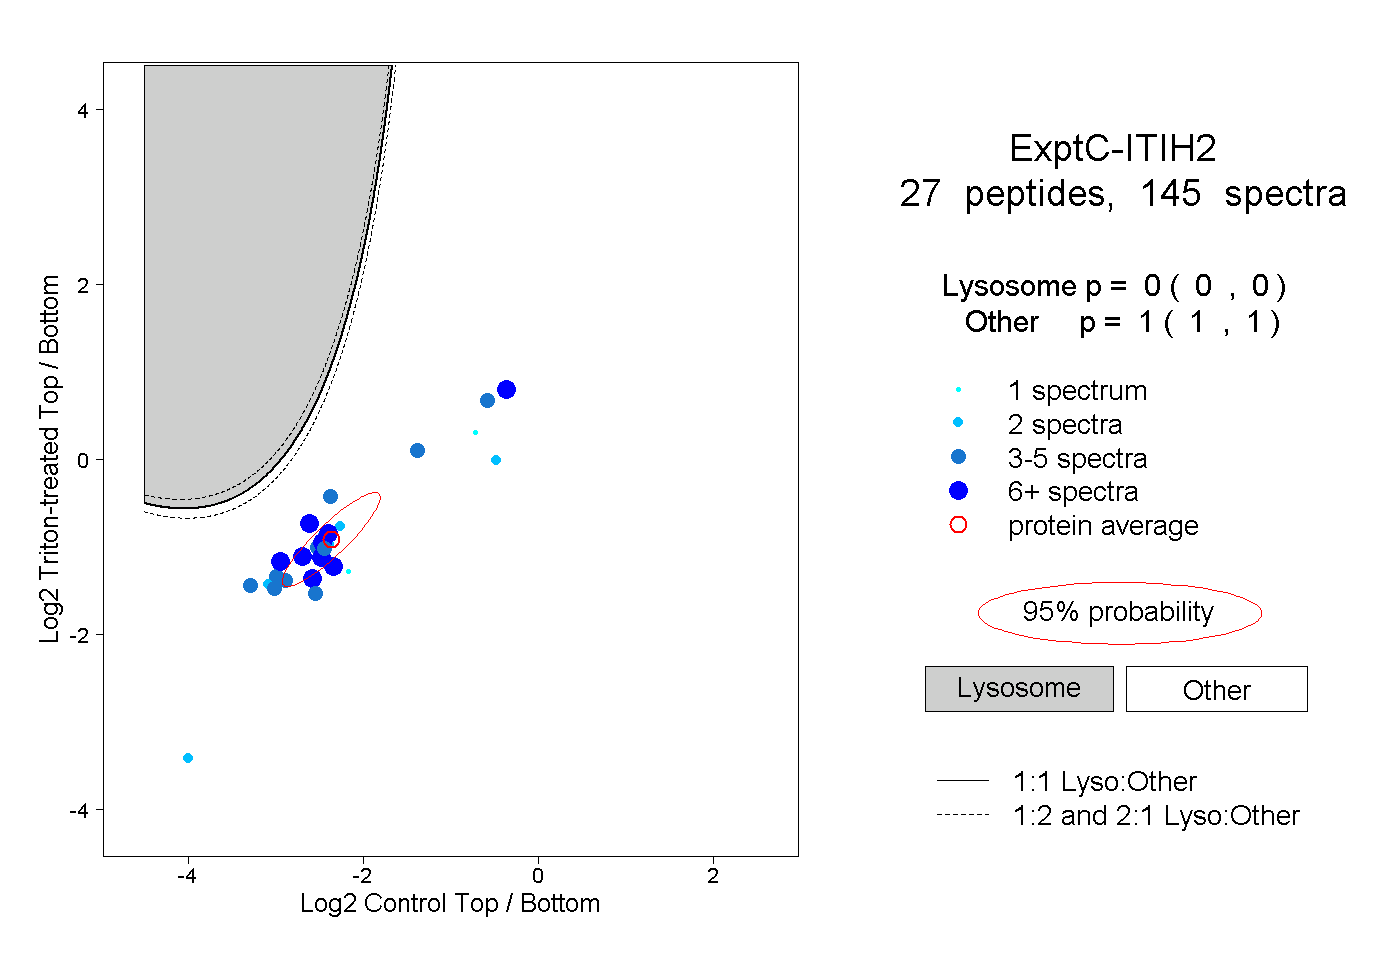
| Expt C |
27
peptides |
145
spectra |
 |
|
0.000
0.000 | 0.000 |
|
|
|
|
|
|
|
1.000
1.000 | 1.000 |
| | | Plot |
|
Lyso |
|
|
|
|
|
|
|
Other |
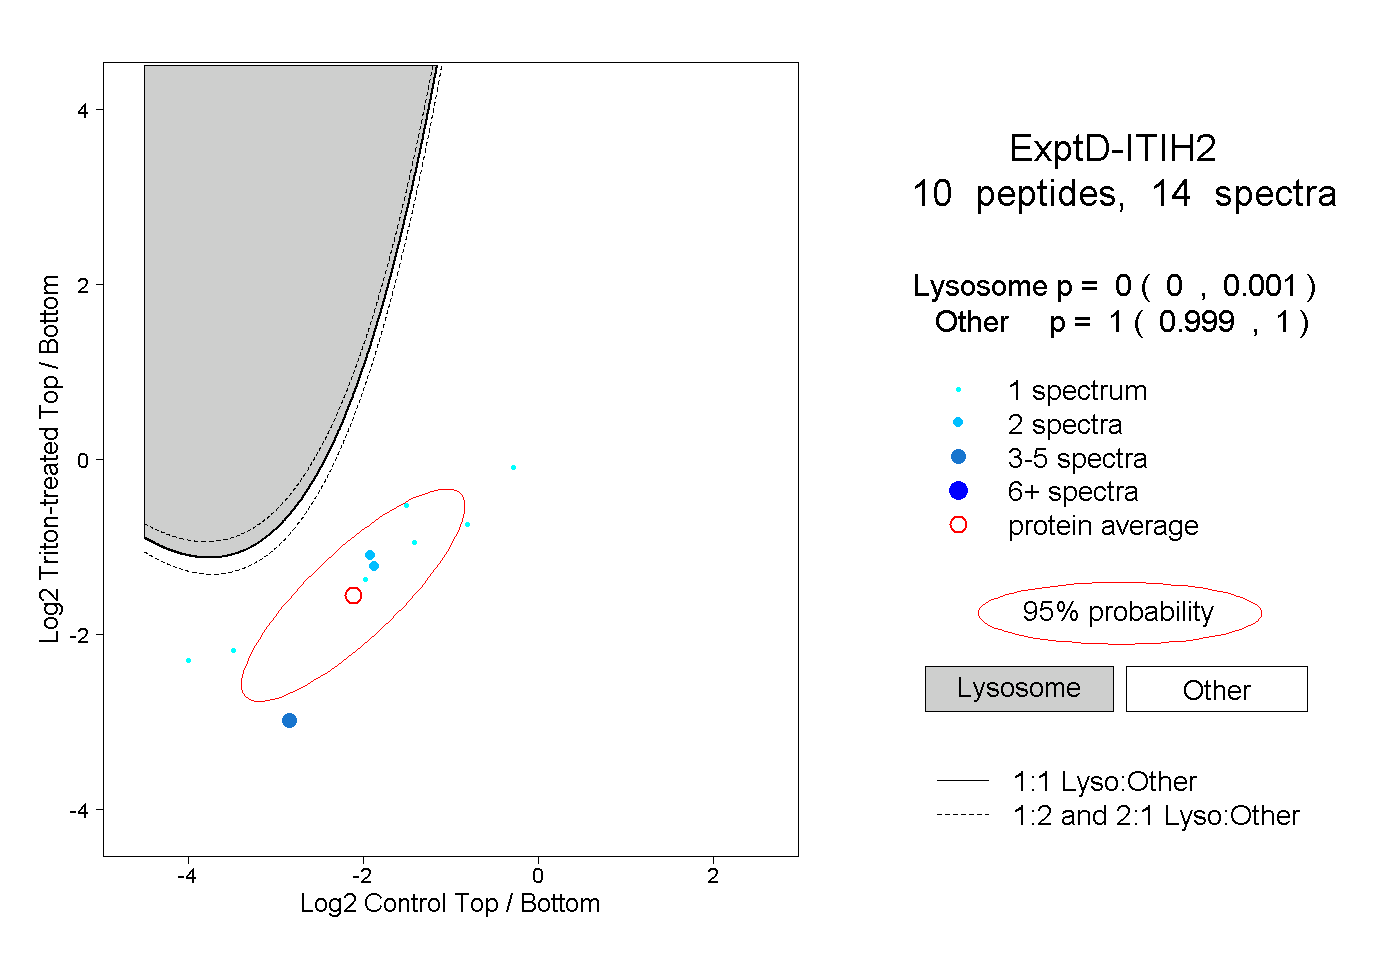
| Expt D |
10
peptides |
14
spectra |
 |
|
0.000
0.000 | 0.001 |
|
|
|
|
|
|
|
1.000
0.999 | 1.000 |