 9
9peptides
spectra
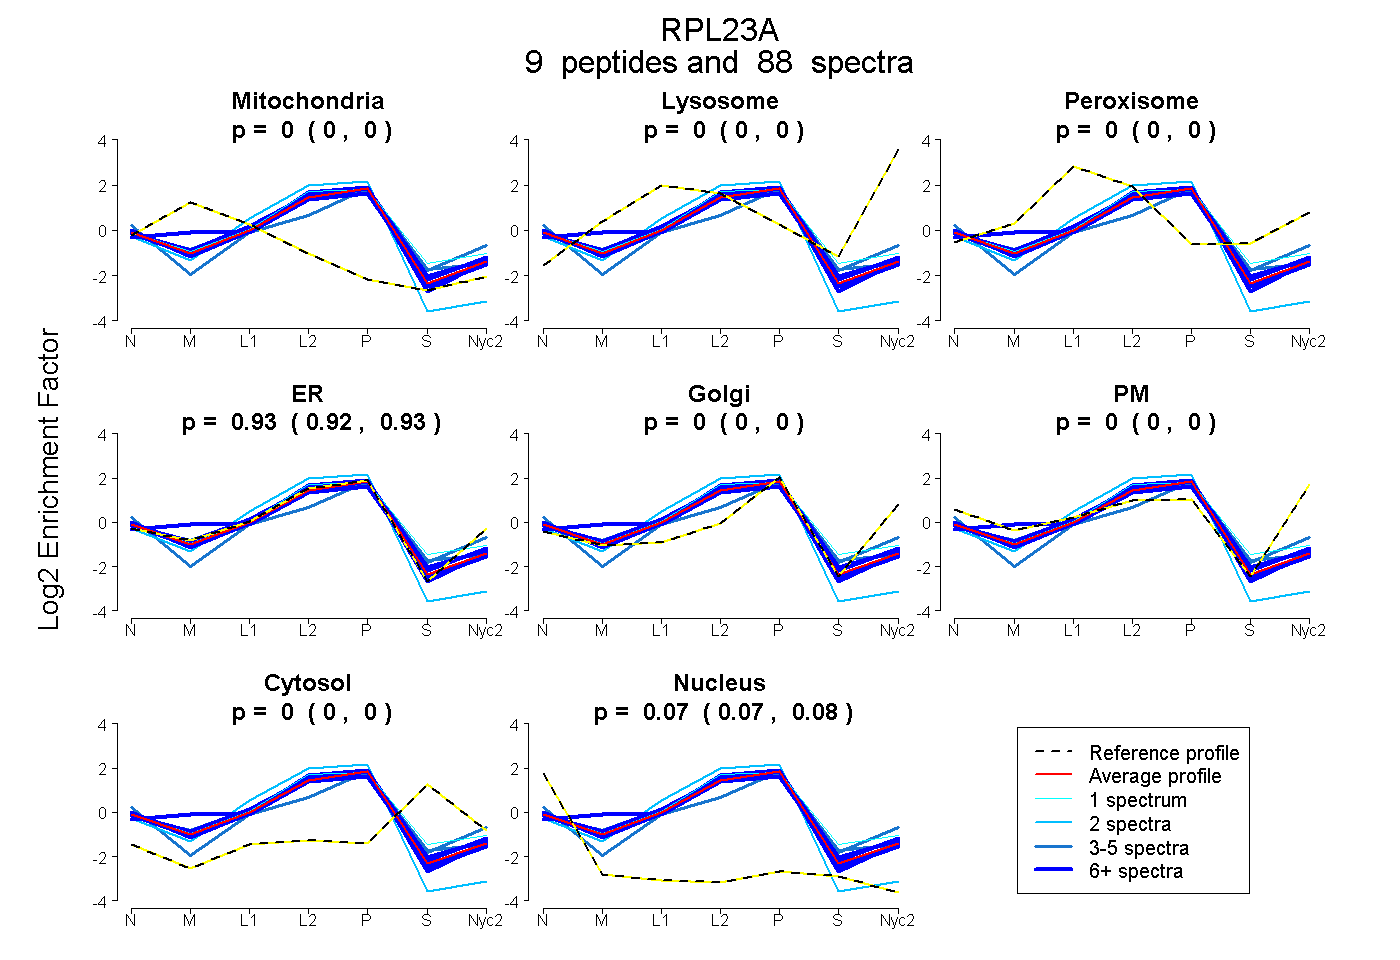
0.000 | 0.000
0.000 | 0.000
0.000 | 0.000
0.922 | 0.927
0.000 | 0.000
0.000 | 0.000
0.000 | 0.004
0.071 | 0.076
8peptides
spectra
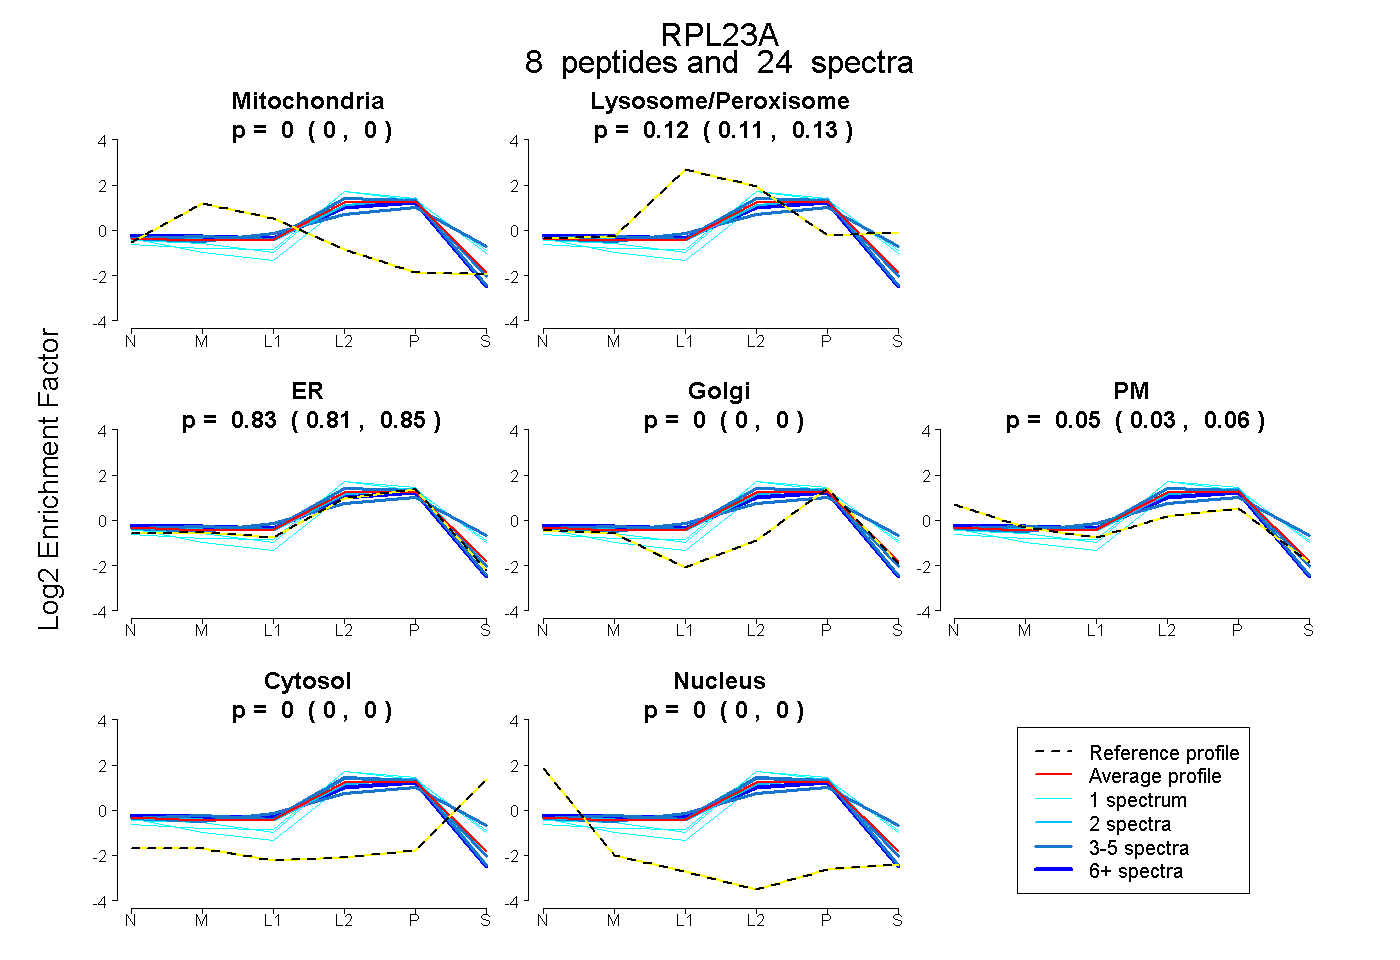
0.000 | 0.000
0.105 | 0.131
0.812 | 0.853
0.000 | 0.000
0.029 | 0.062
0.000 | 0.000
0.000 | 0.000
9peptides
spectra
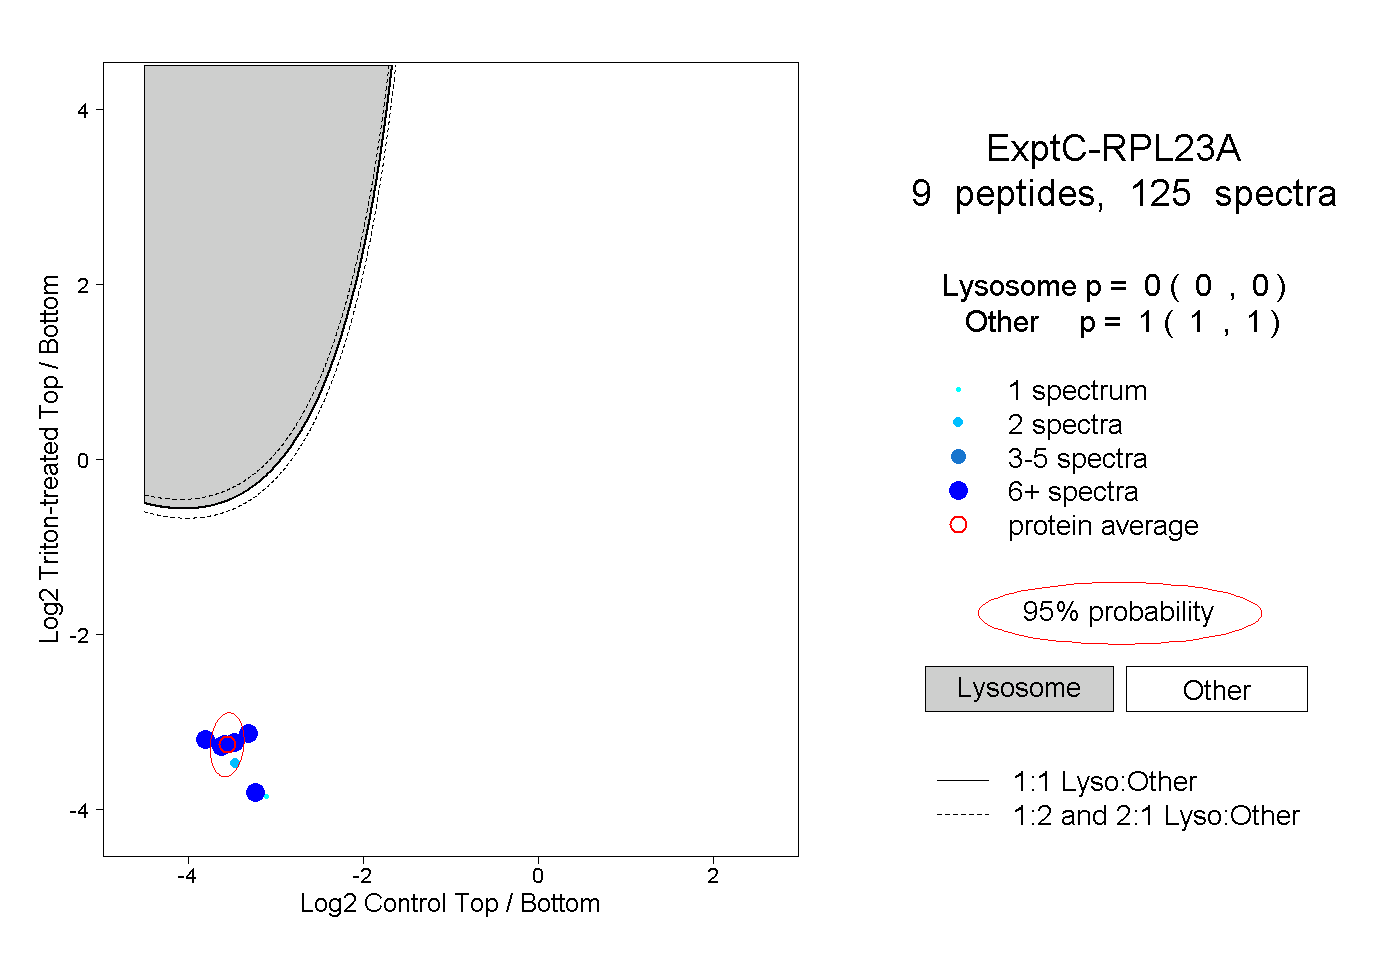
0.000 | 0.000
1.000 | 1.000
5peptides
spectra
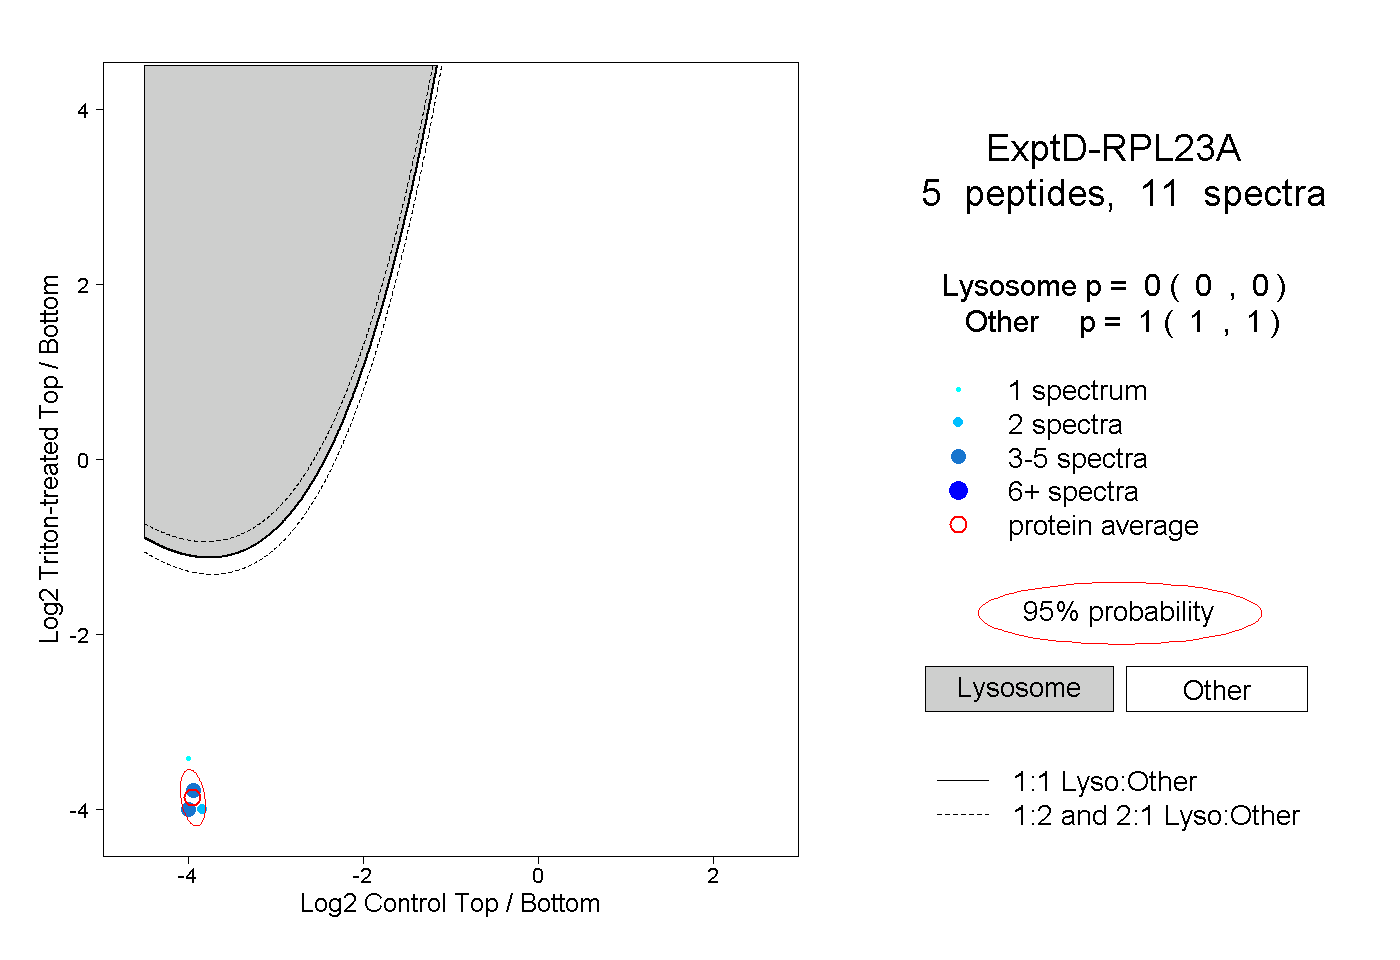
0.000 | 0.000
1.000 | 1.000