RPL23A
[ENSRNOP00000036391]
Main page
| | | Plot |
Mito |
Lyso |
|
Perox |
ER |
Golgi |
PM |
Cytosol |
Nucleus |
|
| Expt A |
 9
9
peptides |
88
spectra |
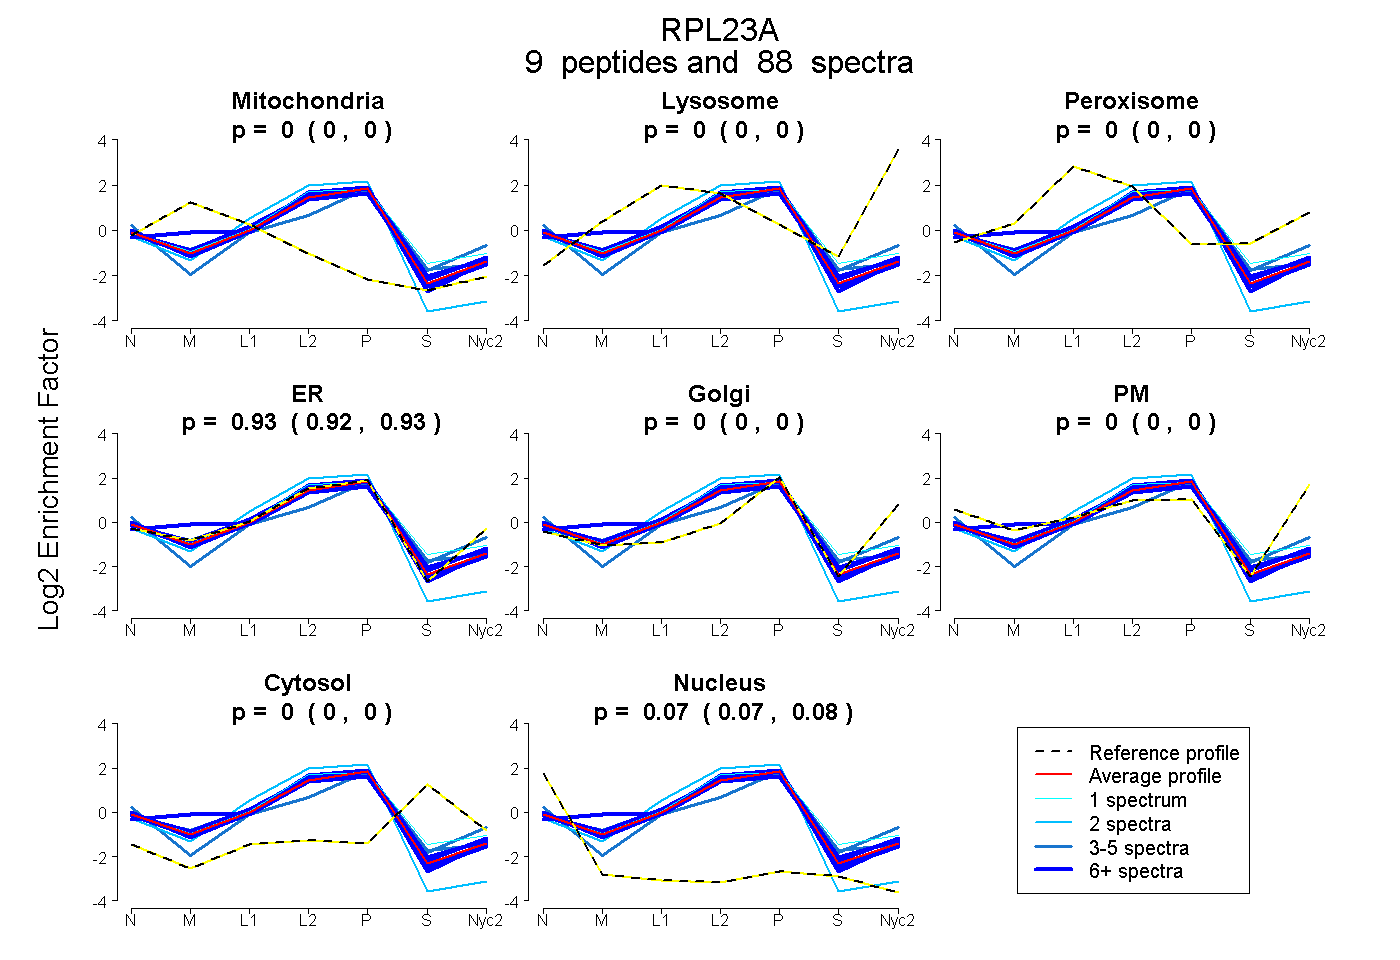 |
0.000
0.000 | 0.000 |
0.000
0.000 | 0.000 |
|
0.000
0.000 | 0.000 |
0.925
0.922 | 0.927 |
0.000
0.000 | 0.000 |
0.000
0.000 | 0.000 |
0.000
0.000 | 0.004 |
0.075
0.071 | 0.076 |
|
| | | Plot |
Mito |
|
Lyso or Perox |
|
ER |
Golgi |
PM |
Cytosol |
Nucleus |
|
| Expt B |
8
peptides |
24
spectra |
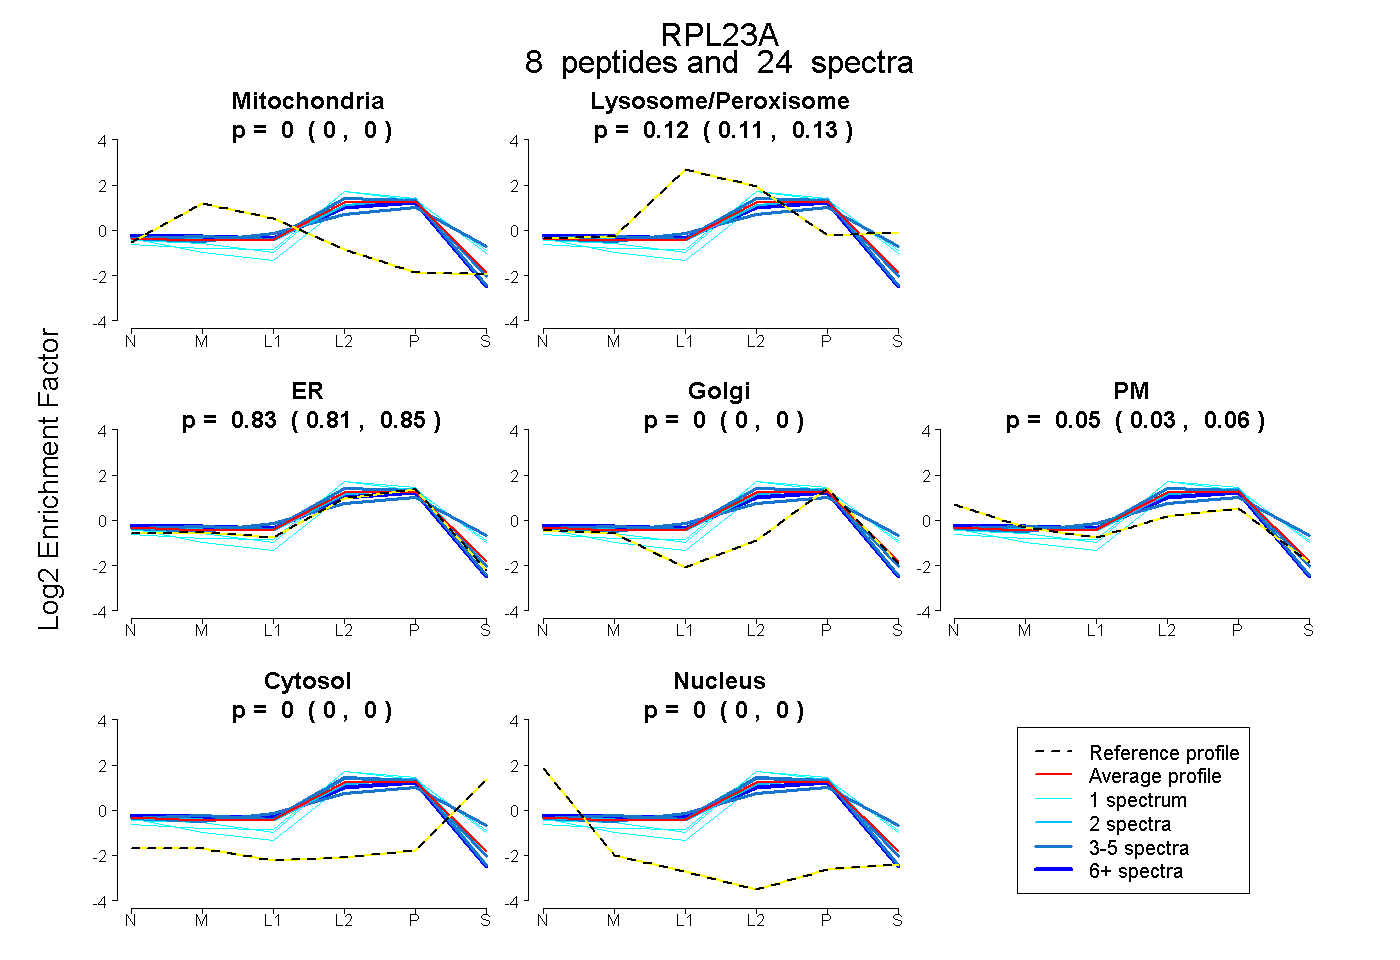 |
0.000
0.000 | 0.000 |
|
0.119
0.105 | 0.131 |
|
0.834
0.812 | 0.853 |
0.000
0.000 | 0.000 |
0.047
0.029 | 0.062 |
0.000
0.000 | 0.000 |
0.000
0.000 | 0.000 |
|
| 4 spectra, GVHSHK |
0.000 |
|
0.112 |
|
0.888 |
0.000 |
0.000 |
0.000 |
0.000 |
|
| 1 spectrum, EAPAPPK |
0.000 |
|
0.009 |
|
0.858 |
0.000 |
0.000 |
0.133 |
0.000 |
|
| 1 spectrum, LDHYAIIK |
0.000 |
|
0.145 |
|
0.786 |
0.000 |
0.000 |
0.069 |
0.000 |
|
| 7 spectra, LAPDYDALDVANK |
0.026 |
|
0.044 |
|
0.822 |
0.000 |
0.107 |
0.000 |
0.000 |
|
| 4 spectra, LYDIDVAK |
0.000 |
|
0.402 |
|
0.157 |
0.412 |
0.000 |
0.029 |
0.000 |
|
| 2 spectra, TSPTFR |
0.000 |
|
0.039 |
|
0.961 |
0.000 |
0.000 |
0.000 |
0.000 |
|
| 1 spectrum, FPLTTESAMK |
0.000 |
|
0.024 |
|
0.976 |
0.000 |
0.000 |
0.000 |
0.000 |
|
| 4 spectra, VNTLIRPDGEK |
0.000 |
|
0.066 |
|
0.934 |
0.000 |
0.000 |
0.000 |
0.000 |
|
| | | Plot |
|
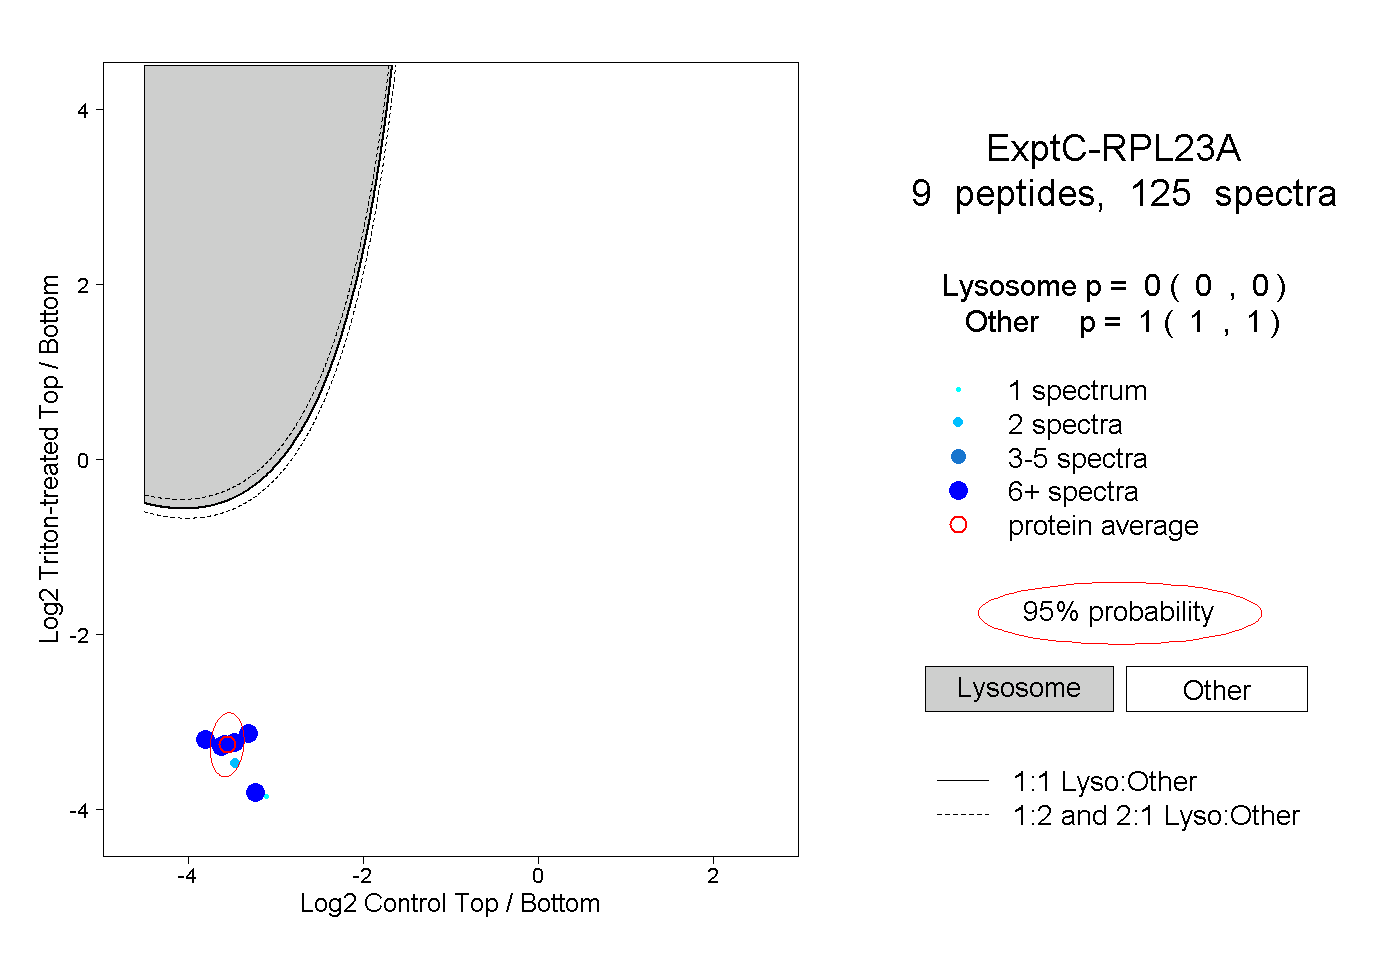
Lyso |
|
|
|
|
|
|
|
Other |
| Expt C |
9
peptides |
125
spectra |
 |
|
0.000
0.000 | 0.000 |
|
|
|
|
|
|
|
1.000
1.000 | 1.000 |
| | | Plot |
|
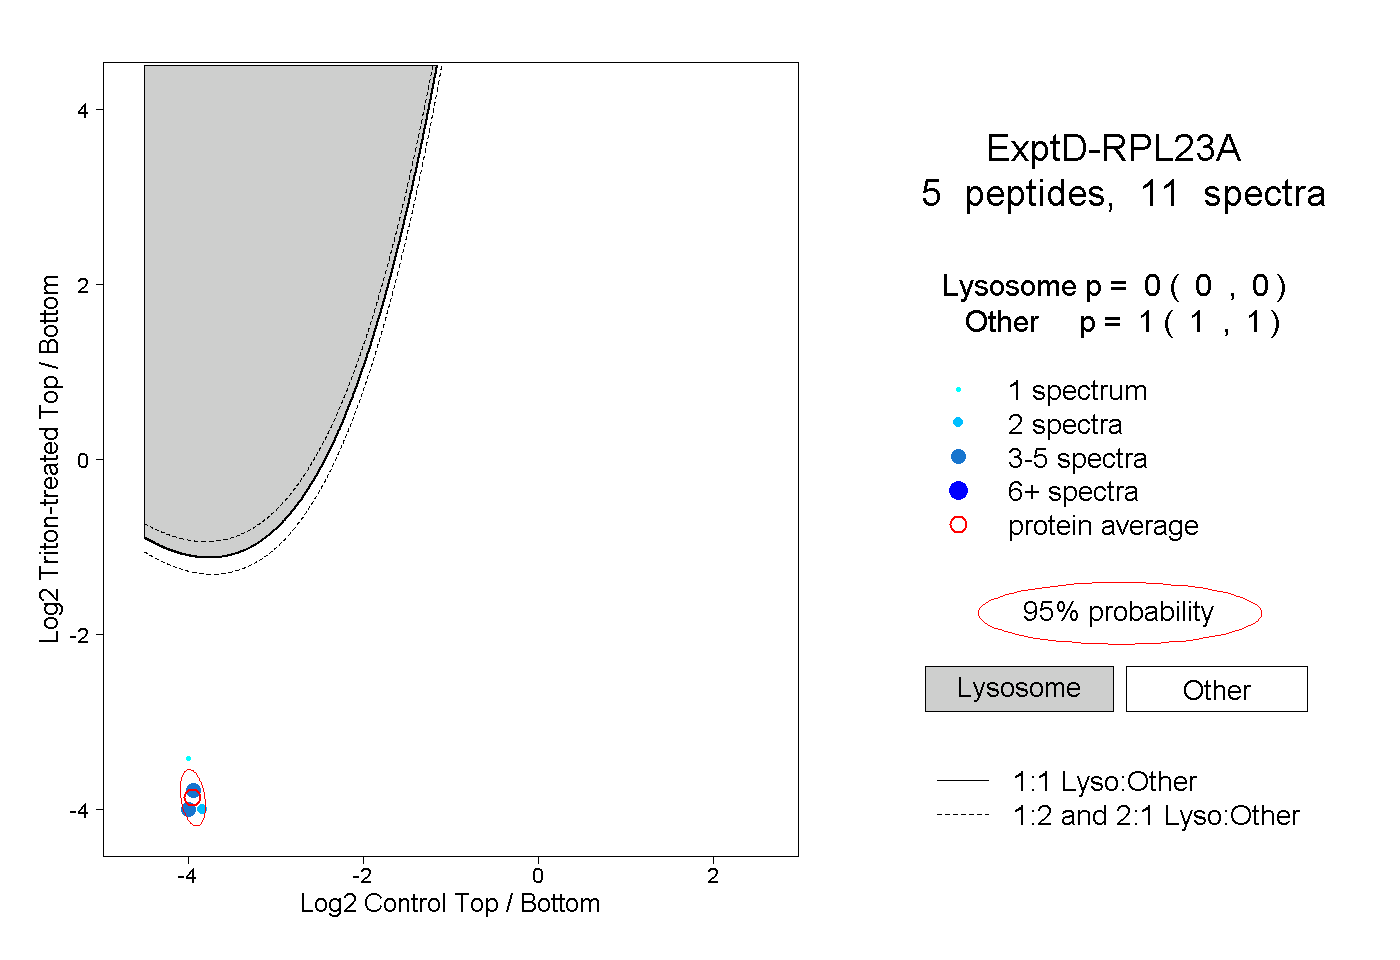
Lyso |
|
|
|
|
|
|
|
Other |
| Expt D |
5
peptides |
11
spectra |
 |
|
0.000
0.000 | 0.000 |
|
|
|
|
|
|
|
1.000
1.000 | 1.000 |