 9
9peptides
spectra
0.000 | 0.000
0.000 | 0.000
0.000 | 0.000
0.922 | 0.927
0.000 | 0.000
0.000 | 0.000
0.000 | 0.004
0.071 | 0.076
| Plot | Mito | Lyso | Perox | ER | Golgi | PM | Cytosol | Nucleus | |||||
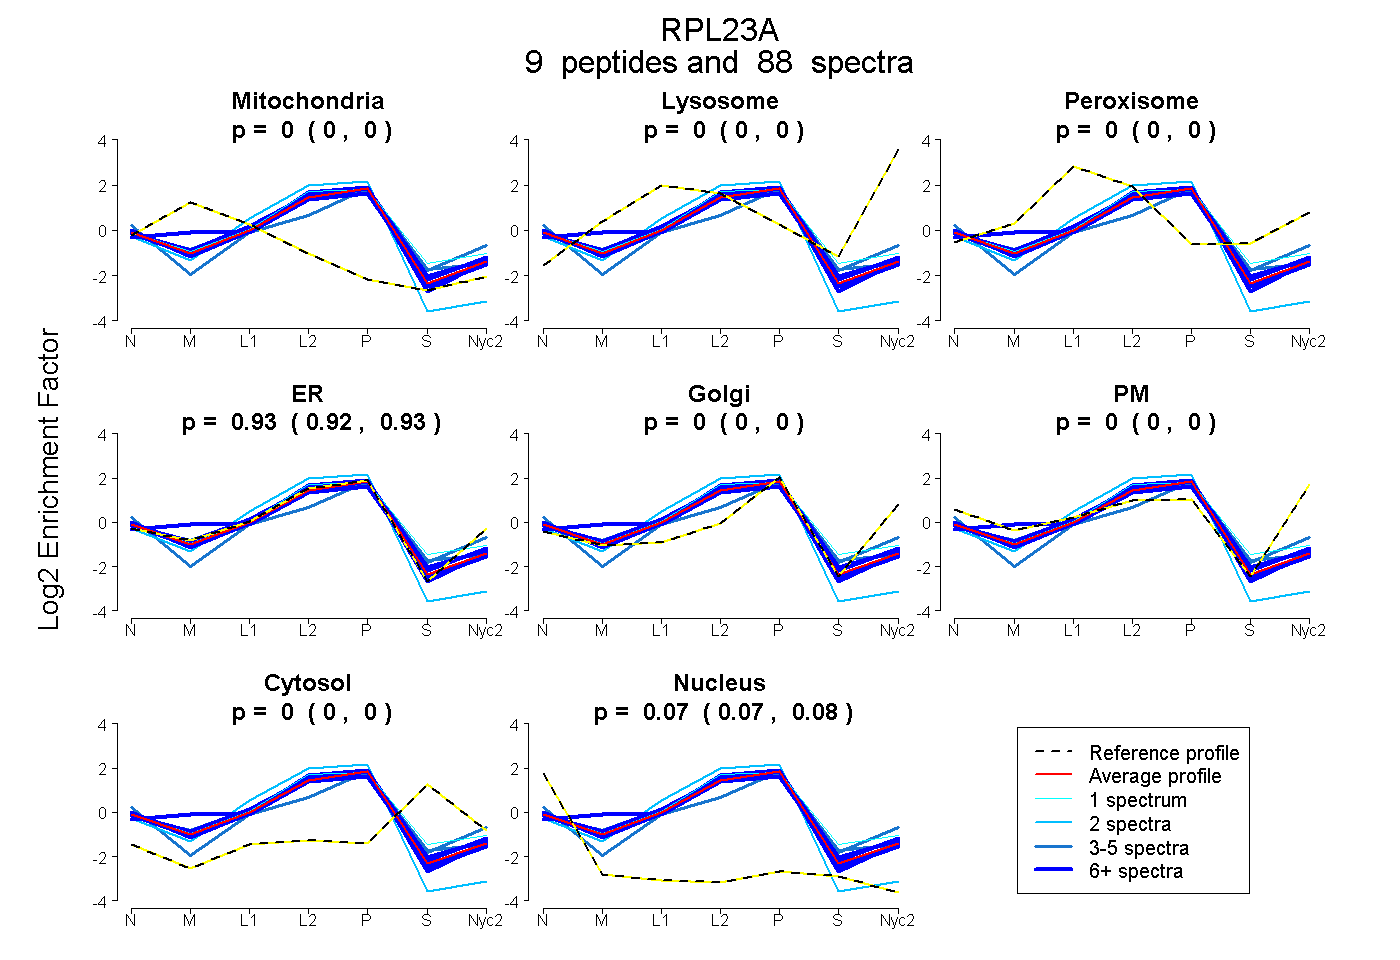
| Expt A |
9 peptides |
88 spectra |
|
0.000 0.000 | 0.000 |
0.000 0.000 | 0.000 |
0.000 0.000 | 0.000 |
0.925 0.922 | 0.927 |
0.000 0.000 | 0.000 |
0.000 0.000 | 0.000 |
0.000 0.000 | 0.004 |
0.075 0.071 | 0.076 |
| 26 spectra, GVHSHK | 0.000 | 0.000 | 0.000 | 0.912 | 0.000 | 0.000 | 0.000 | 0.088 | ||
| 5 spectra, EAPAPPK | 0.000 | 0.000 | 0.000 | 0.739 | 0.070 | 0.000 | 0.132 | 0.059 | ||
| 8 spectra, LDHYAIIK | 0.000 | 0.000 | 0.000 | 0.905 | 0.000 | 0.000 | 0.051 | 0.043 | ||
| 12 spectra, LAPDYDALDVANK | 0.013 | 0.000 | 0.000 | 0.937 | 0.000 | 0.000 | 0.000 | 0.050 | ||
| 3 spectra, IEDNNTLVFIVDVK | 0.032 | 0.000 | 0.000 | 0.860 | 0.000 | 0.000 | 0.103 | 0.005 | ||
| 13 spectra, LYDIDVAK | 0.000 | 0.000 | 0.000 | 0.933 | 0.000 | 0.000 | 0.000 | 0.067 | ||
| 18 spectra, TSPTFR | 0.150 | 0.000 | 0.000 | 0.845 | 0.000 | 0.000 | 0.005 | 0.000 | ||
| 1 spectrum, VNTLIRPDGEK | 0.000 | 0.000 | 0.034 | 0.849 | 0.000 | 0.000 | 0.117 | 0.000 | ||
| 2 spectra, FPLTTESAMK | 0.000 | 0.000 | 0.000 | 0.913 | 0.000 | 0.000 | 0.000 | 0.087 |
| Plot | Mito | Lyso or Perox | ER | Golgi | PM | Cytosol | Nucleus | ||||||
| Expt B |
8 peptides |
24 spectra |
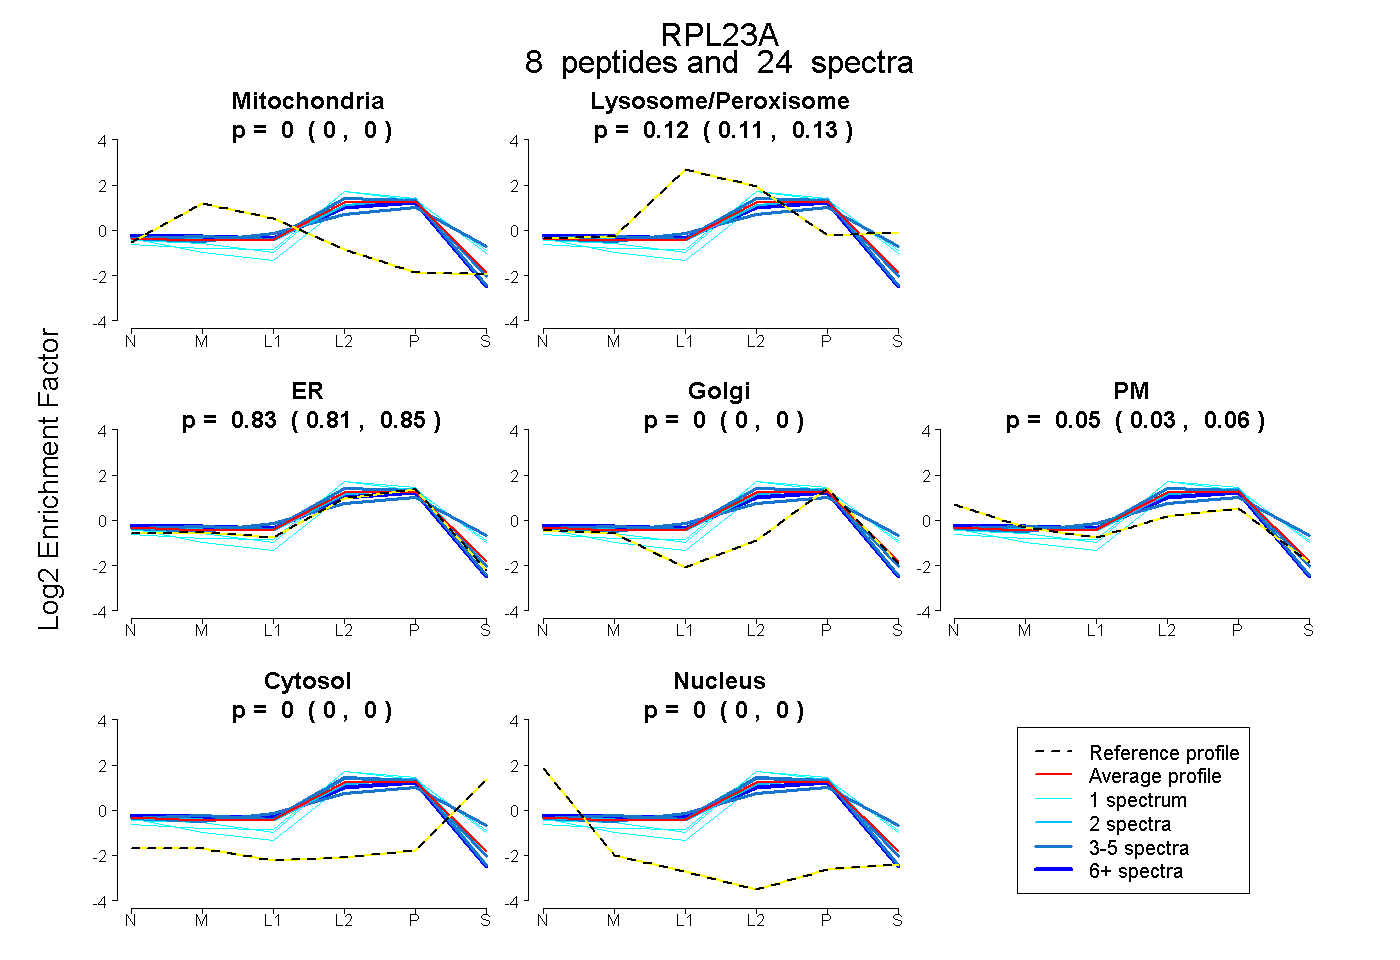 |
0.000 0.000 | 0.000 |
0.119 0.105 | 0.131 |
0.834 0.812 | 0.853 |
0.000 0.000 | 0.000 |
0.047 0.029 | 0.062 |
0.000 0.000 | 0.000 |
0.000 0.000 | 0.000 |
|||
| Plot | Lyso | Other | |||||||||||
| Expt C |
9 peptides |
125 spectra |
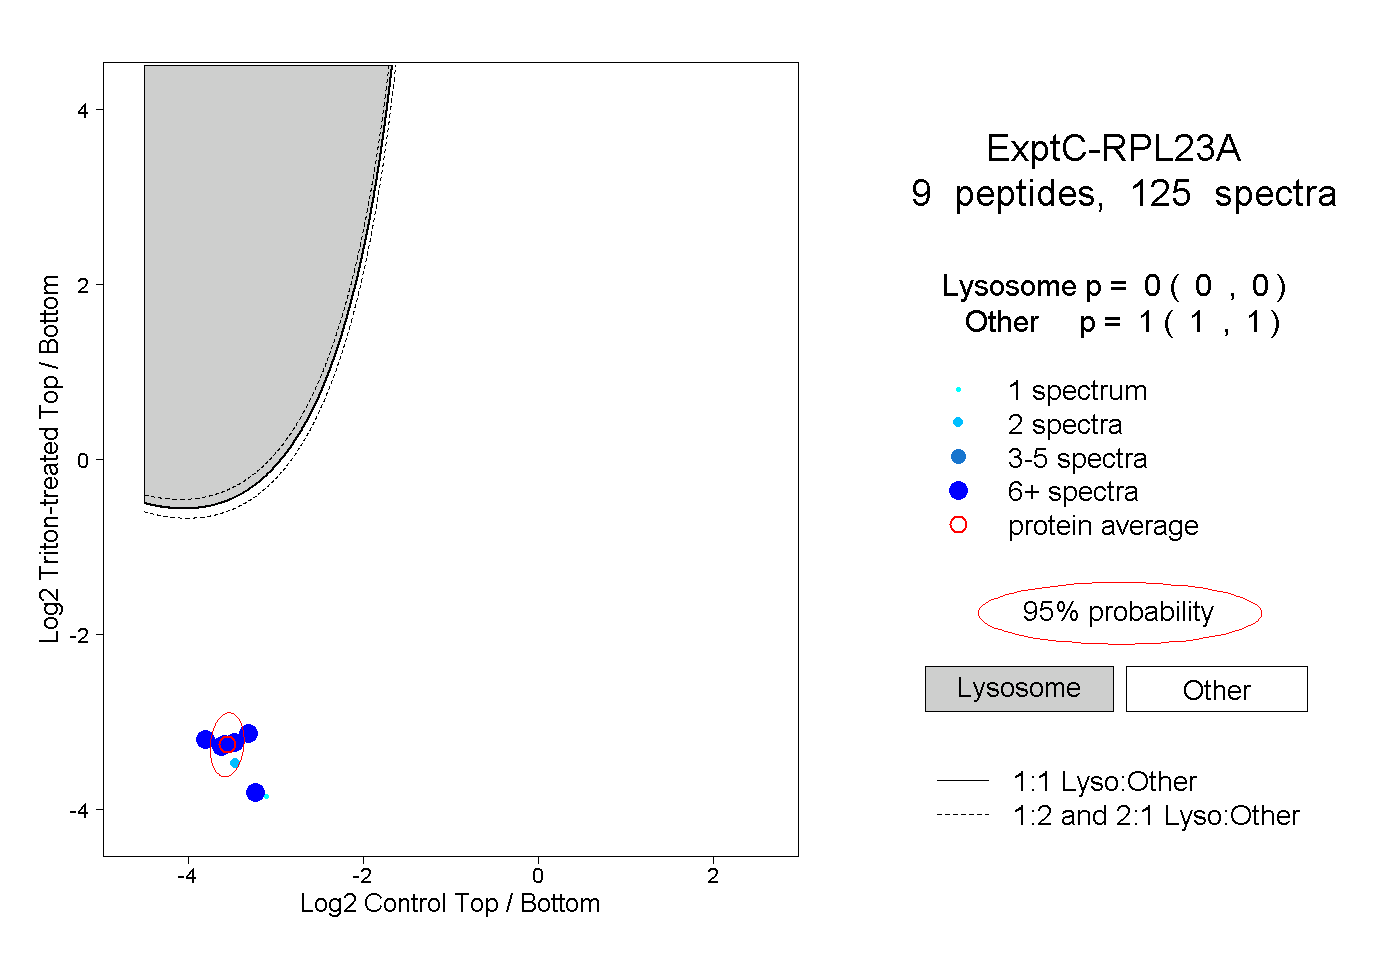 |
0.000 0.000 | 0.000 |
1.000 1.000 | 1.000 |
||||||||
| Plot | Lyso | Other | |||||||||||
| Expt D |
5 peptides |
11 spectra |
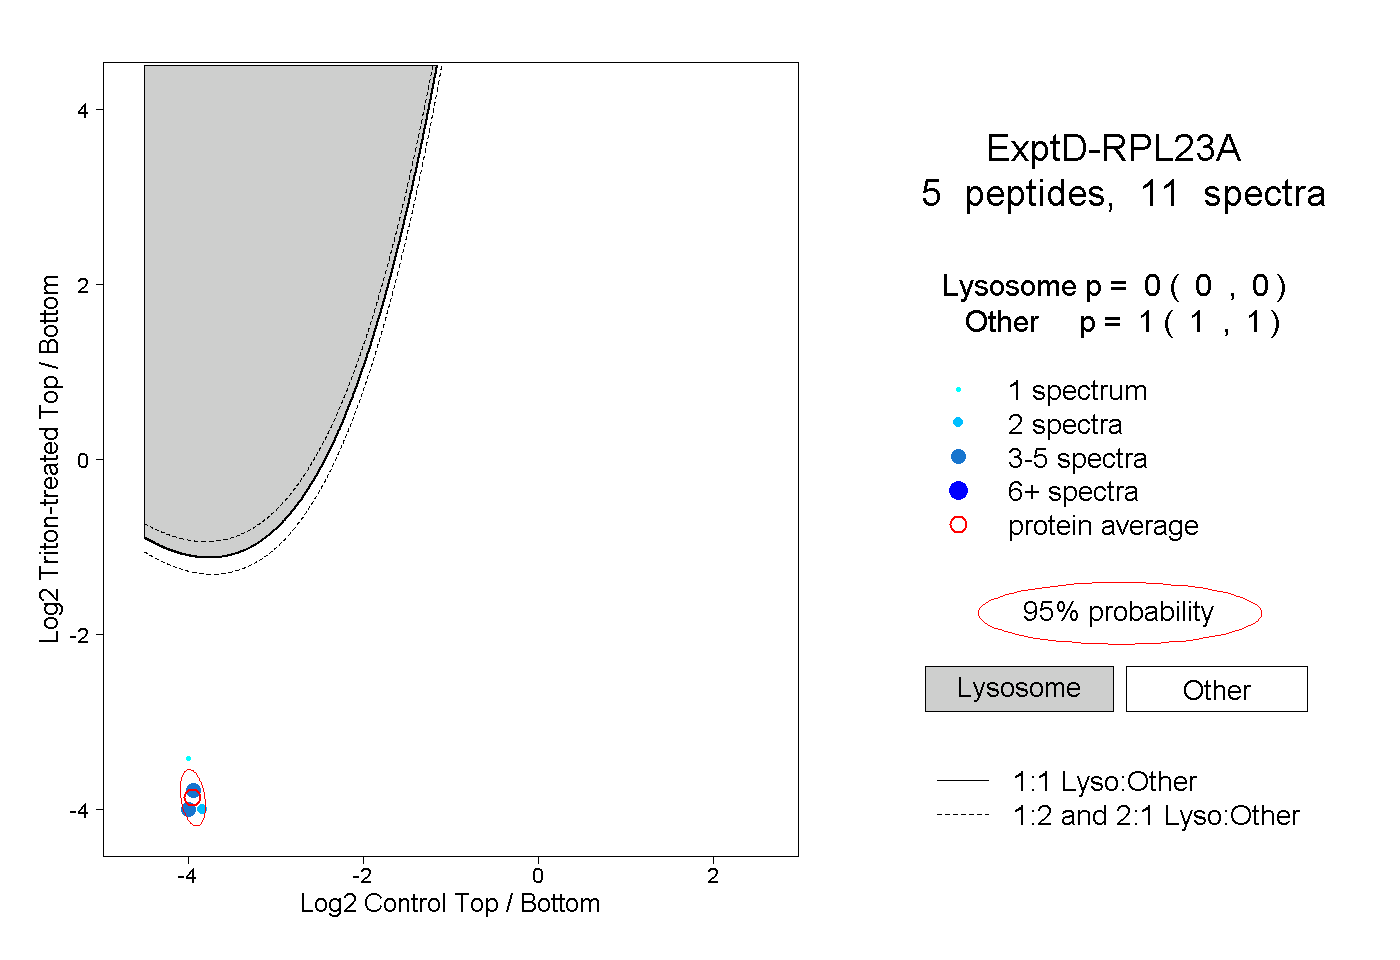 |
0.000 0.000 | 0.000 |
1.000 1.000 | 1.000 |