 9
9peptides
spectra
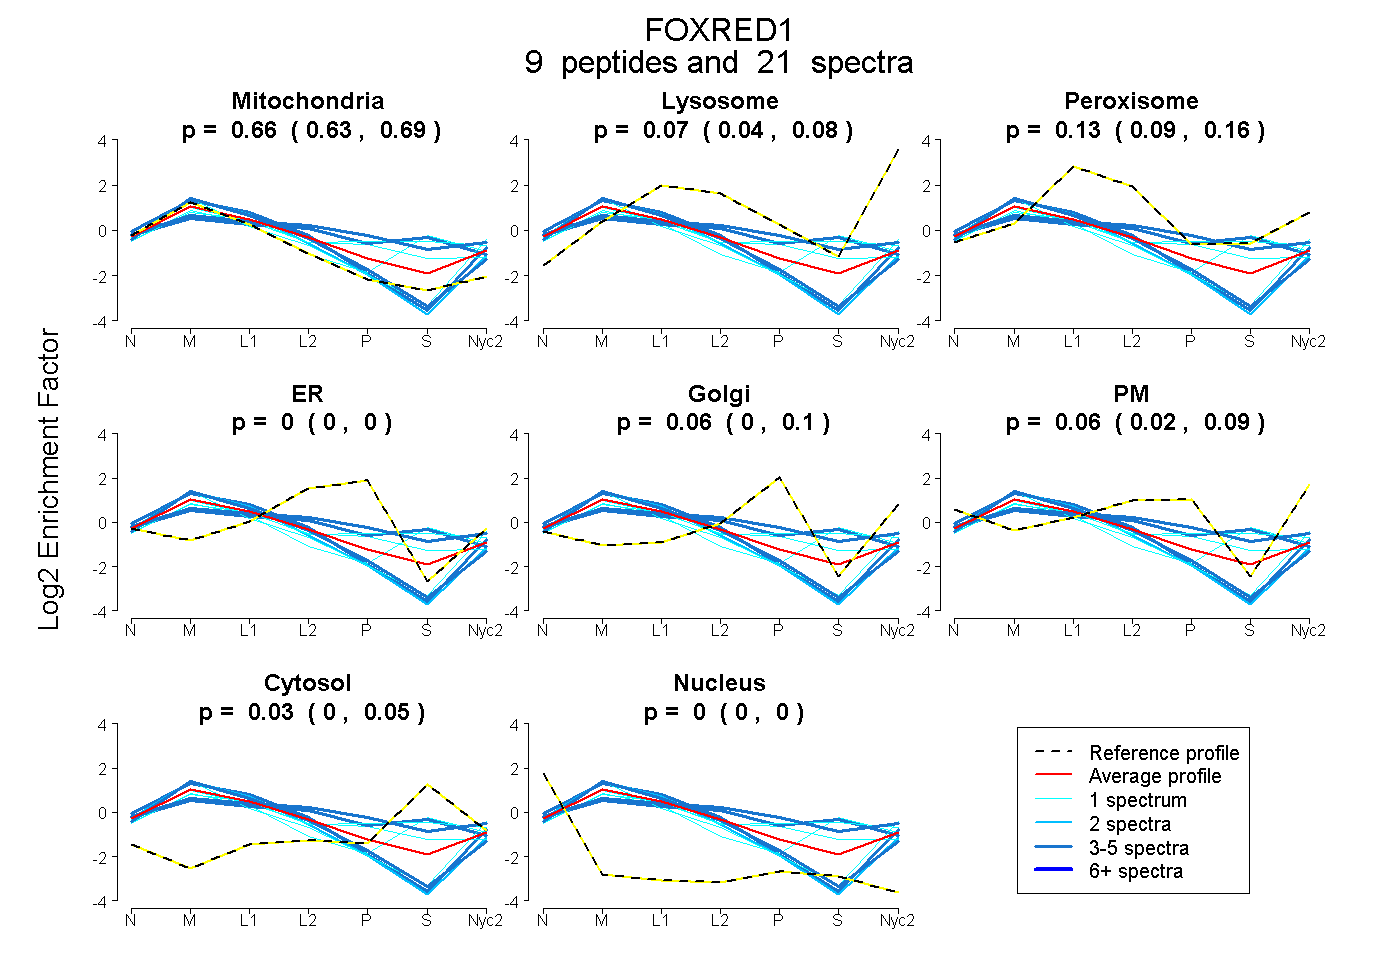
0.634 | 0.686
0.044 | 0.084
0.090 | 0.159
0.000 | 0.000
0.000 | 0.097
0.018 | 0.092
0.000 | 0.054
0.000 | 0.000
6peptides
spectra
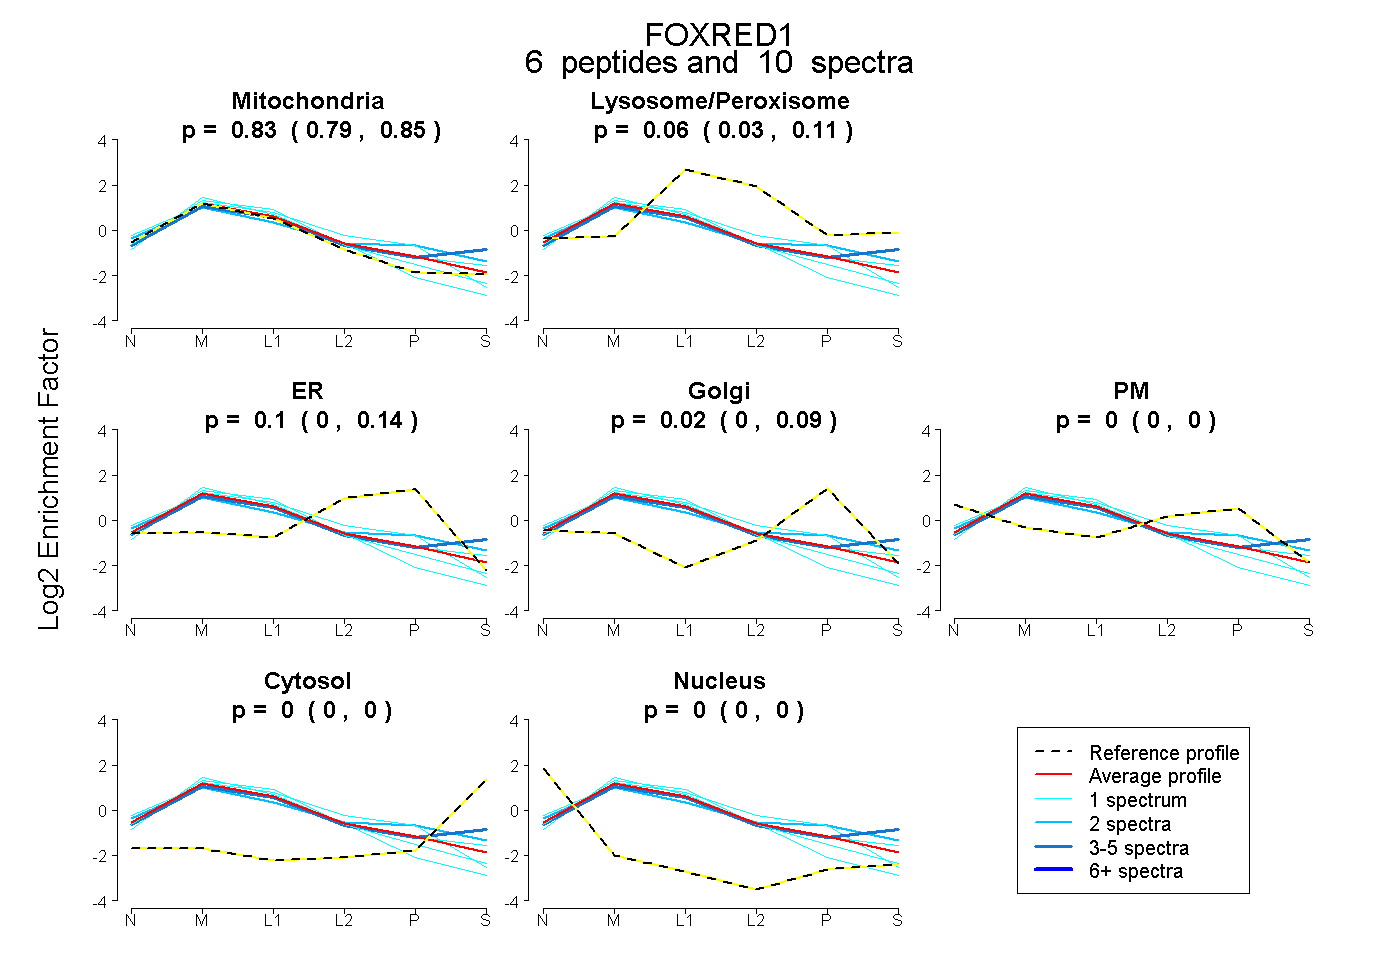
0.787 | 0.848
0.026 | 0.114
0.000 | 0.136
0.000 | 0.089
0.000 | 0.000
0.000 | 0.000
0.000 | 0.000
16peptides
spectra
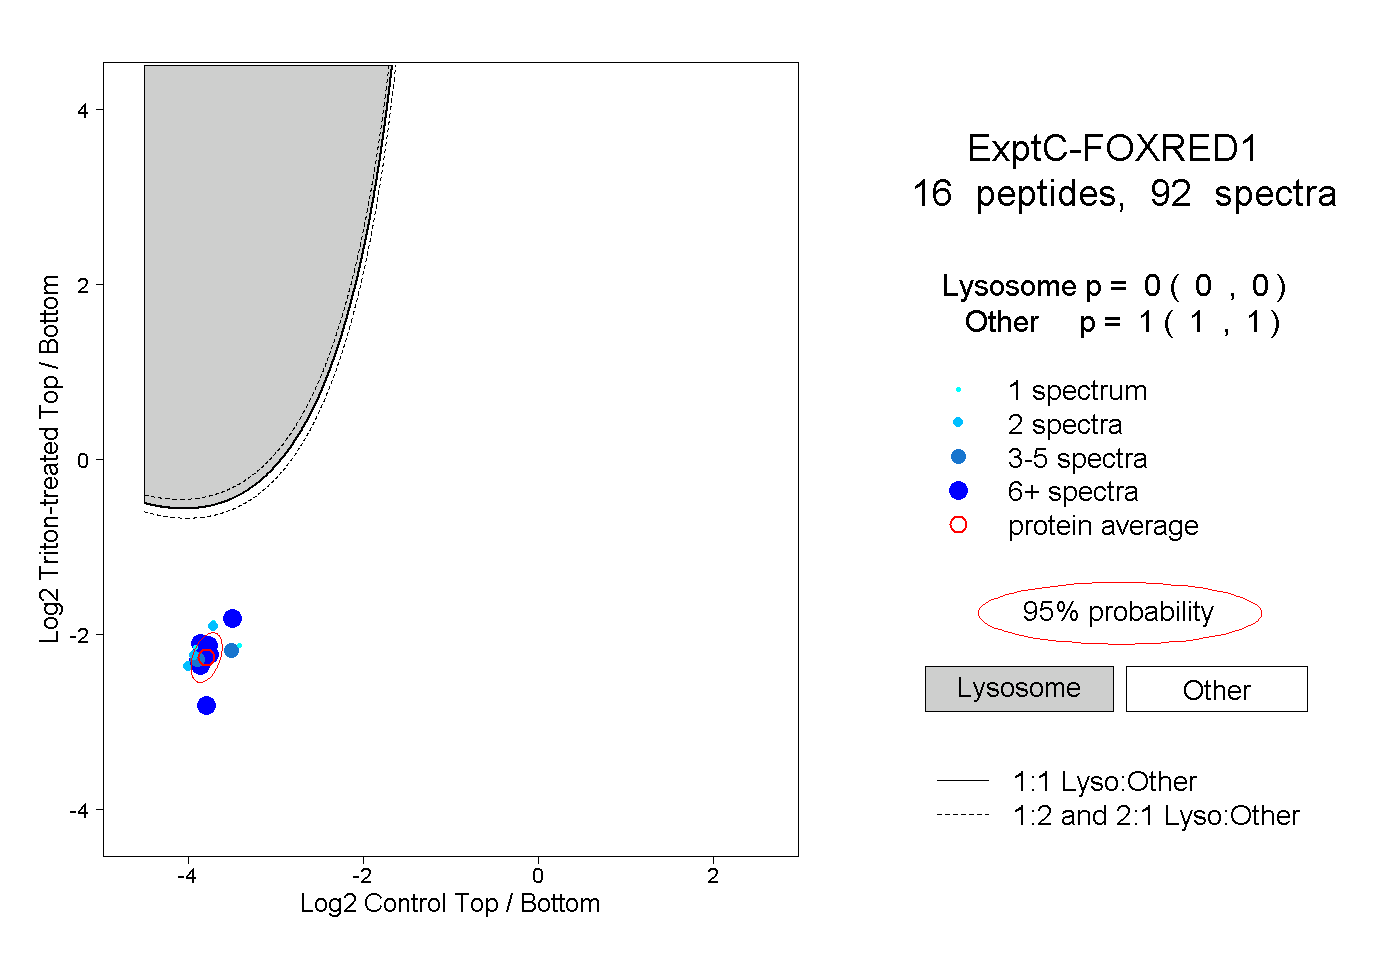
0.000 | 0.000
1.000 | 1.000
6peptides
spectra
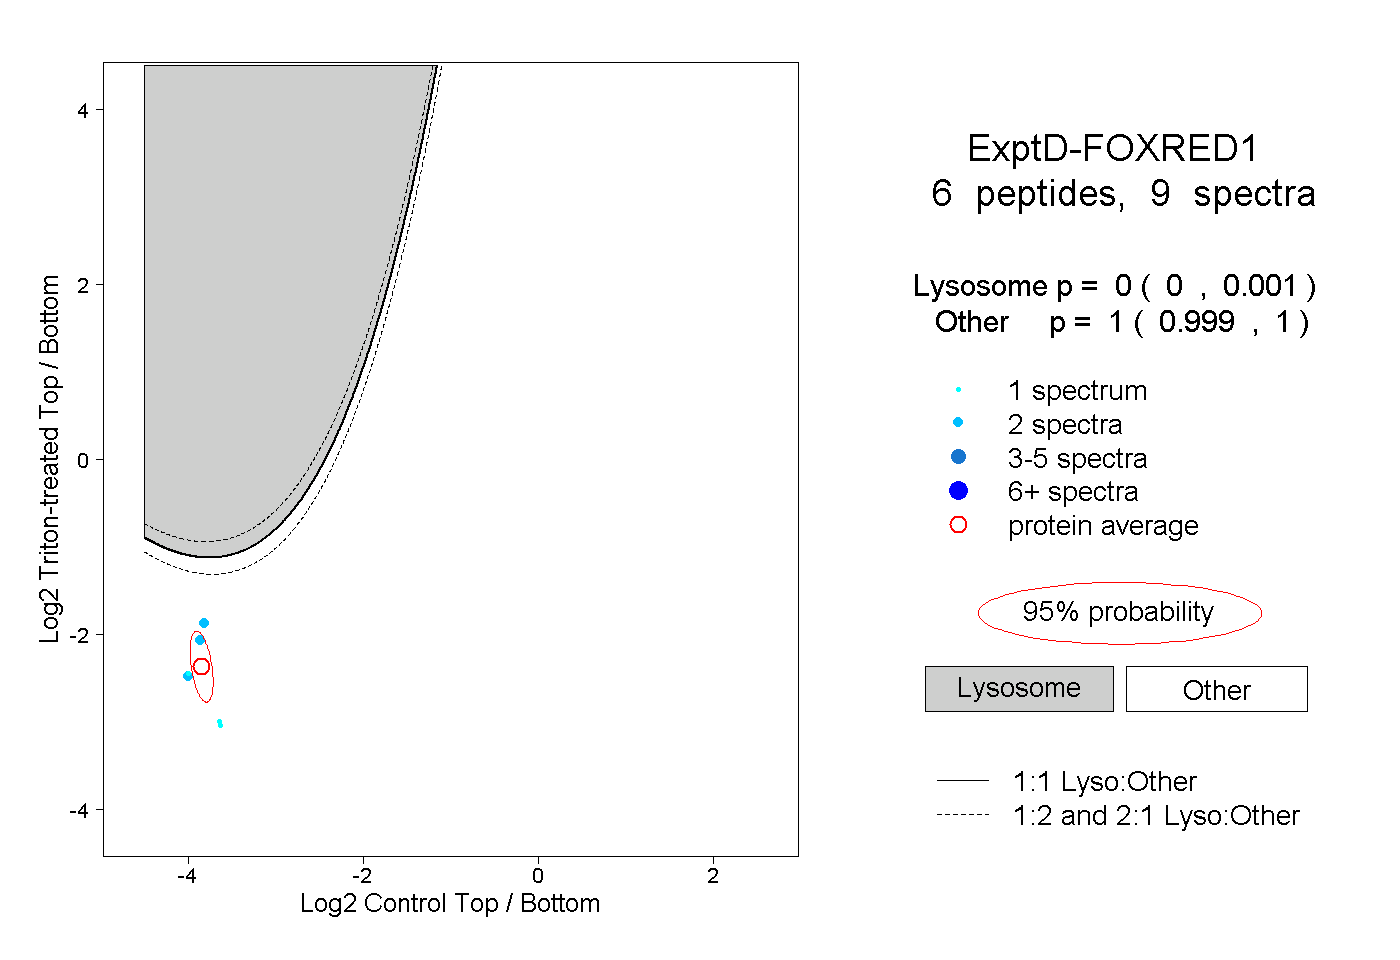
0.000 | 0.001
0.999 | 1.000