 9
9peptides
spectra
0.634 | 0.686
0.044 | 0.084
0.090 | 0.159
0.000 | 0.000
0.000 | 0.097
0.018 | 0.092
0.000 | 0.054
0.000 | 0.000
| Plot | Mito | Lyso | Perox | ER | Golgi | PM | Cytosol | Nucleus | |||||
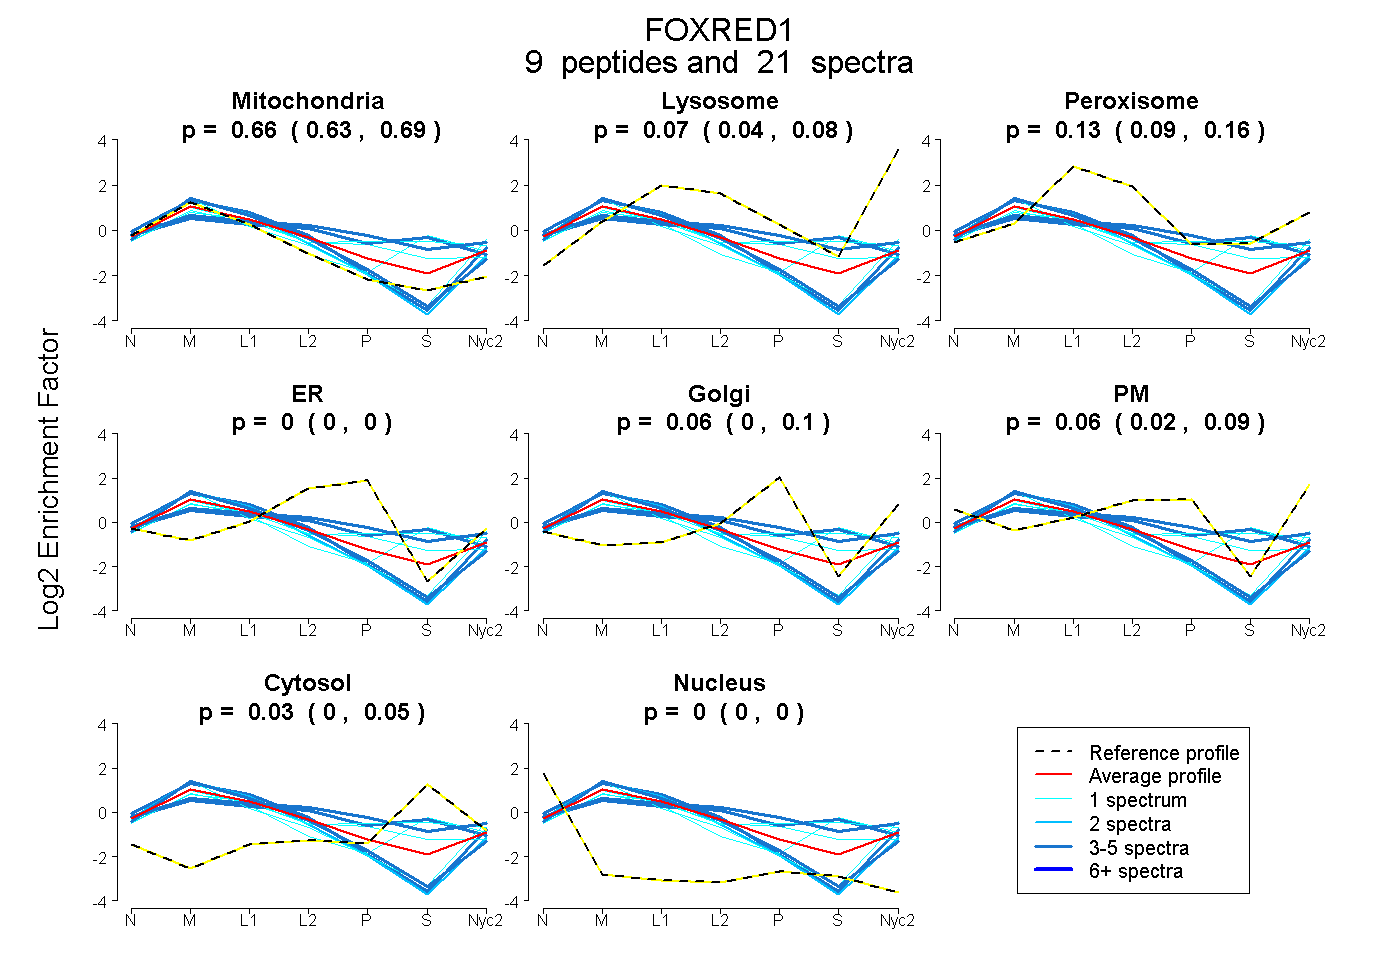
| Expt A |
9 peptides |
21 spectra |
|
0.664 0.634 | 0.686 |
0.067 0.044 | 0.084 |
0.128 0.090 | 0.159 |
0.000 0.000 | 0.000 |
0.055 0.000 | 0.097 |
0.058 0.018 | 0.092 |
0.028 0.000 | 0.054 |
0.000 0.000 | 0.000 |
| 1 spectrum, LPVEPR | 0.388 | 0.014 | 0.279 | 0.000 | 0.113 | 0.000 | 0.206 | 0.000 | ||
| 5 spectra, VWPHLVQR | 0.322 | 0.000 | 0.331 | 0.021 | 0.208 | 0.000 | 0.119 | 0.000 | ||
| 1 spectrum, NINEYLAVVDAPPVELR | 0.786 | 0.118 | 0.000 | 0.000 | 0.000 | 0.095 | 0.000 | 0.000 | ||
| 1 spectrum, GAMQVLVVEQDHTYSR | 0.563 | 0.000 | 0.198 | 0.000 | 0.148 | 0.000 | 0.090 | 0.000 | ||
| 3 spectra, AVAEMILEGHFK | 0.786 | 0.098 | 0.000 | 0.000 | 0.000 | 0.116 | 0.000 | 0.000 | ||
| 4 spectra, TIDMSPFLFTR | 0.845 | 0.090 | 0.000 | 0.050 | 0.000 | 0.015 | 0.000 | 0.000 | ||
| 2 spectra, FNPSGCLLLASEK | 0.863 | 0.071 | 0.000 | 0.000 | 0.000 | 0.067 | 0.000 | 0.000 | ||
| 1 spectrum, DAATLESNVR | 0.524 | 0.000 | 0.182 | 0.000 | 0.000 | 0.000 | 0.293 | 0.000 | ||
| 3 spectra, GLQHAPGIGR | 0.352 | 0.000 | 0.279 | 0.112 | 0.000 | 0.000 | 0.256 | 0.000 |
| Plot | Mito | Lyso or Perox | ER | Golgi | PM | Cytosol | Nucleus | ||||||
| Expt B |
6 peptides |
10 spectra |
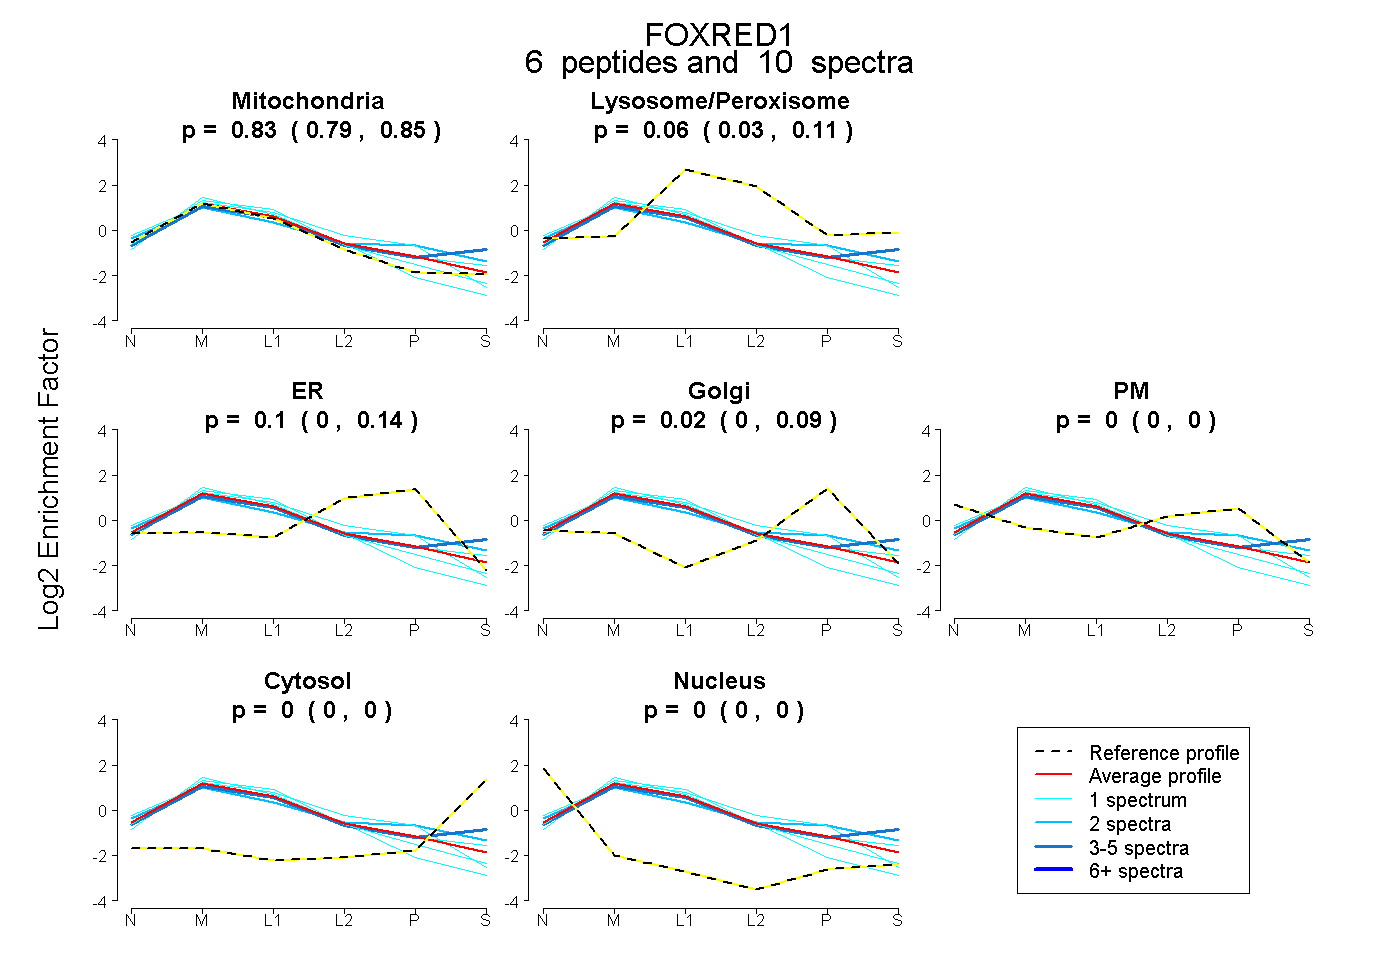 |
0.826 0.787 | 0.848 |
0.060 0.026 | 0.114 |
0.097 0.000 | 0.136 |
0.017 0.000 | 0.089 |
0.000 0.000 | 0.000 |
0.000 0.000 | 0.000 |
0.000 0.000 | 0.000 |
|||
| Plot | Lyso | Other | |||||||||||
| Expt C |
16 peptides |
92 spectra |
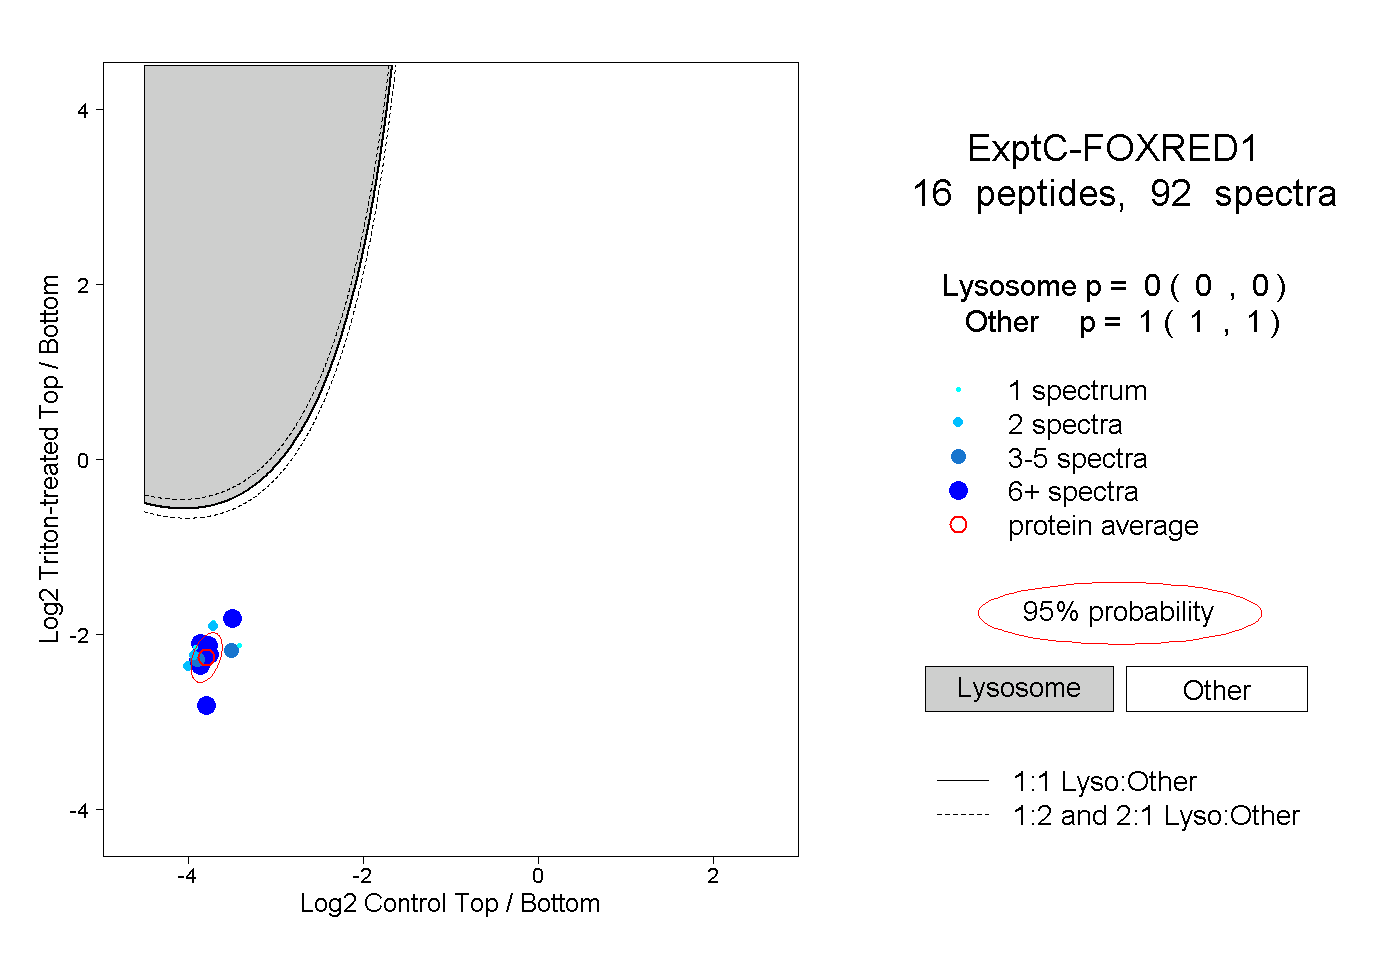 |
0.000 0.000 | 0.000 |
1.000 1.000 | 1.000 |
||||||||
| Plot | Lyso | Other | |||||||||||
| Expt D |
6 peptides |
9 spectra |
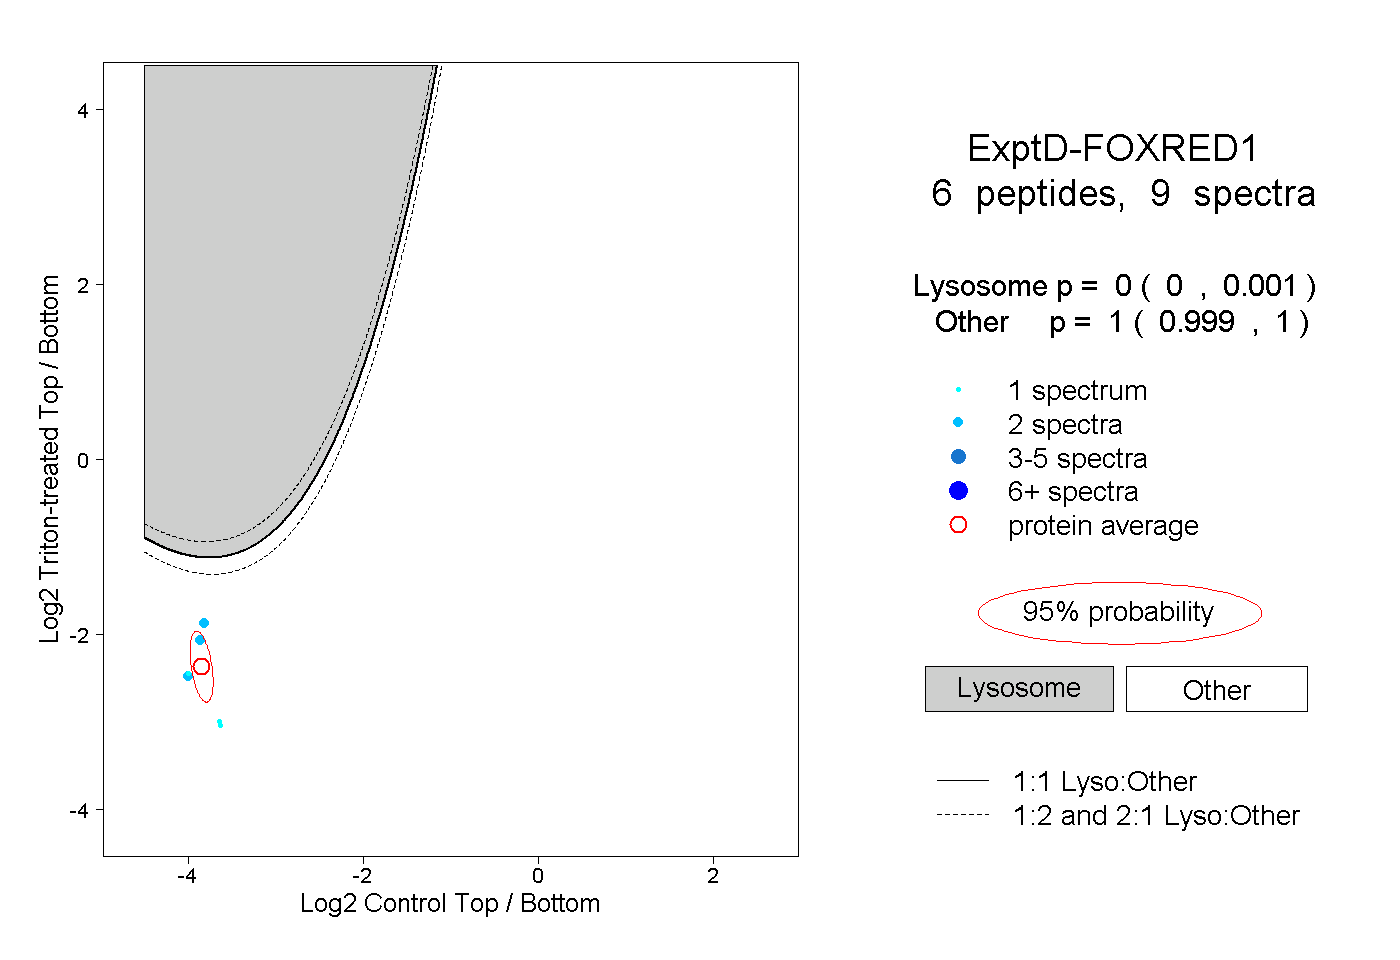 |
0.000 0.000 | 0.001 |
1.000 0.999 | 1.000 |