FOXRED1
[ENSRNOP00000036217]
Main page
| | | Plot |
Mito |
Lyso |
|
Perox |
ER |
Golgi |
PM |
Cytosol |
Nucleus |
|
| Expt A |
 9
9
peptides |
21
spectra |
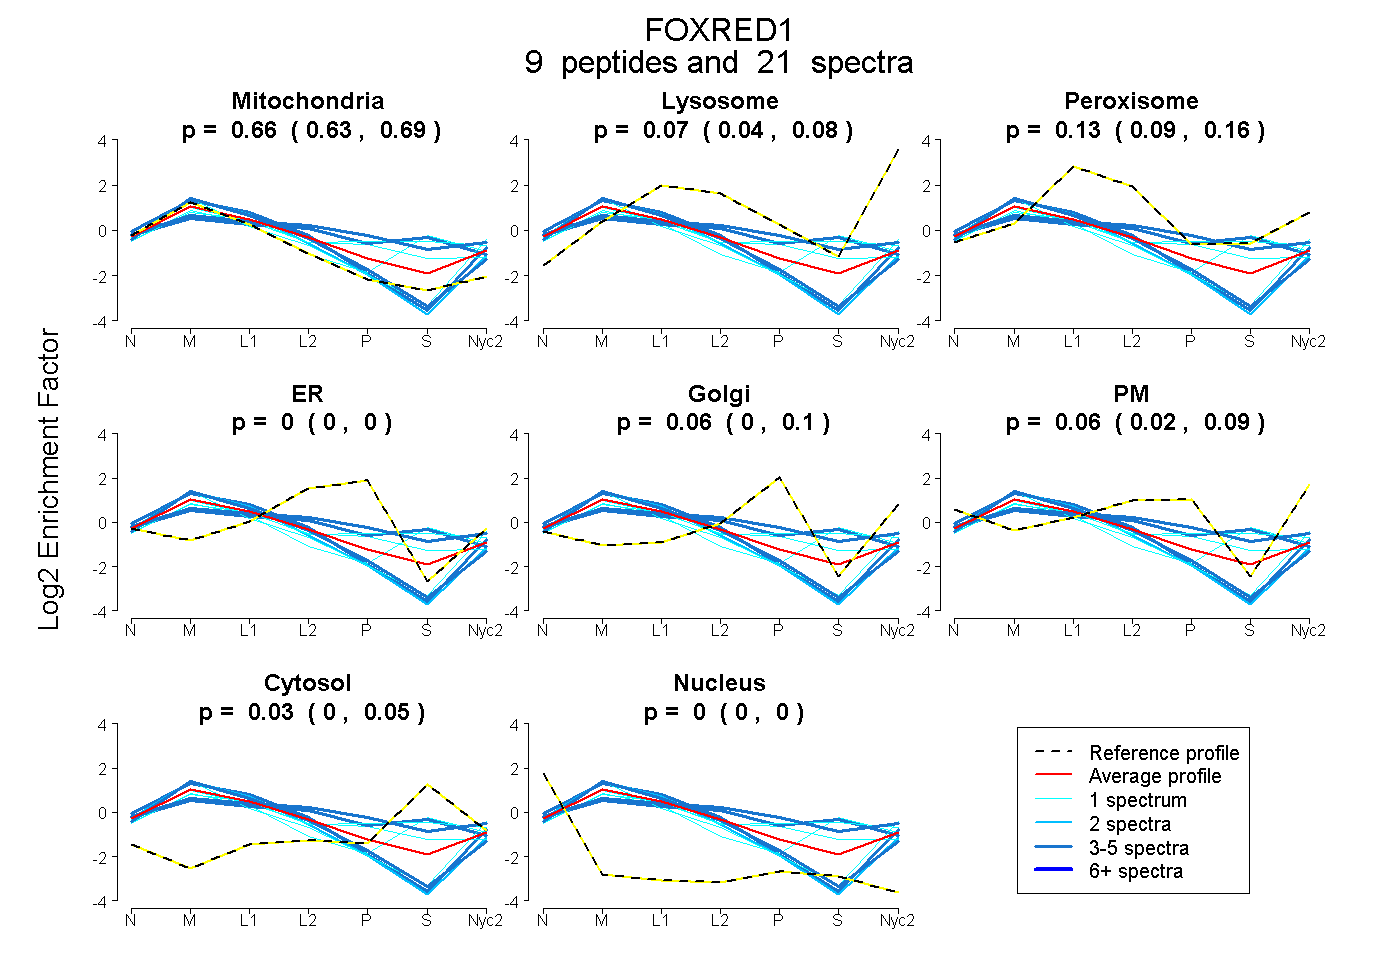 |
0.664
0.634 | 0.686 |
0.067
0.044 | 0.084 |
|
0.128
0.090 | 0.159 |
0.000
0.000 | 0.000 |
0.055
0.000 | 0.097 |
0.058
0.018 | 0.092 |
0.028
0.000 | 0.054 |
0.000
0.000 | 0.000 |
|
| | | Plot |
Mito |
|
Lyso or Perox |
|
ER |
Golgi |
PM |
Cytosol |
Nucleus |
|
| Expt B |
6
peptides |
10
spectra |
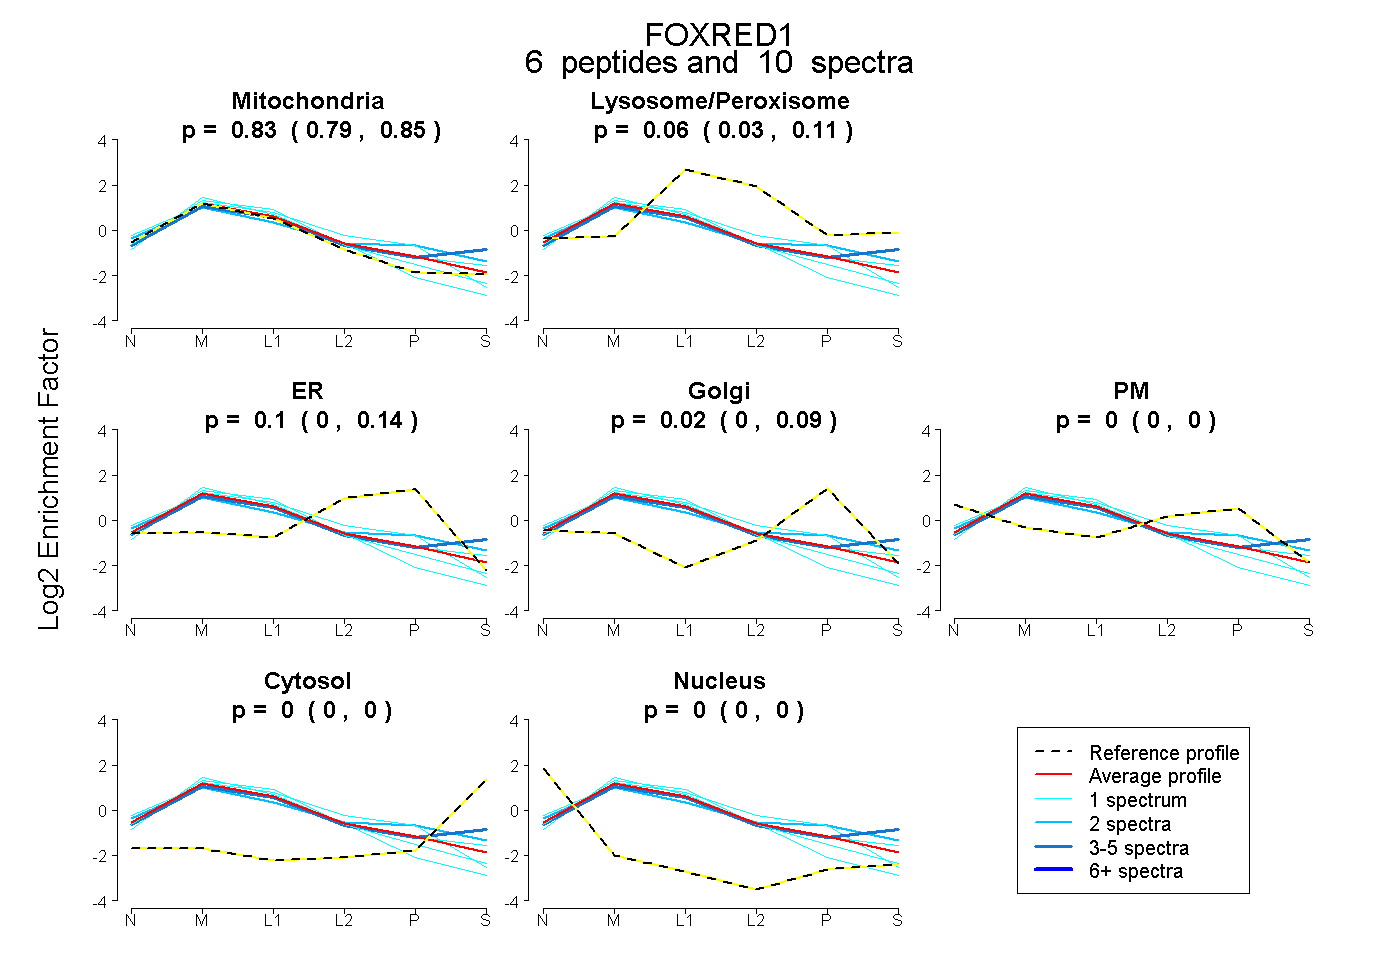 |
0.826
0.787 | 0.848 |
|
0.060
0.026 | 0.114 |
|
0.097
0.000 | 0.136 |
0.017
0.000 | 0.089 |
0.000
0.000 | 0.000 |
0.000
0.000 | 0.000 |
0.000
0.000 | 0.000 |
|
| 1 spectrum, LPVEPR |
0.939 |
|
0.029 |
|
0.033 |
0.000 |
0.000 |
0.000 |
0.000 |
|
| 1 spectrum, GLPGTLQGTK |
0.730 |
|
0.038 |
|
0.232 |
0.000 |
0.000 |
0.000 |
0.000 |
|
| 1 spectrum, AVAEMILEGHFK |
1.000 |
|
0.000 |
|
0.000 |
0.000 |
0.000 |
0.000 |
0.000 |
|
| 2 spectra, FNPSGCLLLASEK |
0.633 |
|
0.156 |
|
0.000 |
0.211 |
0.000 |
0.000 |
0.000 |
|
| 1 spectrum, DAATLESNVR |
0.763 |
|
0.097 |
|
0.000 |
0.013 |
0.126 |
0.000 |
0.000 |
|
| 4 spectra, GLQHAPGIGR |
0.682 |
|
0.179 |
|
0.000 |
0.023 |
0.000 |
0.116 |
0.000 |
|
| | | Plot |
|
Lyso |
|
|
|
|
|
|
|
Other |
| Expt C |
16
peptides |
92
spectra |
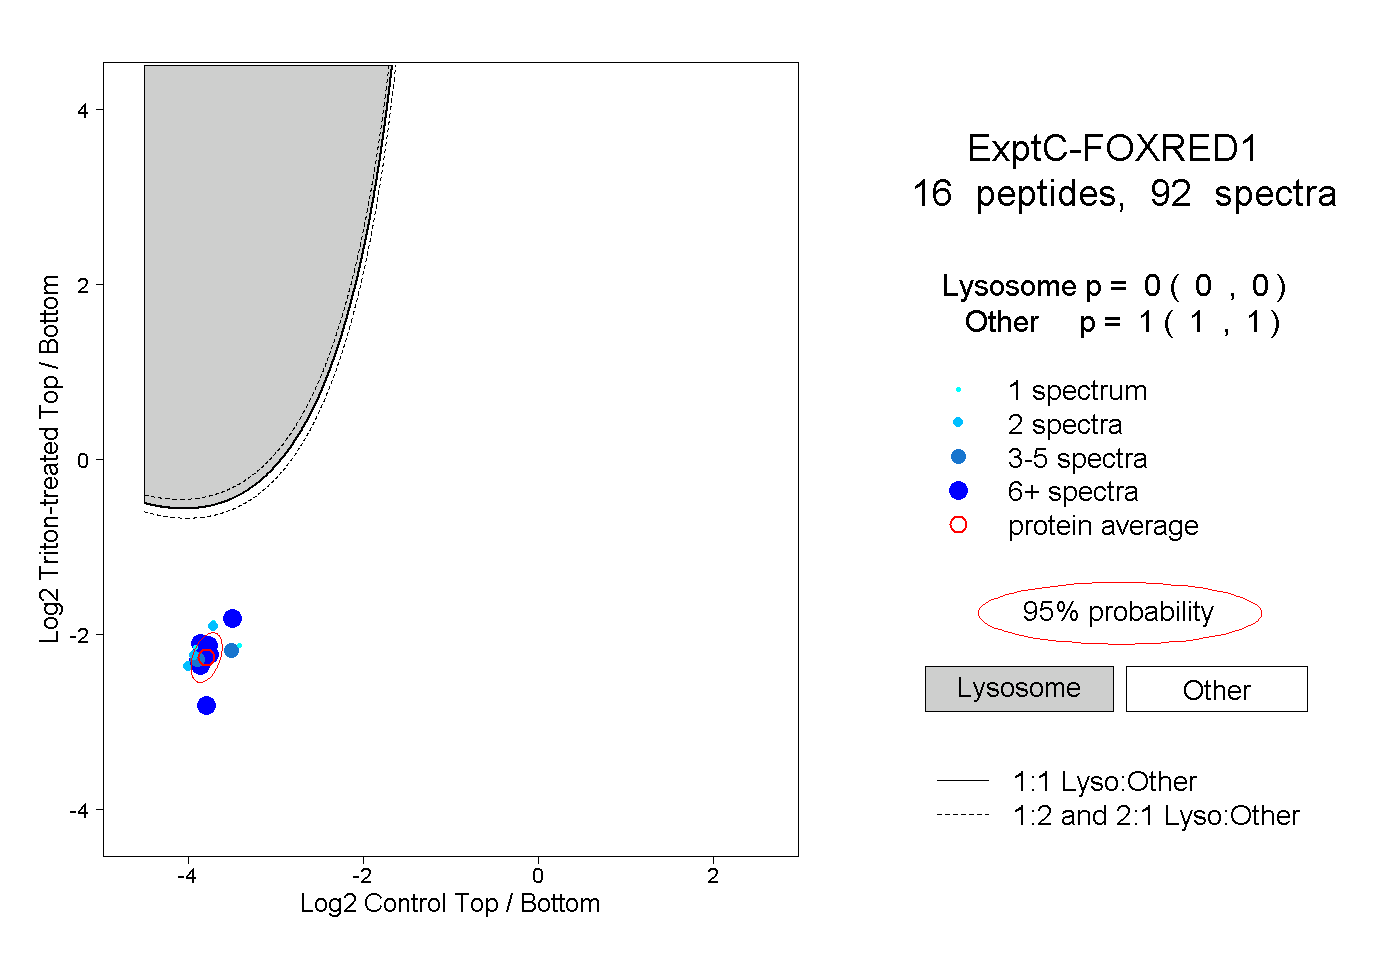 |
|
0.000
0.000 | 0.000 |
|
|
|
|
|
|
|
1.000
1.000 | 1.000 |
| | | Plot |
|
Lyso |
|
|
|
|
|
|
|
Other |
| Expt D |
6
peptides |
9
spectra |
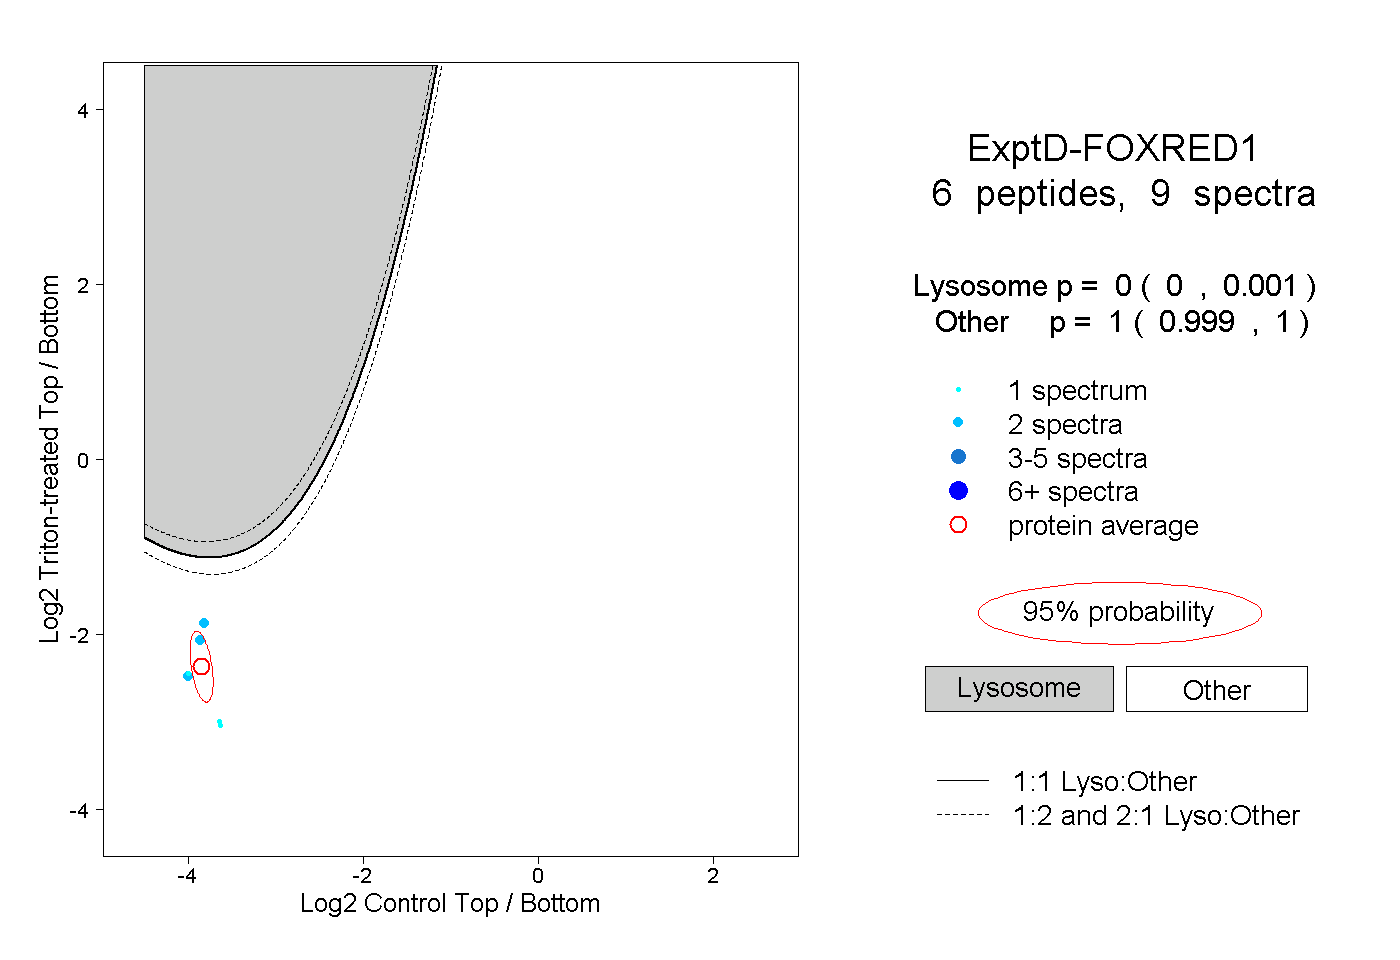 |
|
0.000
0.000 | 0.001 |
|
|
|
|
|
|
|
1.000
0.999 | 1.000 |