 26
26peptides
spectra
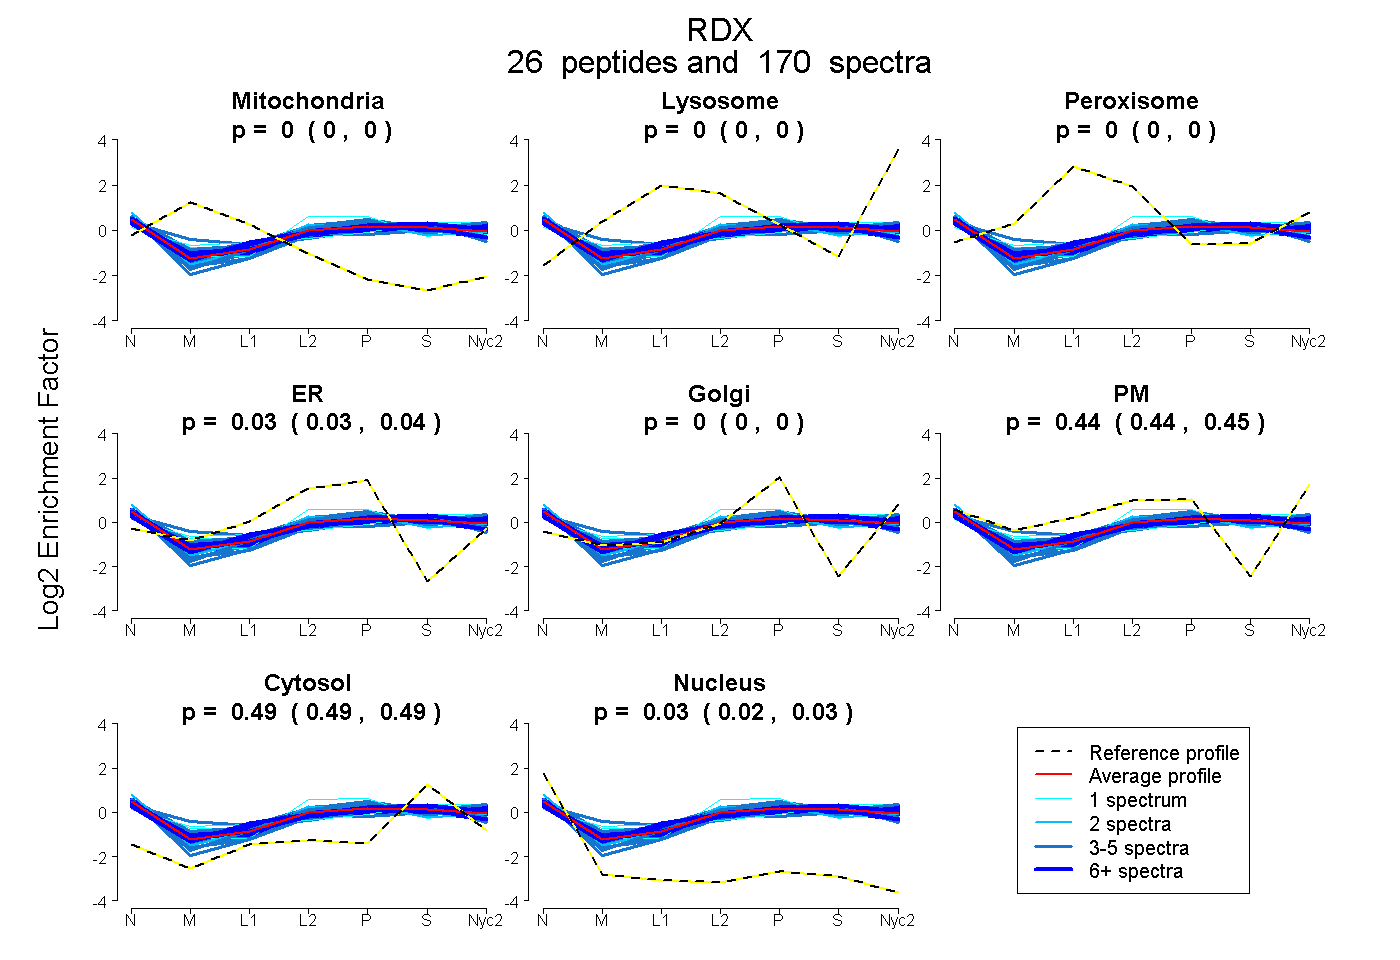
0.000 | 0.000
0.000 | 0.000
0.001 | 0.004
0.032 | 0.037
0.000 | 0.000
0.440 | 0.445
0.493 | 0.495
0.024 | 0.026
15peptides
spectra
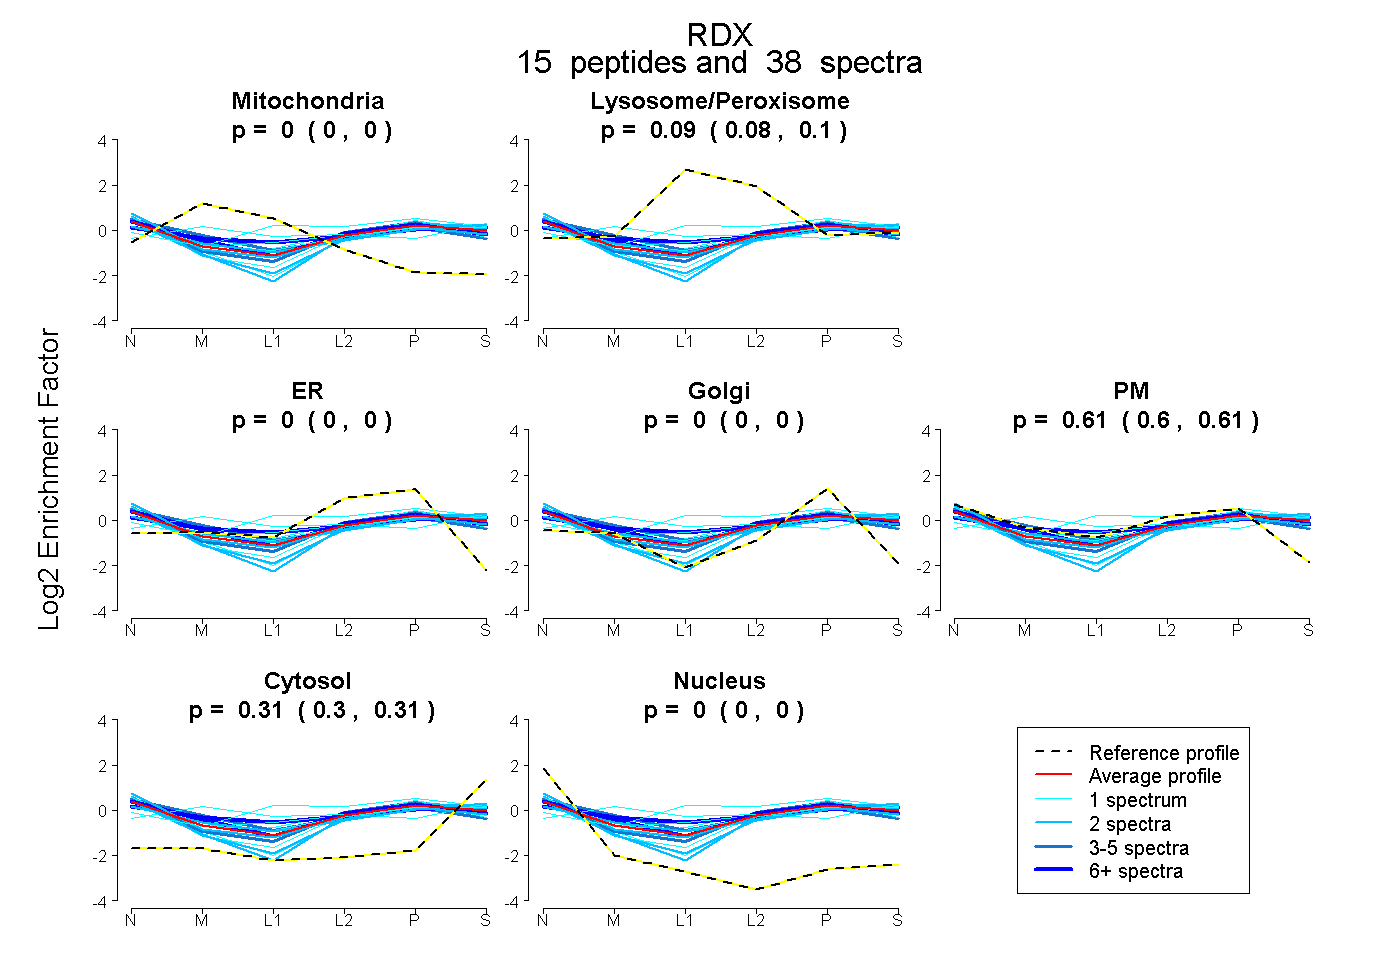
0.000 | 0.000
0.080 | 0.096
0.000 | 0.000
0.000 | 0.000
0.598 | 0.612
0.302 | 0.310
0.000 | 0.000
23peptides
spectra

0.000 | 0.000
1.000 | 1.000
14peptides
spectra
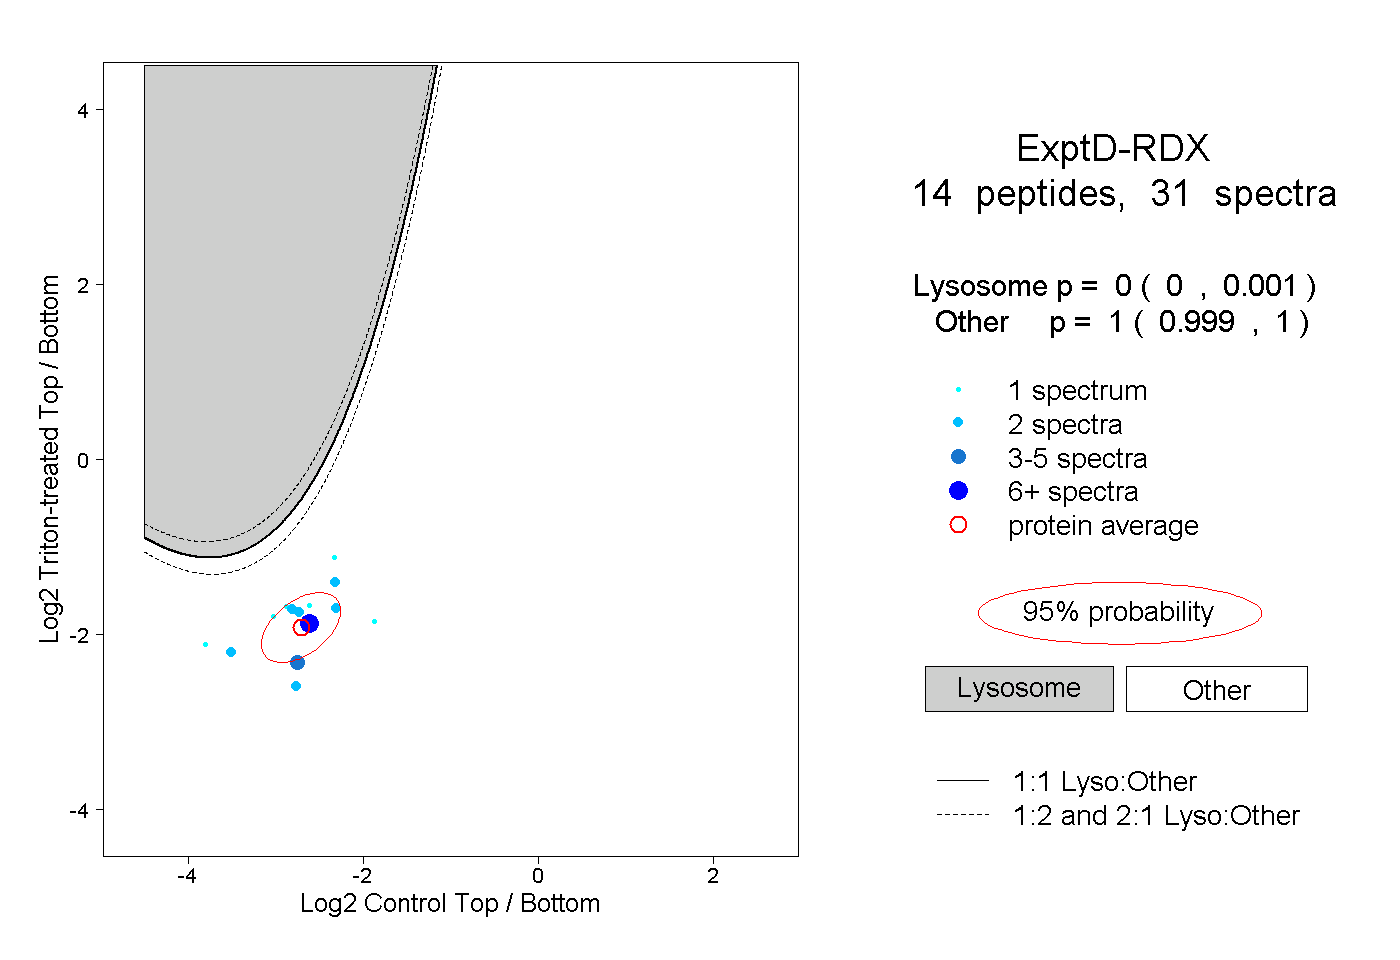
0.000 | 0.001
0.999 | 1.000