| 8 spectra, IQNWHEEHR |
0.000 |
|
0.076 |
|
0.000 |
0.000 |
0.653 |
0.271 |
0.000 |
|
| 1 spectrum, EEEWER |
0.000 |
|
0.000 |
|
0.000 |
0.101 |
0.594 |
0.293 |
0.012 |
|
| 1 spectrum, AFAAQEDLEK |
0.000 |
|
0.000 |
|
0.000 |
0.026 |
0.670 |
0.304 |
0.000 |
|
| 1 spectrum, AAEEAK |
0.000 |
|
0.162 |
|
0.000 |
0.000 |
0.532 |
0.306 |
0.000 |
|
| 2 spectra, IAQDLEMYGVNYFEIK |
0.000 |
|
0.000 |
|
0.000 |
0.143 |
0.490 |
0.367 |
0.000 |
|
| 7 spectra, EIHKPGYLANDR |
0.000 |
|
0.215 |
|
0.000 |
0.000 |
0.478 |
0.307 |
0.000 |
|
| 1 spectrum, QLQALSSELAQAR |
0.000 |
|
0.474 |
|
0.000 |
0.307 |
0.034 |
0.184 |
0.000 |
|
| 5 spectra, ELEEQTR |
0.000 |
|
0.034 |
|
0.000 |
0.000 |
0.674 |
0.292 |
0.000 |
|
| 2 spectra, EVWFFGLQYVDSK |
0.000 |
|
0.000 |
|
0.000 |
0.028 |
0.616 |
0.356 |
0.000 |
|
| 1 spectrum, FFPEDVSEELIQEITQR |
0.000 |
|
0.149 |
|
0.000 |
0.000 |
0.639 |
0.212 |
0.000 |
|
| 3 spectra, AQLENEK |
0.000 |
|
0.089 |
|
0.000 |
0.000 |
0.666 |
0.245 |
0.000 |
|
| 2 spectra, TQNDVLHAENVK |
0.000 |
|
0.135 |
|
0.000 |
0.000 |
0.495 |
0.370 |
0.000 |
|
| 1 spectrum, NQEQLAAELAEFTAK |
0.099 |
|
0.309 |
|
0.000 |
0.052 |
0.215 |
0.326 |
0.000 |
|
| 2 spectra, PKPINVR |
0.000 |
|
0.041 |
|
0.000 |
0.000 |
0.678 |
0.282 |
0.000 |
|
| 1 spectrum, QAADQMK |
0.000 |
|
0.133 |
|
0.000 |
0.000 |
0.552 |
0.315 |
0.000 |
|
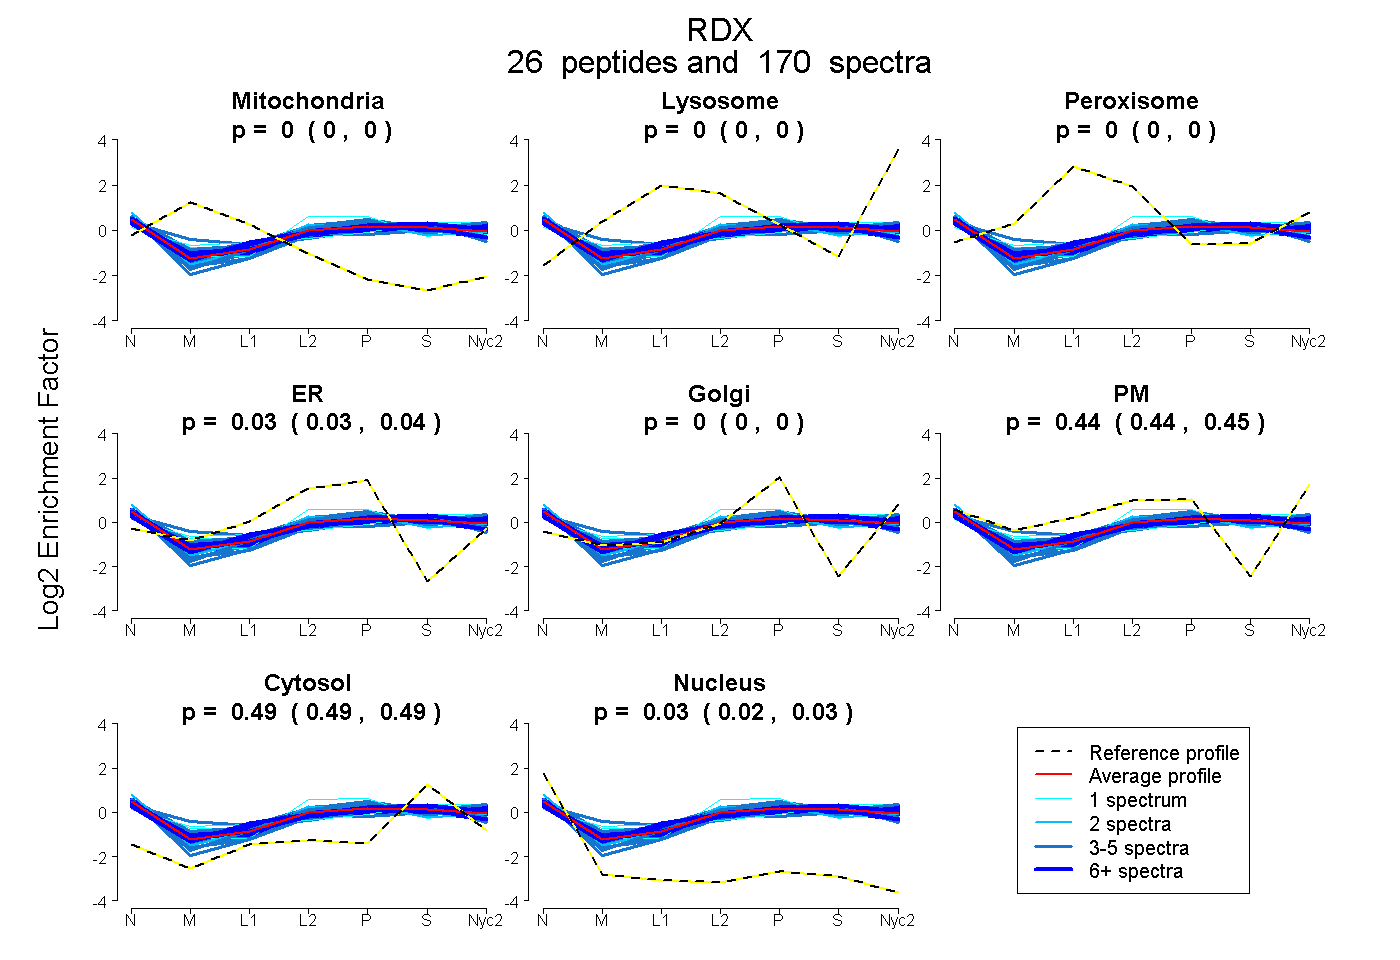
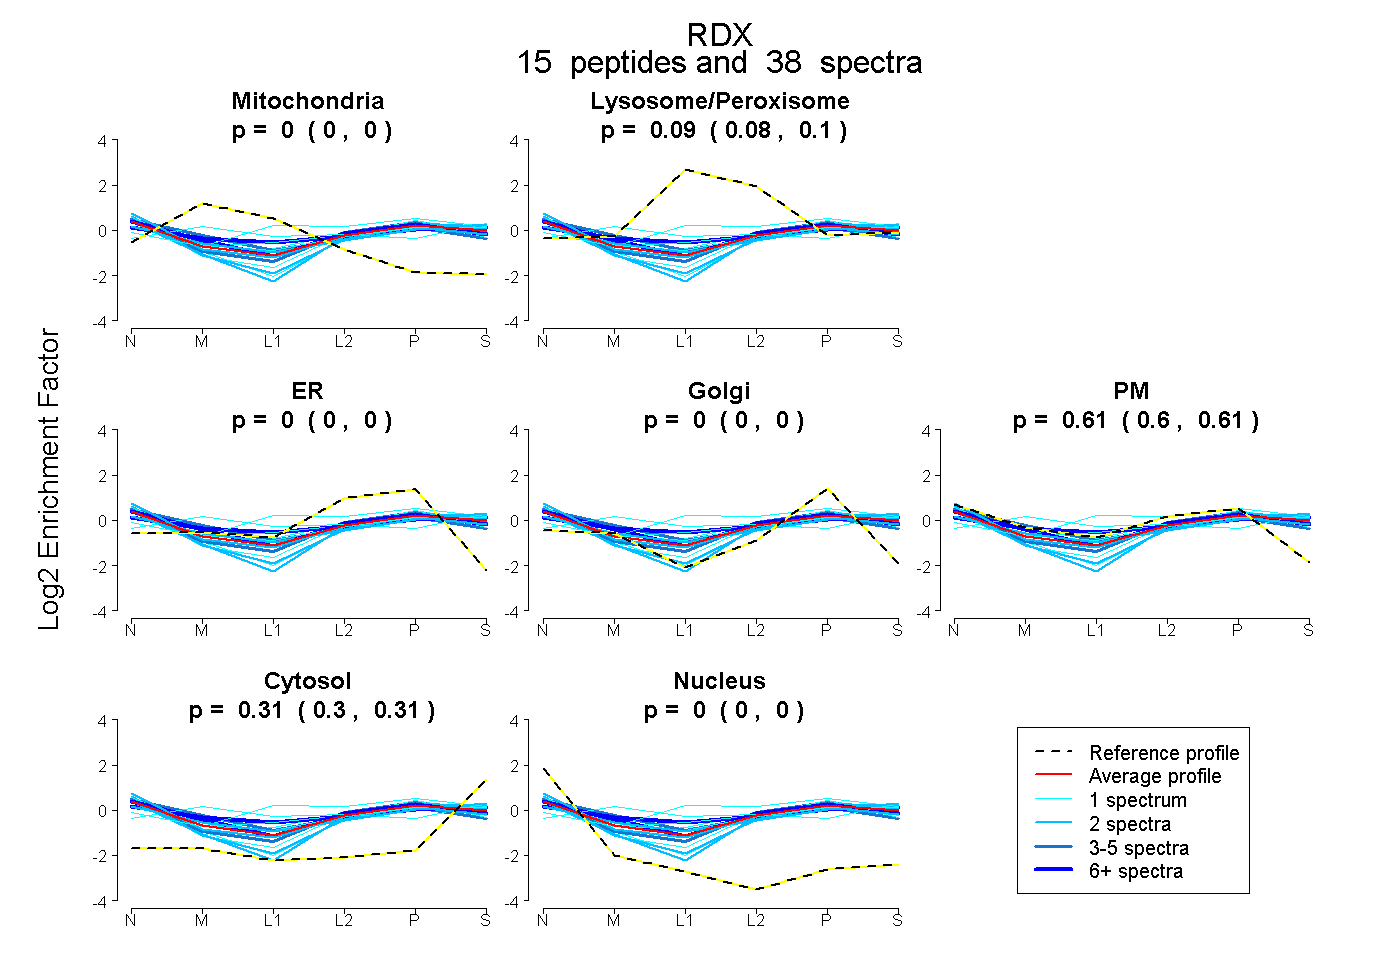
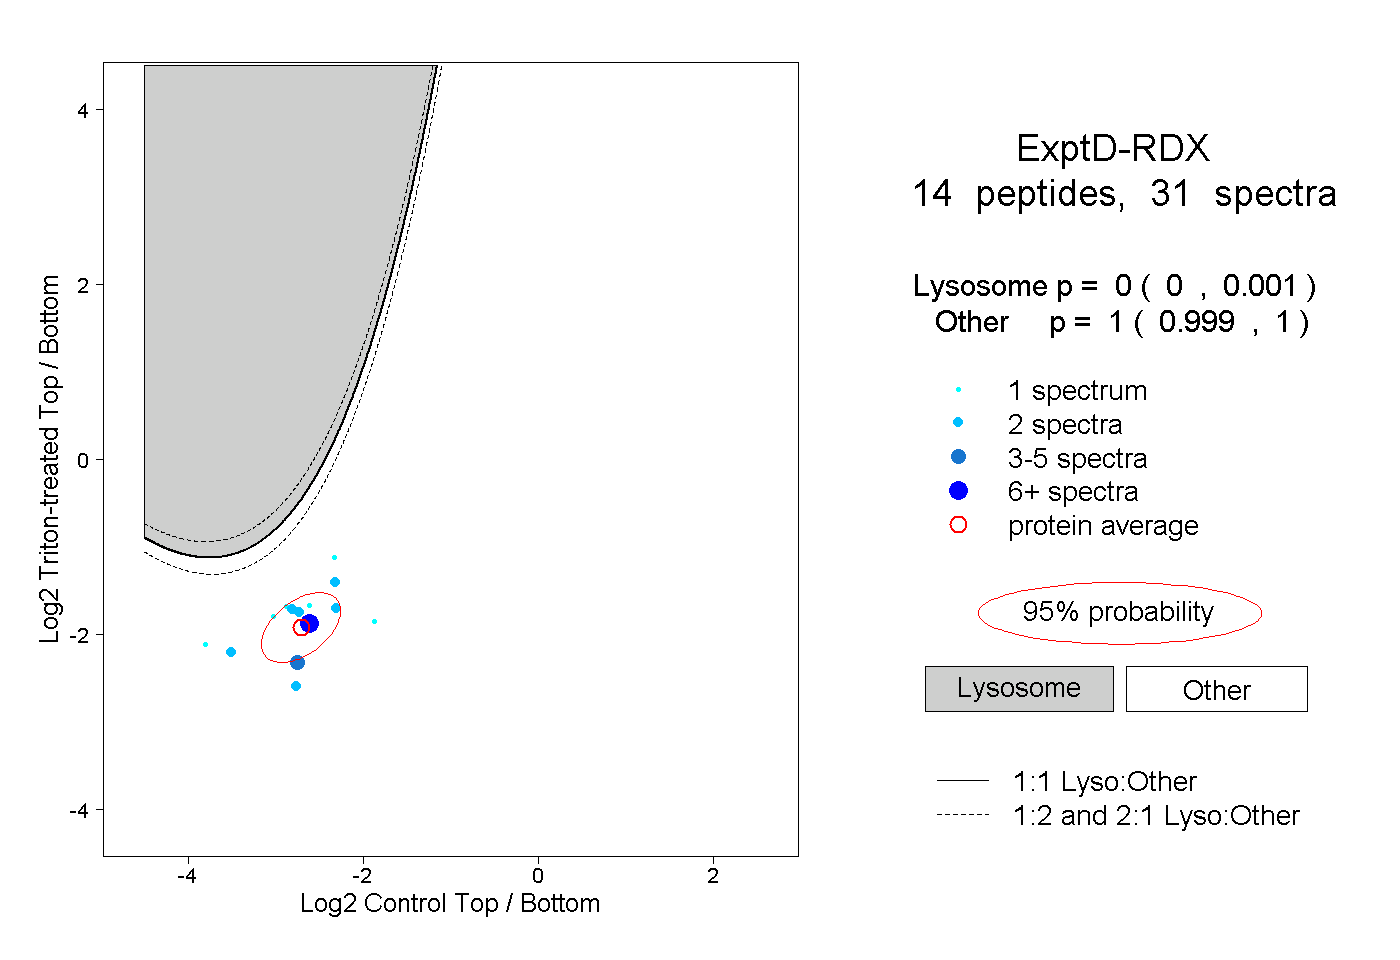
 26
26