 11
11peptides
spectra
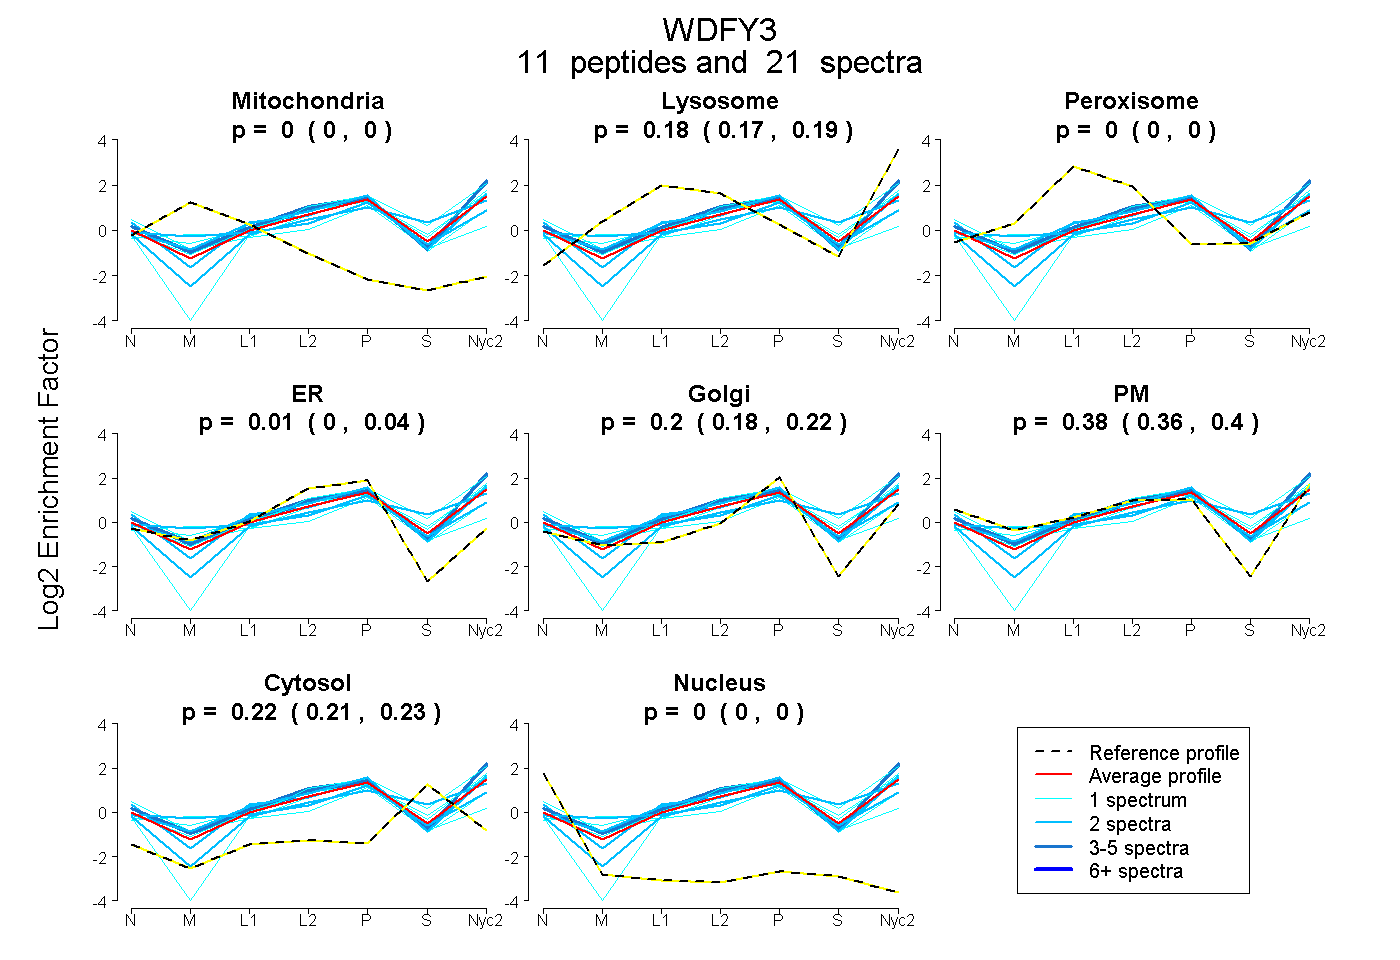
0.000 | 0.000
0.169 | 0.195
0.000 | 0.000
0.000 | 0.041
0.175 | 0.219
0.357 | 0.401
0.212 | 0.230
0.000 | 0.000
2peptides
spectra
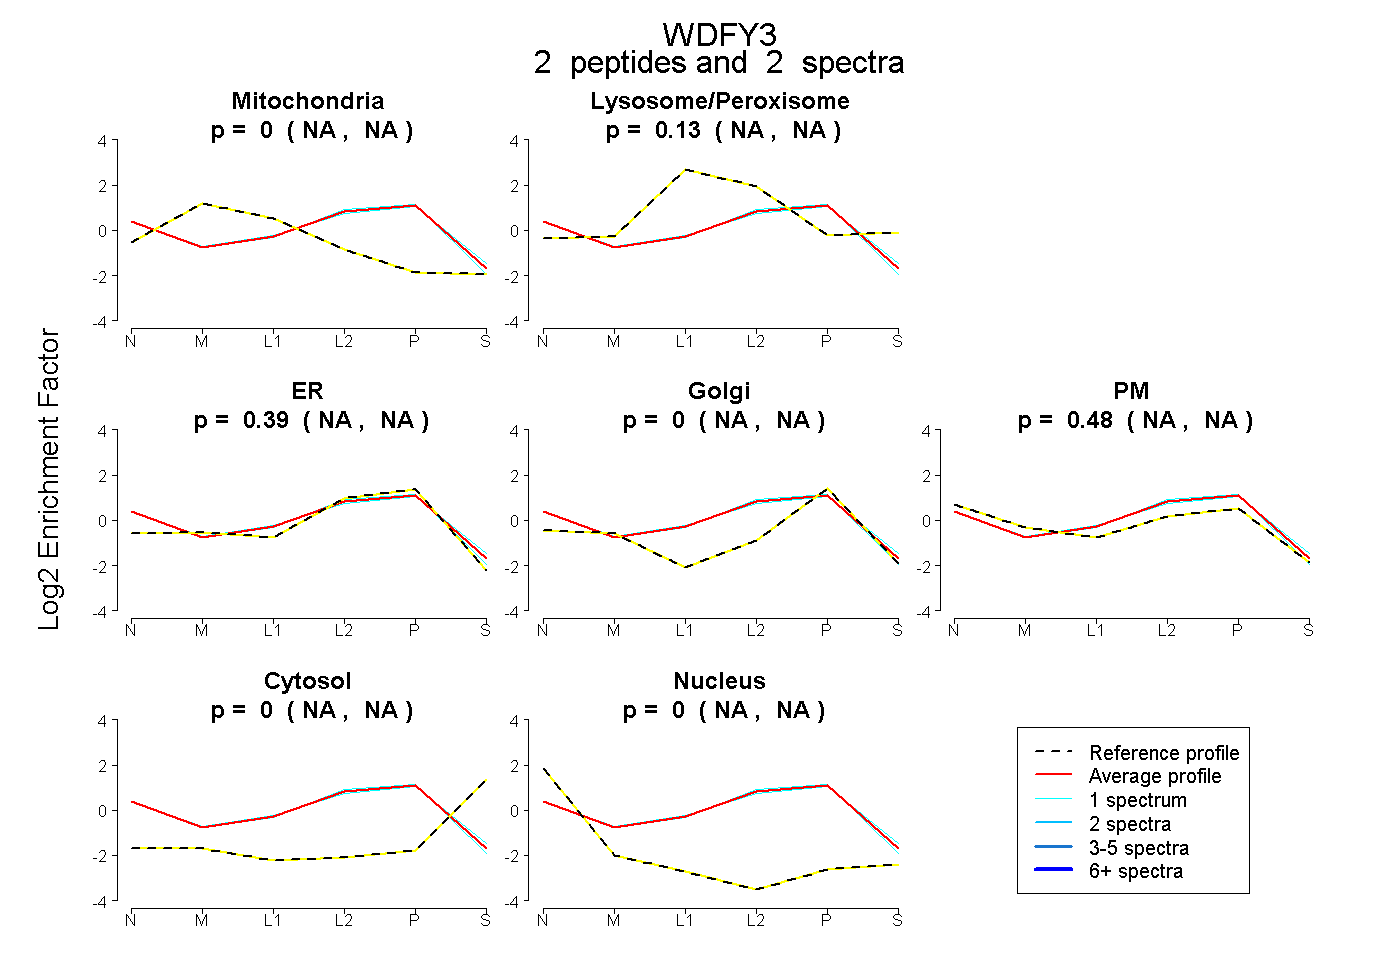
NA | NA
NA | NA
NA | NA
NA | NA
NA | NA
NA | NA
NA | NA
21peptides
spectra
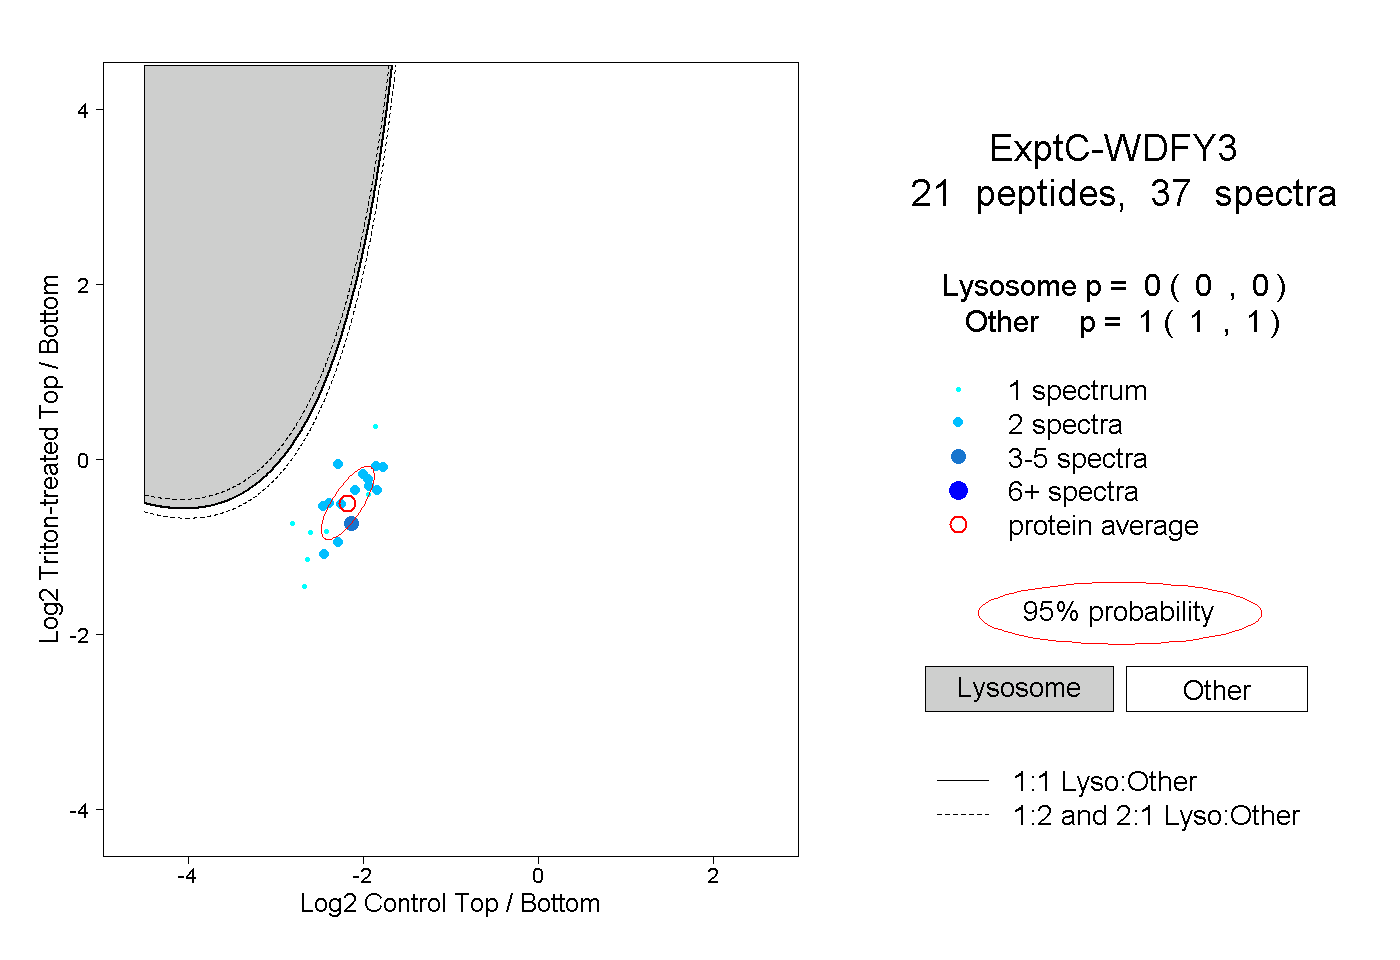
0.000 | 0.000
1.000 | 1.000
1peptide
spectrum
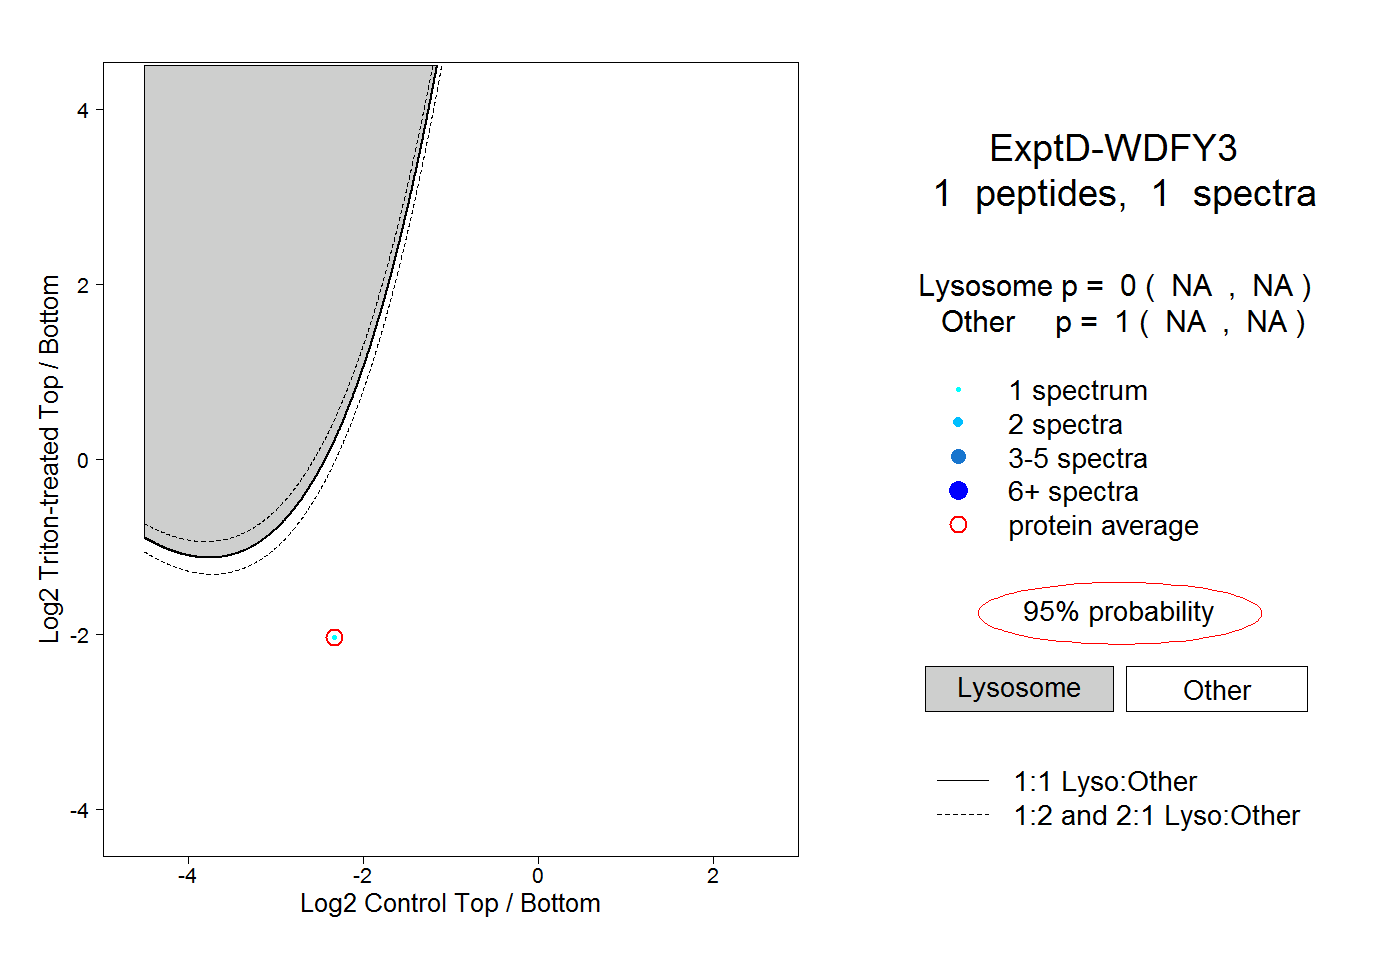
NA | NA
NA | NA