WDFY3
[ENSRNOP00000035517]
Main page
| | | Plot |
Mito |
Lyso |
|
Perox |
ER |
Golgi |
PM |
Cytosol |
Nucleus |
|
| Expt A |
 11
11
peptides |
21
spectra |
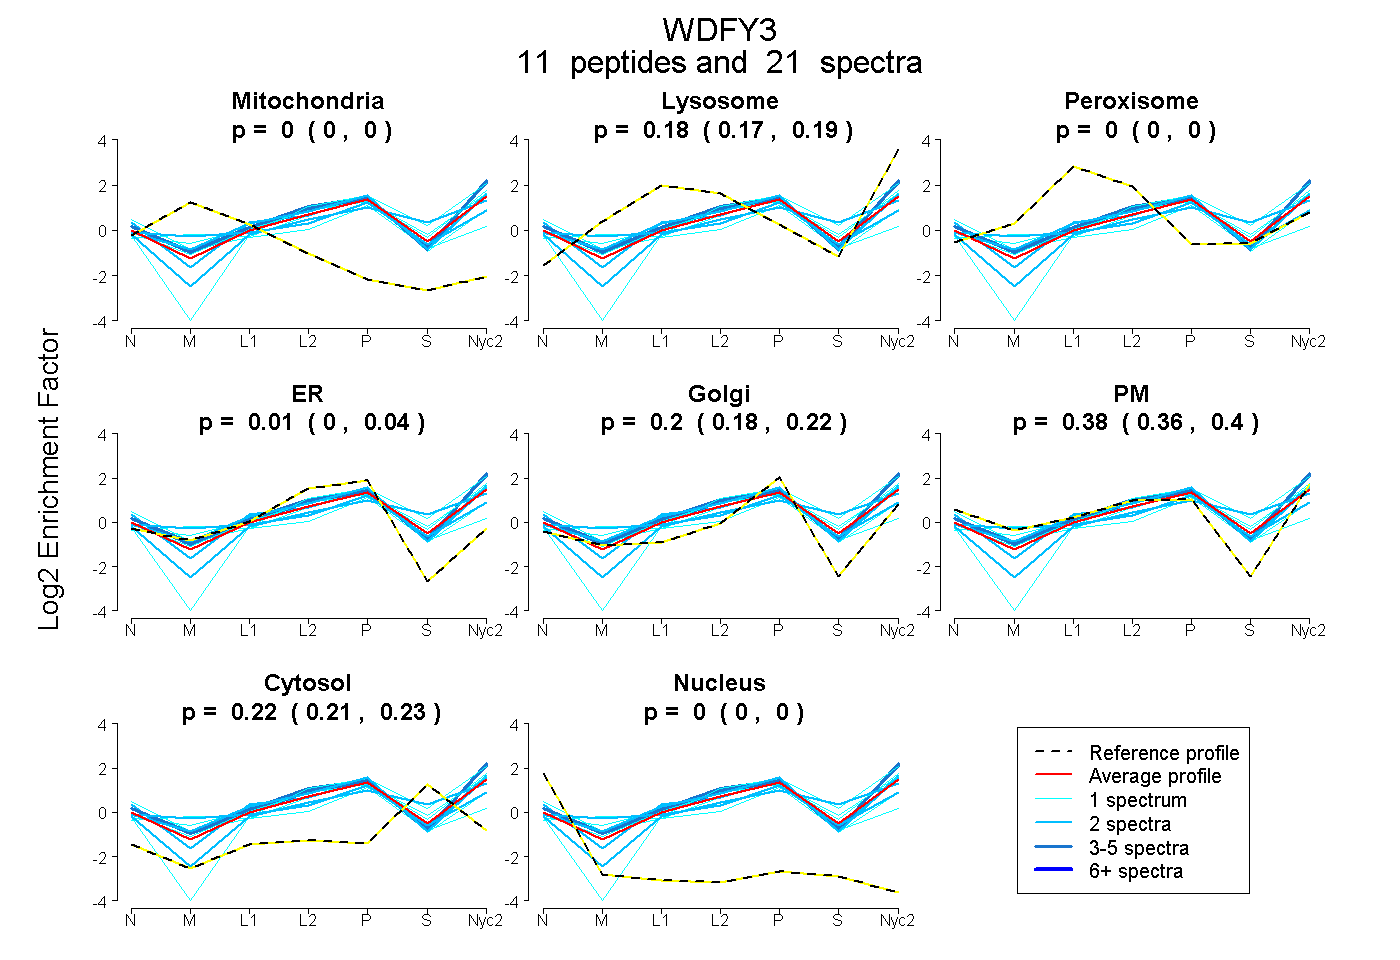 |
0.000
0.000 | 0.000 |
0.183
0.169 | 0.195 |
|
0.000
0.000 | 0.000 |
0.012
0.000 | 0.041 |
0.202
0.175 | 0.219 |
0.382
0.357 | 0.401 |
0.221
0.212 | 0.230 |
0.000
0.000 | 0.000 |
|
| | | Plot |
Mito |
|
Lyso or Perox |
|
ER |
Golgi |
PM |
Cytosol |
Nucleus |
|
| Expt B |
2
peptides |
2
spectra |
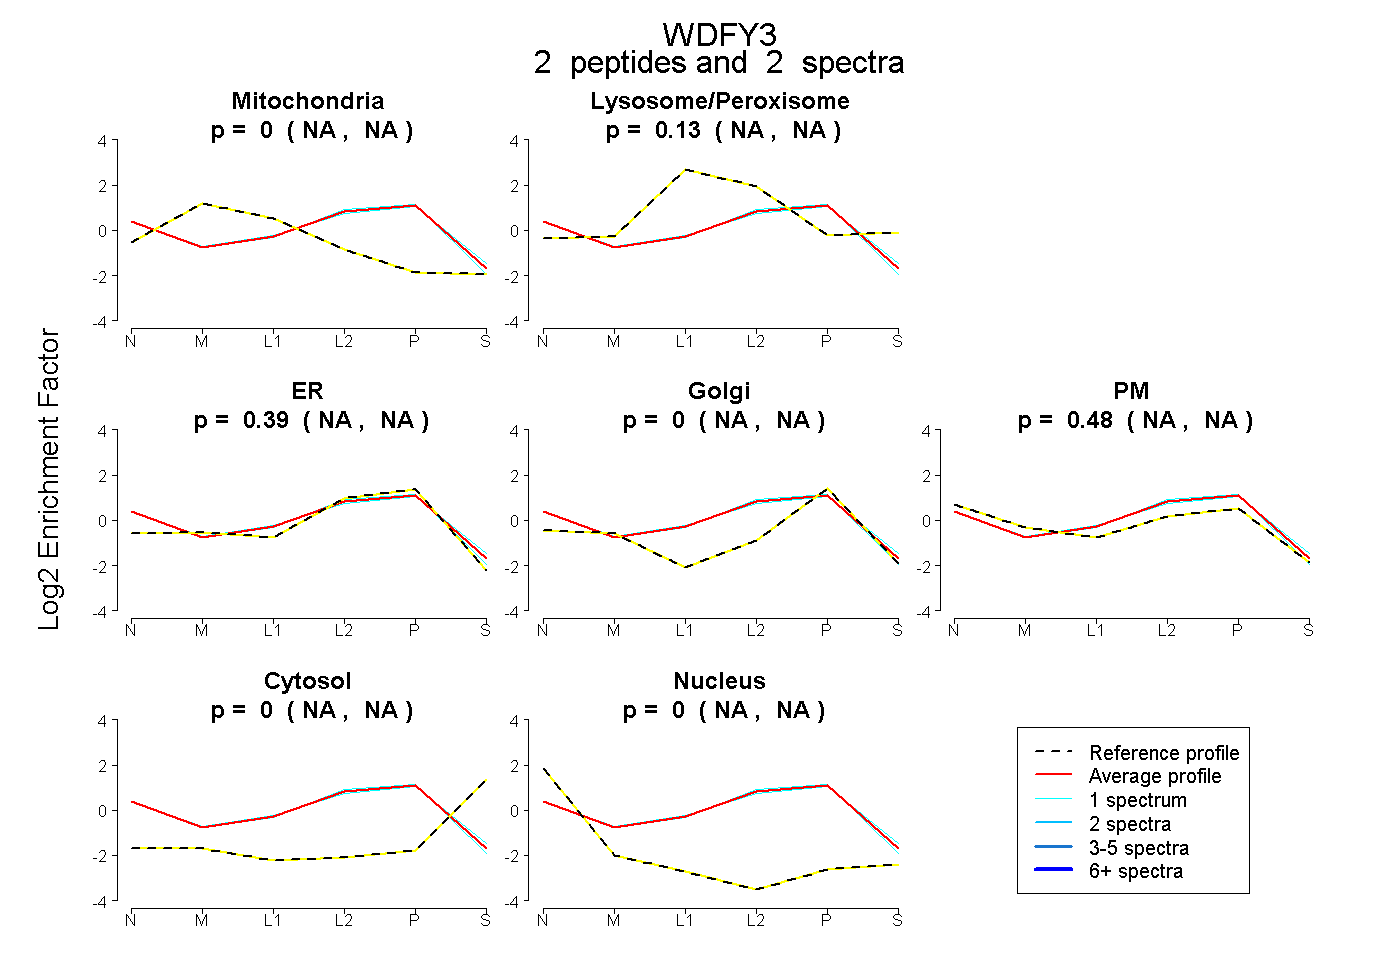 |
0.000
NA | NA |
|
0.127
NA | NA |
|
0.395
NA | NA |
0.000
NA | NA |
0.479
NA | NA |
0.000
NA | NA |
0.000
NA | NA |
|
| | | Plot |
|
Lyso |
|
|
|
|
|
|
|
Other |
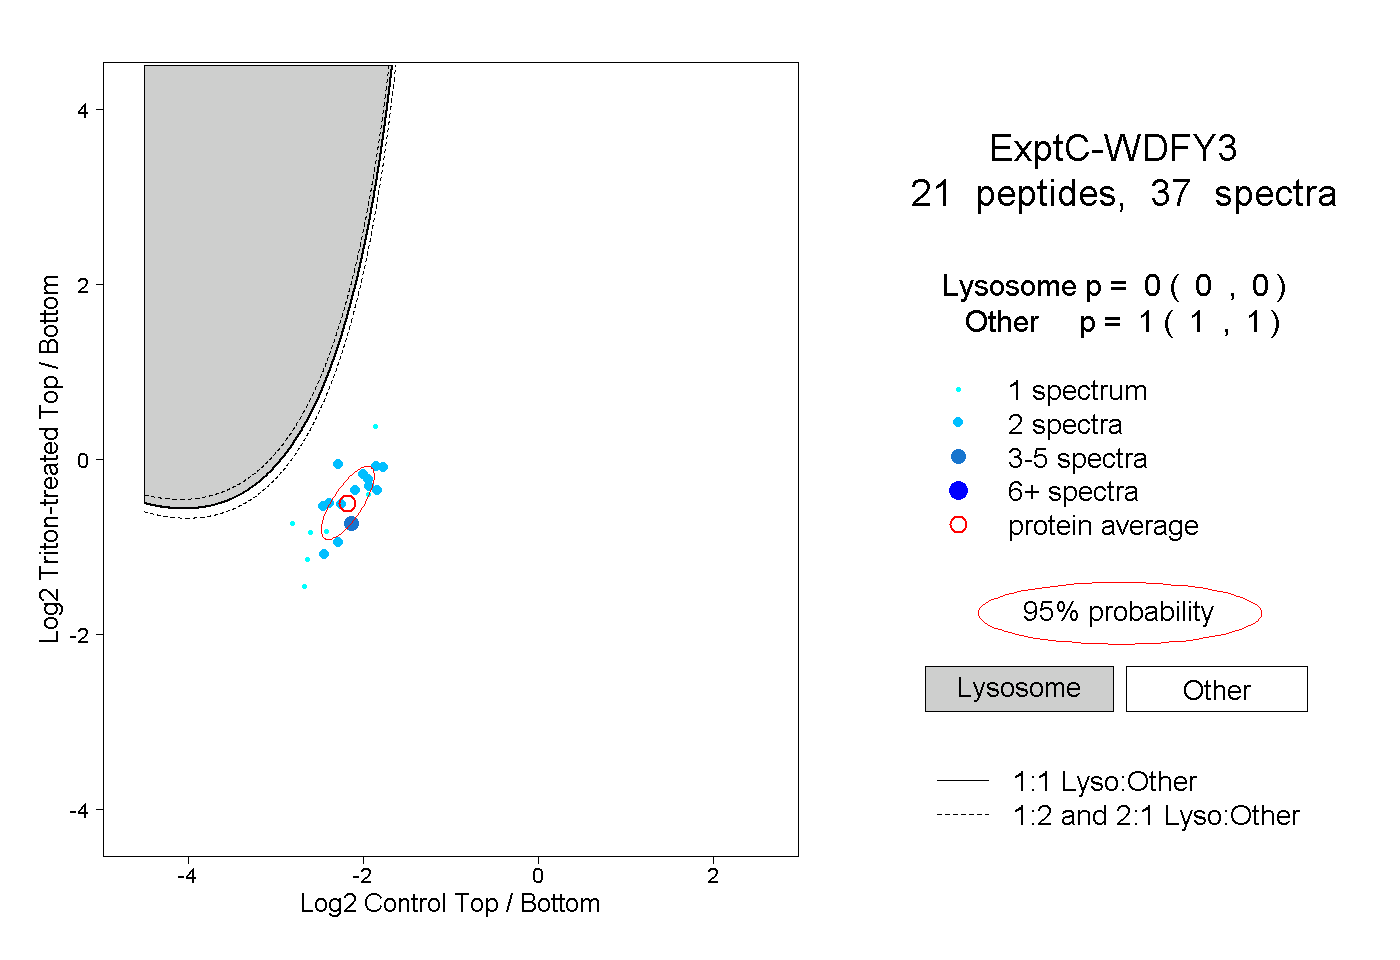
| Expt C |
21
peptides |
37
spectra |
 |
|
0.000
0.000 | 0.000 |
|
|
|
|
|
|
|
1.000
1.000 | 1.000 |
| 1 spectrum, QGPSQLK |
|
0.000 |
|
|
|
|
|
|
|
1.000 |
| 1 spectrum, LADAVR |
|
0.000 |
|
|
|
|
|
|
|
1.000 |
| 2 spectra, ALLSVLR |
|
0.000 |
|
|
|
|
|
|
|
1.000 |
| 2 spectra, HDYIFK |
|
0.000 |
|
|
|
|
|
|
|
1.000 |
| 2 spectra, LSFLTQLR |
|
0.000 |
|
|
|
|
|
|
|
1.000 |
| 4 spectra, VWTELIHSK |
|
0.000 |
|
|
|
|
|
|
|
1.000 |
| 1 spectrum, MEPFTQIFLR |
|
0.000 |
|
|
|
|
|
|
|
1.000 |
| 1 spectrum, LLITIR |
|
0.000 |
|
|
|
|
|
|
|
1.000 |
| 2 spectra, AKPLTLK |
|
0.000 |
|
|
|
|
|
|
|
1.000 |
| 1 spectrum, YEPANSHFFK |
|
0.000 |
|
|
|
|
|
|
|
1.000 |
| 2 spectra, EFQLIPK |
|
0.000 |
|
|
|
|
|
|
|
1.000 |
| 2 spectra, SNPLASK |
|
0.000 |
|
|
|
|
|
|
|
1.000 |
| 2 spectra, AFAADTGMNR |
|
0.000 |
|
|
|
|
|
|
|
1.000 |
| 2 spectra, NLAKPMGAQTDER |
|
0.000 |
|
|
|
|
|
|
|
1.000 |
| 2 spectra, VATDSFDSR |
|
0.000 |
|
|
|
|
|
|
|
1.000 |
| 2 spectra, NYLLAFQK |
|
0.000 |
|
|
|
|
|
|
|
1.000 |
| 1 spectrum, LFTELCHPPR |
|
0.000 |
|
|
|
|
|
|
|
1.000 |
| 2 spectra, FSLTER |
|
0.000 |
|
|
|
|
|
|
|
1.000 |
| 1 spectrum, VSLPVNDR |
|
0.000 |
|
|
|
|
|
|
|
1.000 |
| 2 spectra, VSSGFGLSK |
|
0.000 |
|
|
|
|
|
|
|
1.000 |
| 2 spectra, LLTVVR |
|
0.000 |
|
|
|
|
|
|
|
1.000 |
| | | Plot |
|
Lyso |
|
|
|
|
|
|
|
Other |
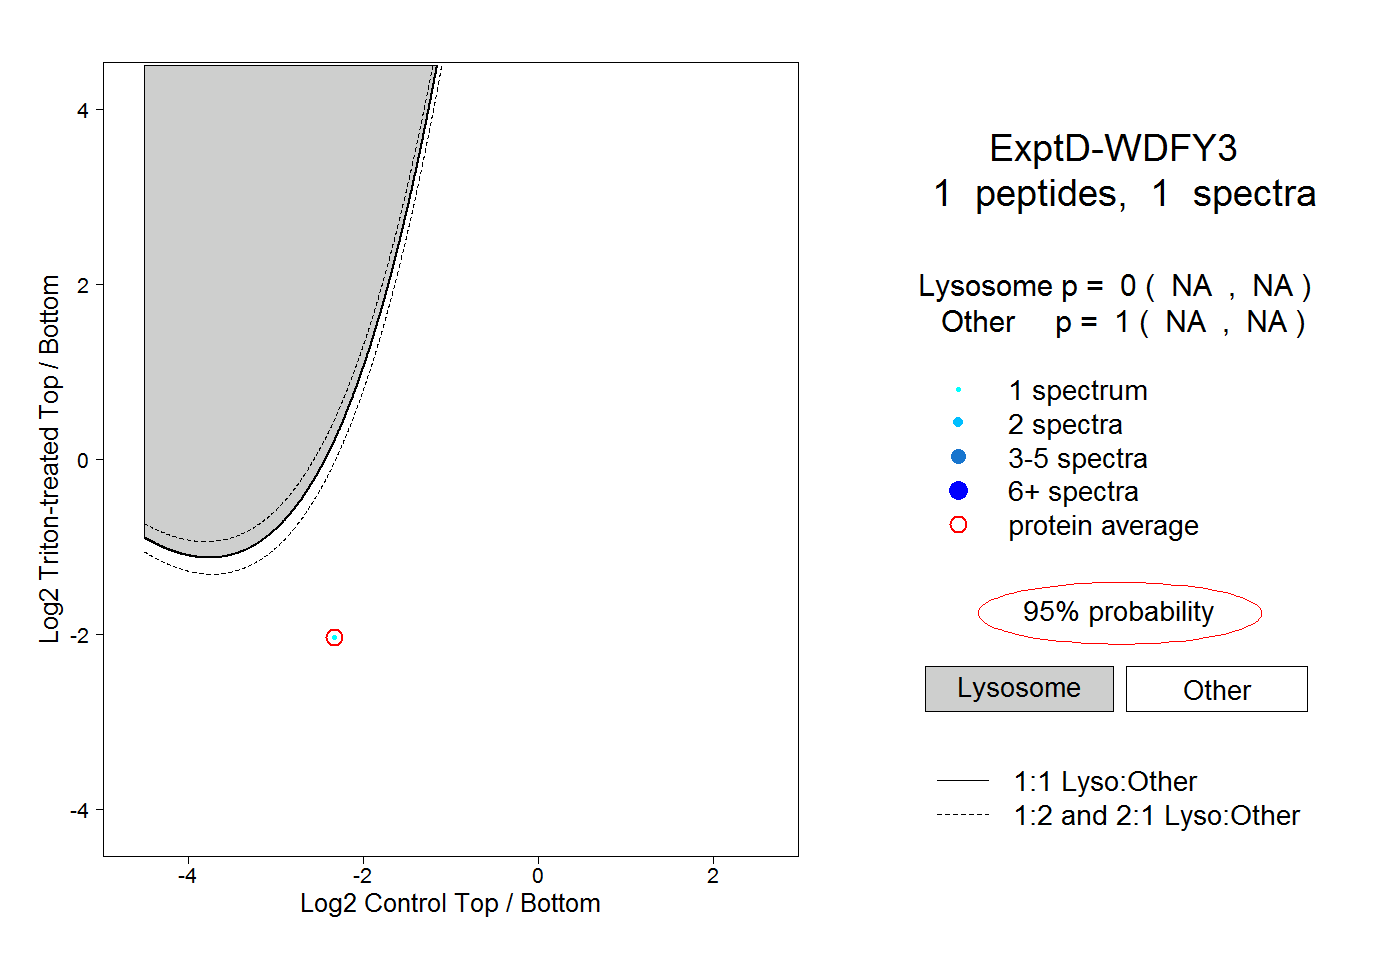
| Expt D |
1
peptide |
1
spectrum |
 |
|
0.000
NA | NA |
|
|
|
|
|
|
|
1.000
NA | NA |