 11
11peptides
spectra
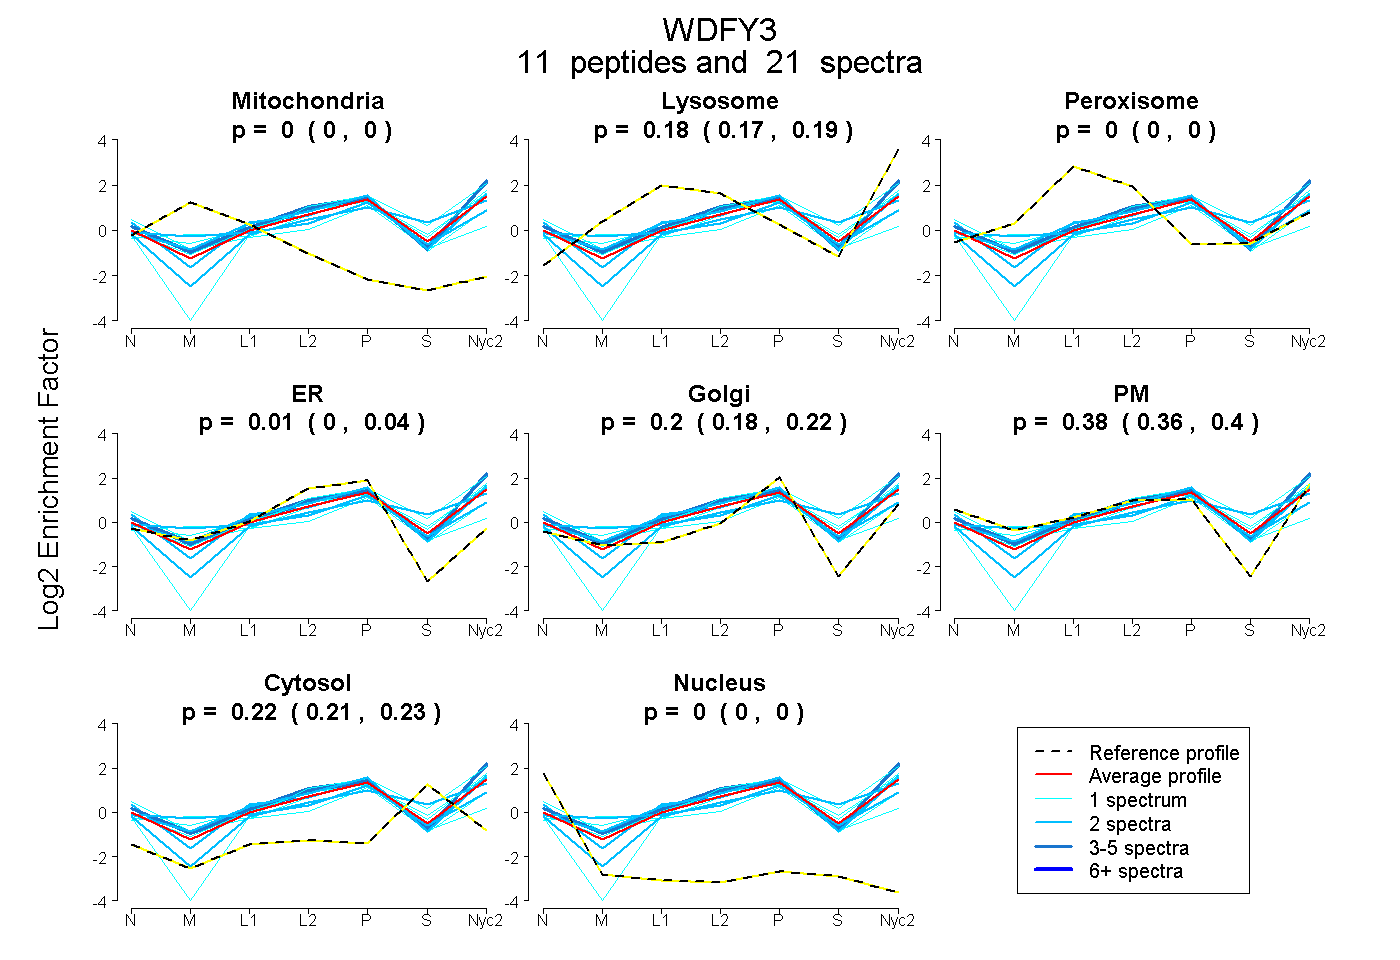
0.000 | 0.000
0.169 | 0.195
0.000 | 0.000
0.000 | 0.041
0.175 | 0.219
0.357 | 0.401
0.212 | 0.230
0.000 | 0.000
| Plot | Mito | Lyso | Perox | ER | Golgi | PM | Cytosol | Nucleus | |||||
| Expt A |
11 peptides |
21 spectra |
|
0.000 0.000 | 0.000 |
0.183 0.169 | 0.195 |
0.000 0.000 | 0.000 |
0.012 0.000 | 0.041 |
0.202 0.175 | 0.219 |
0.382 0.357 | 0.401 |
0.221 0.212 | 0.230 |
0.000 0.000 | 0.000 |
| 1 spectrum, LLEEGEK | 0.000 | 0.323 | 0.000 | 0.022 | 0.184 | 0.280 | 0.190 | 0.000 | ||
| 2 spectra, IGTVLGFNVGR | 0.000 | 0.123 | 0.000 | 0.000 | 0.138 | 0.557 | 0.183 | 0.000 | ||
| 1 spectrum, GEISNFQYLMHLNTLAGR | 0.000 | 0.088 | 0.201 | 0.000 | 0.599 | 0.028 | 0.085 | 0.000 | ||
| 2 spectra, QVLEEVFK | 0.000 | 0.163 | 0.000 | 0.000 | 0.146 | 0.263 | 0.428 | 0.000 | ||
| 2 spectra, MEPFTQIFLR | 0.000 | 0.206 | 0.078 | 0.002 | 0.353 | 0.262 | 0.098 | 0.000 | ||
| 1 spectrum, LVHNAAGHLNGPAR | 0.000 | 0.220 | 0.000 | 0.000 | 0.343 | 0.086 | 0.351 | 0.000 | ||
| 1 spectrum, LWQGMFNK | 0.000 | 0.255 | 0.000 | 0.020 | 0.126 | 0.354 | 0.244 | 0.000 | ||
| 1 spectrum, DLVDTQYK | 0.000 | 0.000 | 0.033 | 0.143 | 0.162 | 0.381 | 0.262 | 0.020 | ||
| 4 spectra, LLITIR | 0.000 | 0.230 | 0.000 | 0.000 | 0.151 | 0.480 | 0.139 | 0.000 | ||
| 2 spectra, MFHSVR | 0.000 | 0.054 | 0.189 | 0.000 | 0.421 | 0.170 | 0.167 | 0.000 | ||
| 4 spectra, LLTVVR | 0.000 | 0.251 | 0.000 | 0.000 | 0.146 | 0.494 | 0.110 | 0.000 |
| Plot | Mito | Lyso or Perox | ER | Golgi | PM | Cytosol | Nucleus | ||||||
| Expt B |
2 peptides |
2 spectra |
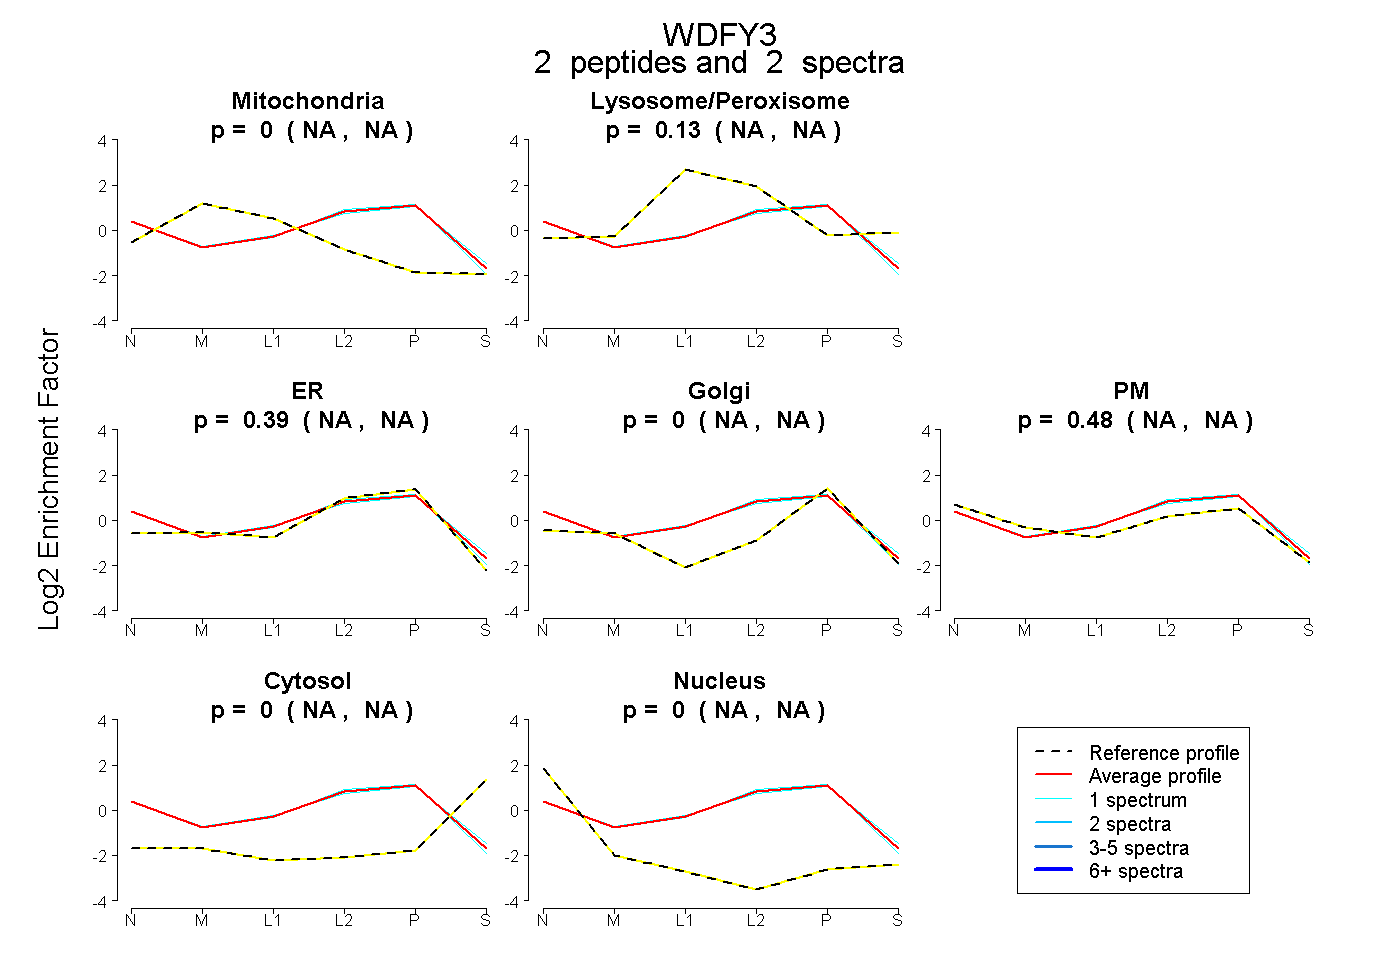 |
0.000 NA | NA |
0.127 NA | NA |
0.395 NA | NA |
0.000 NA | NA |
0.479 NA | NA |
0.000 NA | NA |
0.000 NA | NA |
|||
| Plot | Lyso | Other | |||||||||||
| Expt C |
21 peptides |
37 spectra |
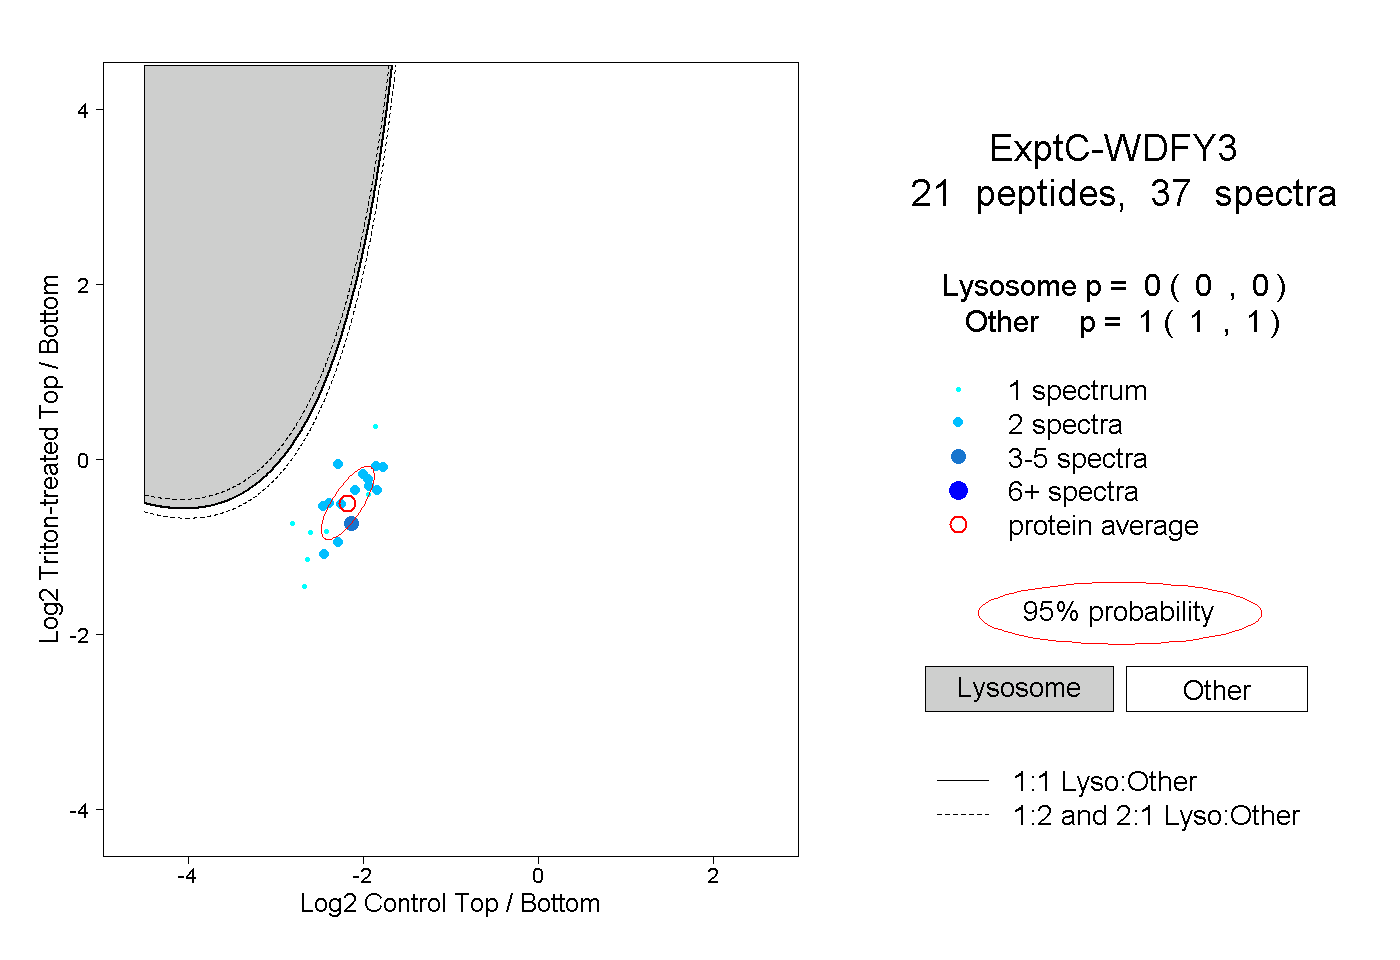 |
0.000 0.000 | 0.000 |
1.000 1.000 | 1.000 |
||||||||
| Plot | Lyso | Other | |||||||||||
| Expt D |
1 peptide |
1 spectrum |
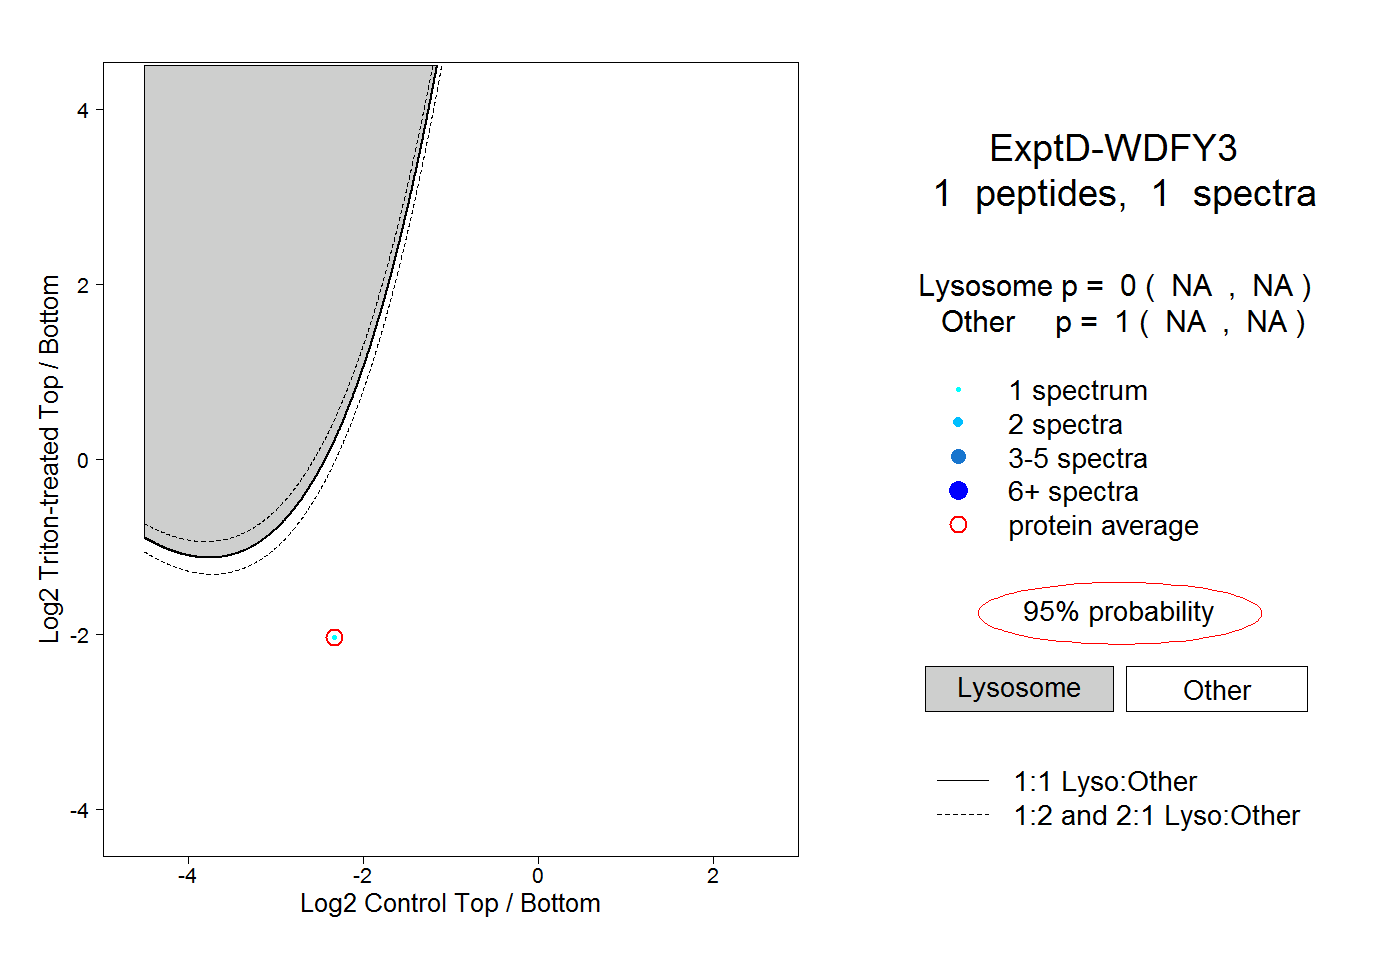 |
0.000 NA | NA |
1.000 NA | NA |