 15
15peptides
spectra
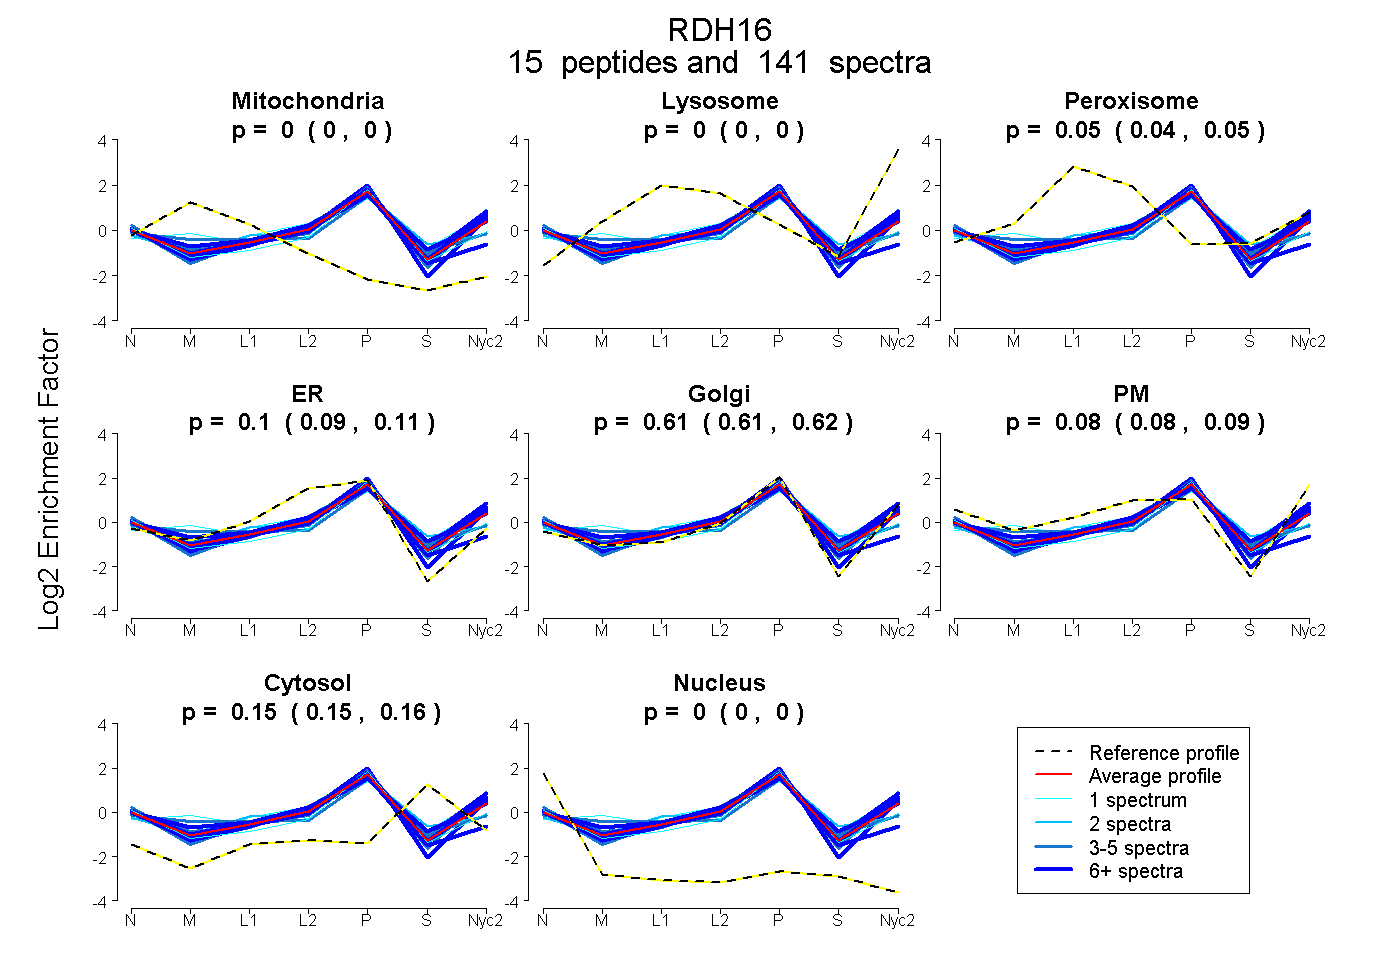
0.000 | 0.000
0.000 | 0.000
0.043 | 0.050
0.090 | 0.107
0.606 | 0.621
0.079 | 0.090
0.152 | 0.157
0.000 | 0.000
10peptides
spectra
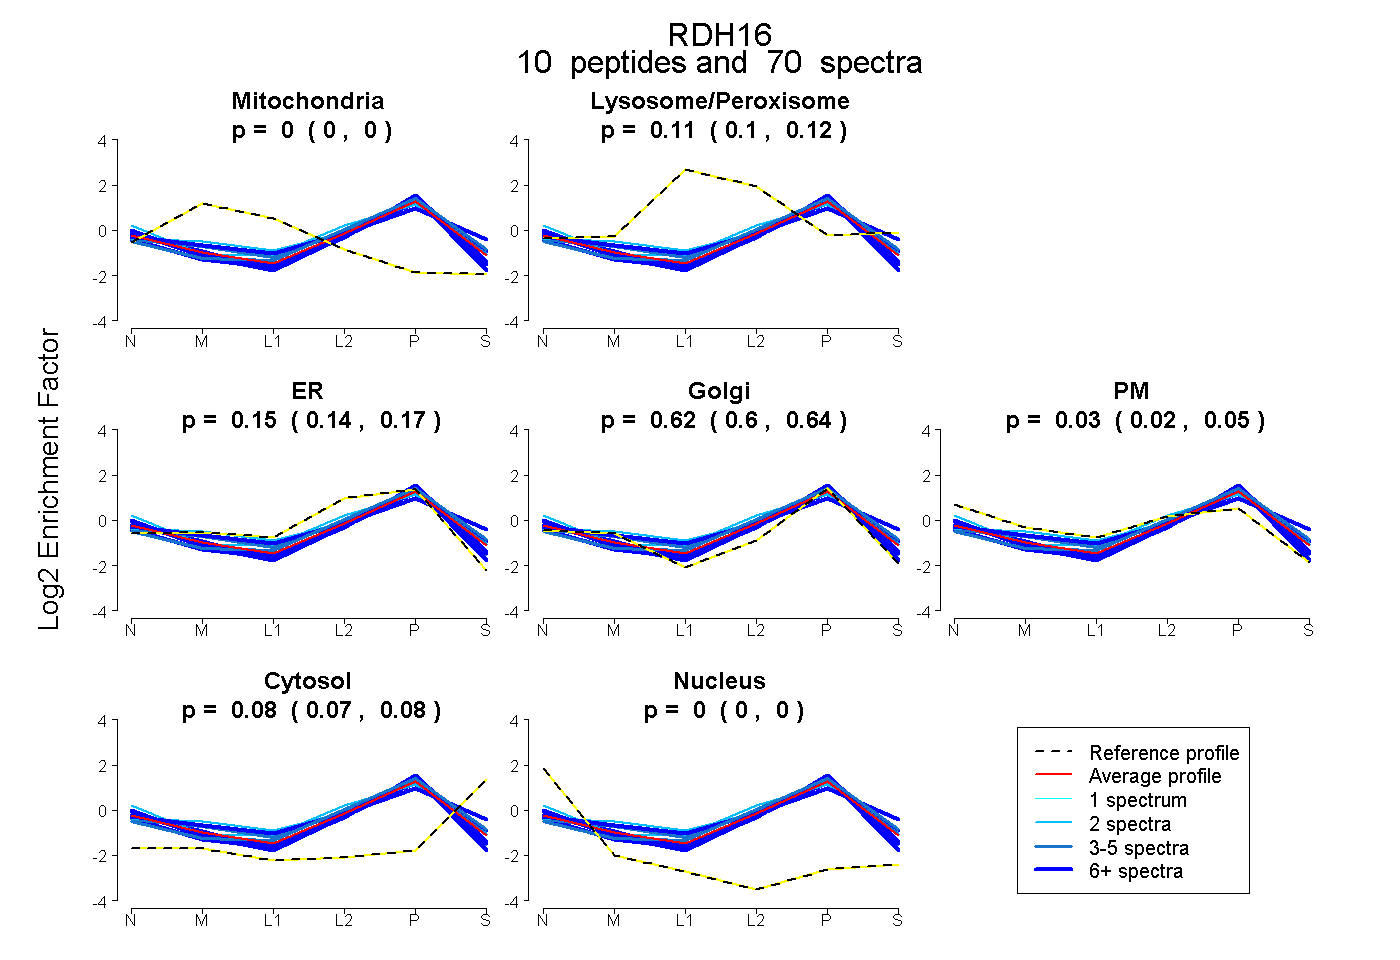
0.000 | 0.000
0.100 | 0.121
0.135 | 0.169
0.603 | 0.640
0.019 | 0.045
0.072 | 0.083
0.000 | 0.000
15peptides
spectra
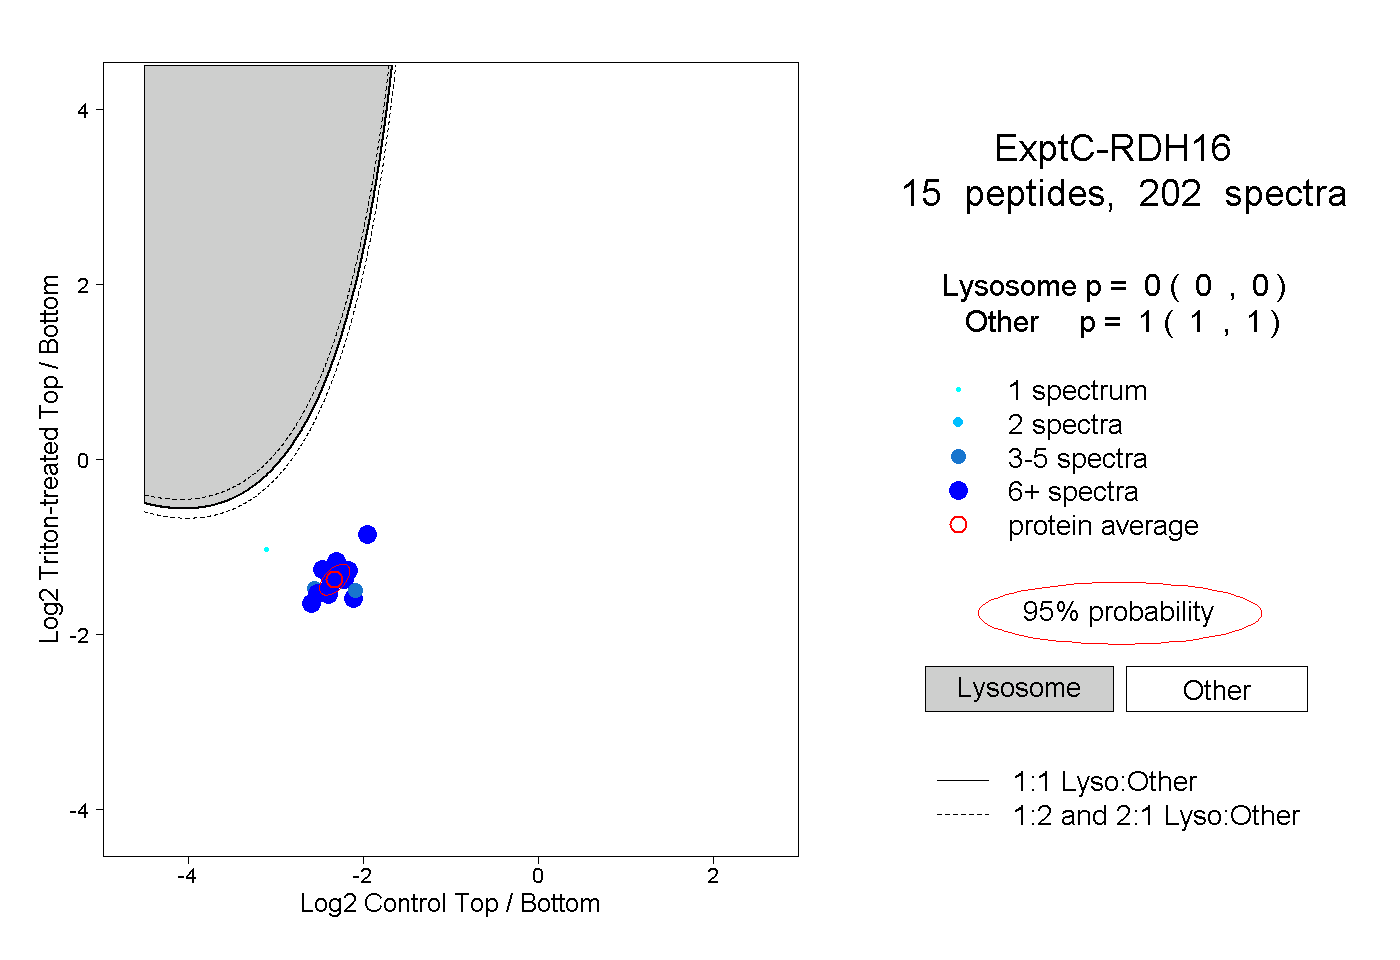
0.000 | 0.000
1.000 | 1.000
4peptides
spectra
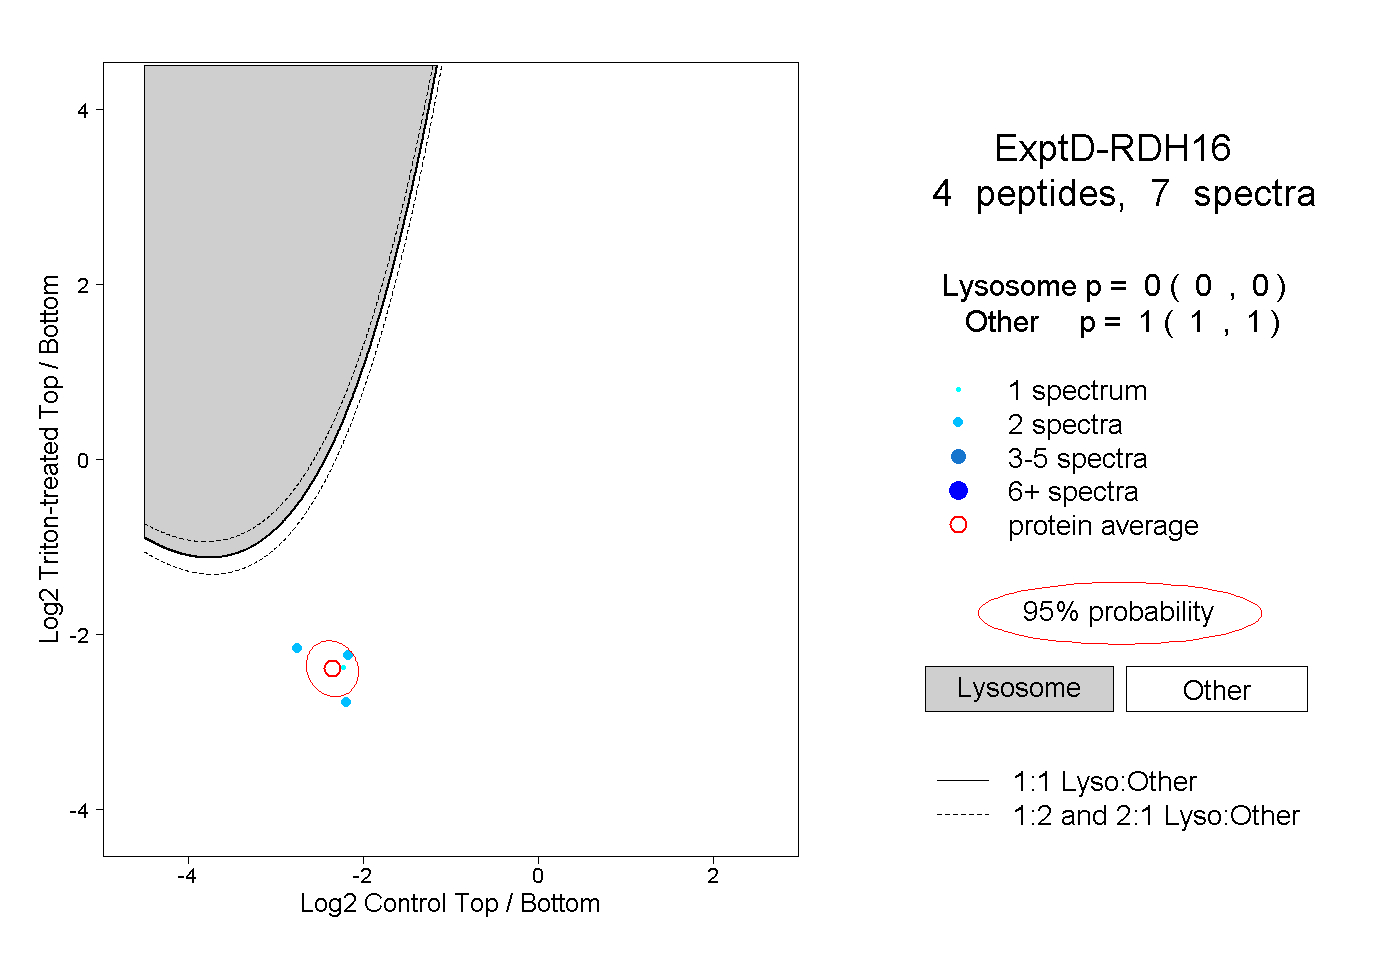
0.000 | 0.000
1.000 | 1.000