RDH16
[ENSRNOP00000035423]
Main page
| | | Plot |
Mito |
Lyso |
|
Perox |
ER |
Golgi |
PM |
Cytosol |
Nucleus |
|
| Expt A |
 15
15
peptides |
141
spectra |
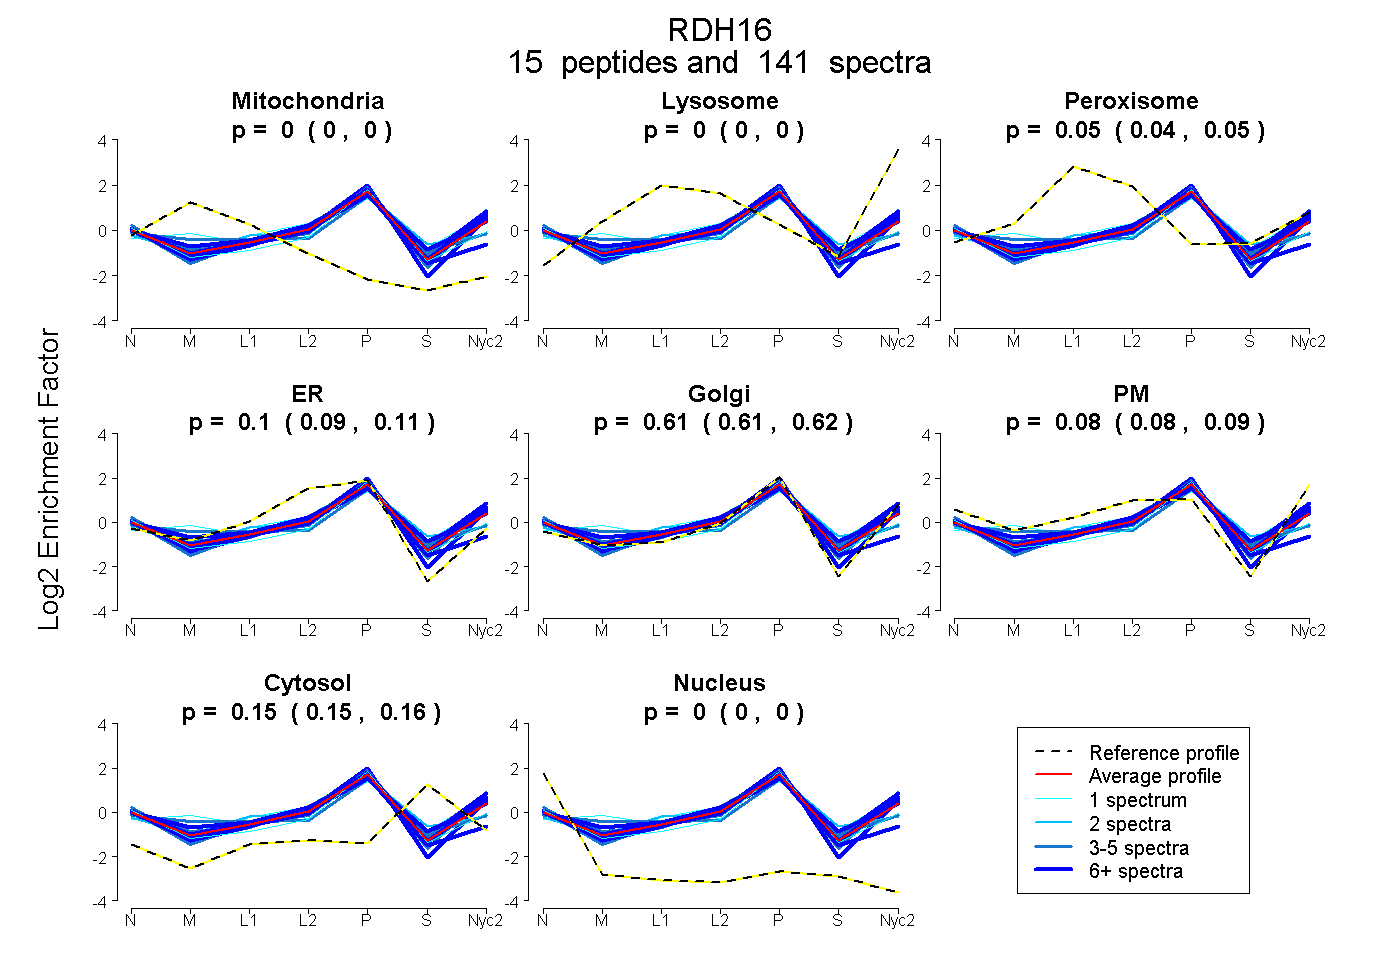 |
0.000
0.000 | 0.000 |
0.000
0.000 | 0.000 |
|
0.047
0.043 | 0.050 |
0.099
0.090 | 0.107 |
0.614
0.606 | 0.621 |
0.085
0.079 | 0.090 |
0.155
0.152 | 0.157 |
0.000
0.000 | 0.000 |
|
| | | Plot |
Mito |
|
Lyso or Perox |
|
ER |
Golgi |
PM |
Cytosol |
Nucleus |
|
| Expt B |
10
peptides |
70
spectra |
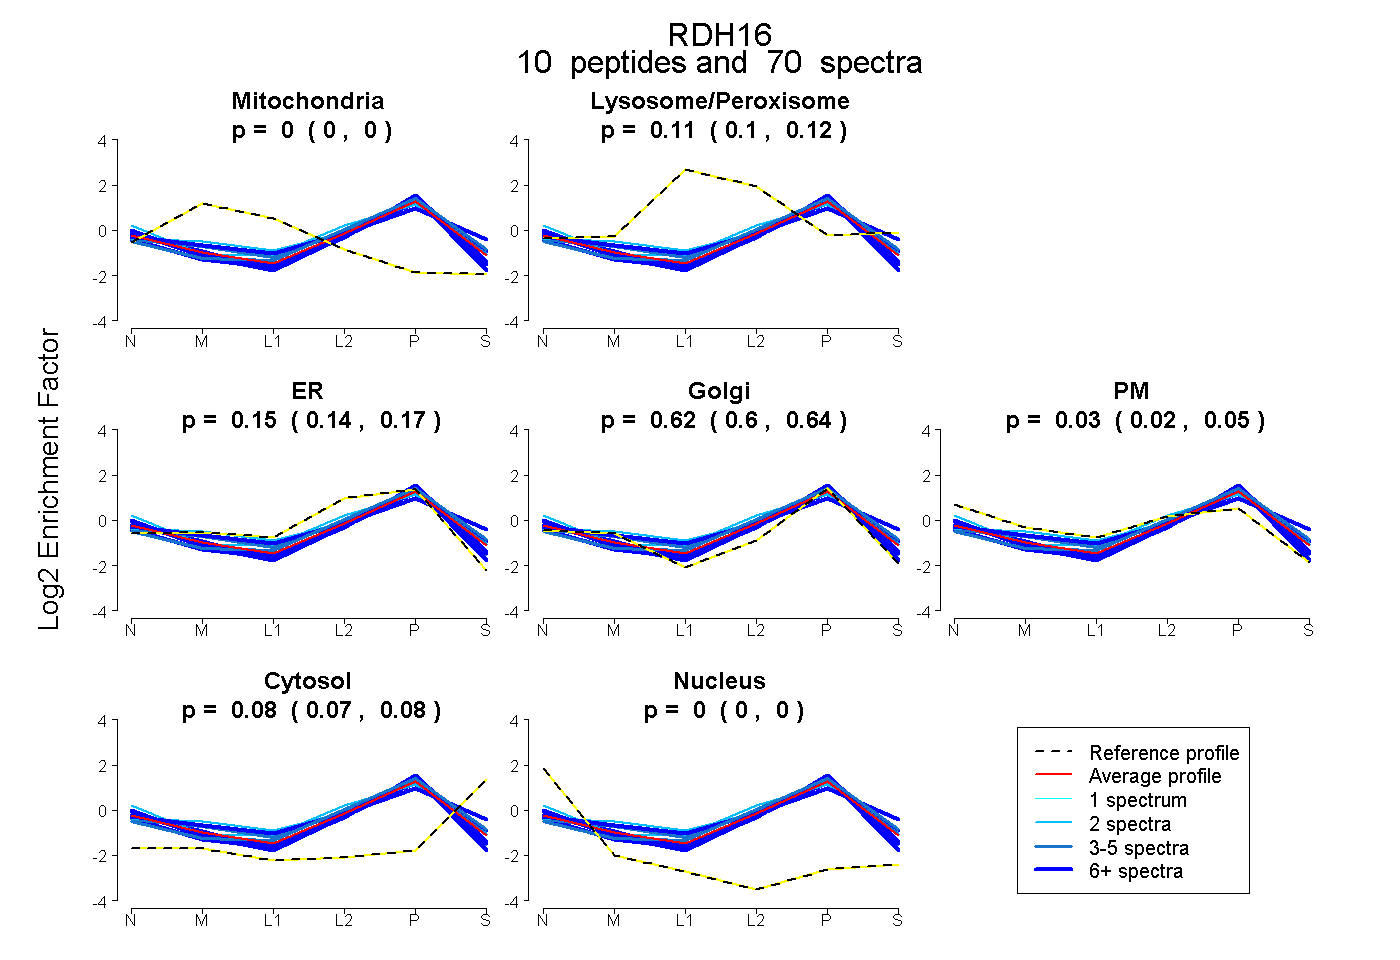 |
0.000
0.000 | 0.000 |
|
0.112
0.100 | 0.121 |
|
0.153
0.135 | 0.169 |
0.623
0.603 | 0.640 |
0.034
0.019 | 0.045 |
0.078
0.072 | 0.083 |
0.000
0.000 | 0.000 |
|
| 10 spectra, VAIVEPGFFR |
0.000 |
|
0.038 |
|
0.194 |
0.604 |
0.127 |
0.037 |
0.000 |
|
| 4 spectra, MLNGLDQR |
0.000 |
|
0.171 |
|
0.135 |
0.635 |
0.000 |
0.059 |
0.000 |
|
| 4 spectra, VVSHLQDK |
0.000 |
|
0.074 |
|
0.381 |
0.398 |
0.000 |
0.147 |
0.000 |
|
| 16 spectra, VVNVASIAGR |
0.000 |
|
0.000 |
|
0.255 |
0.629 |
0.092 |
0.000 |
0.024 |
|
| 2 spectra, LSFCGGGYCISK |
0.000 |
|
0.085 |
|
0.201 |
0.282 |
0.345 |
0.086 |
0.000 |
|
| 2 spectra, MVSHLQDK |
0.000 |
|
0.290 |
|
0.000 |
0.586 |
0.000 |
0.124 |
0.000 |
|
| 4 spectra, ELSYFGVK |
0.000 |
|
0.009 |
|
0.222 |
0.544 |
0.178 |
0.048 |
0.000 |
|
| 9 spectra, EVYGENYLASYLK |
0.000 |
|
0.053 |
|
0.158 |
0.595 |
0.060 |
0.134 |
0.000 |
|
| 7 spectra, GAEQLR |
0.000 |
|
0.015 |
|
0.287 |
0.616 |
0.000 |
0.082 |
0.000 |
|
| 12 spectra, VLAACLTEK |
0.000 |
|
0.265 |
|
0.000 |
0.597 |
0.000 |
0.138 |
0.000 |
|
| | | Plot |
|
Lyso |
|
|
|
|
|
|
|
Other |
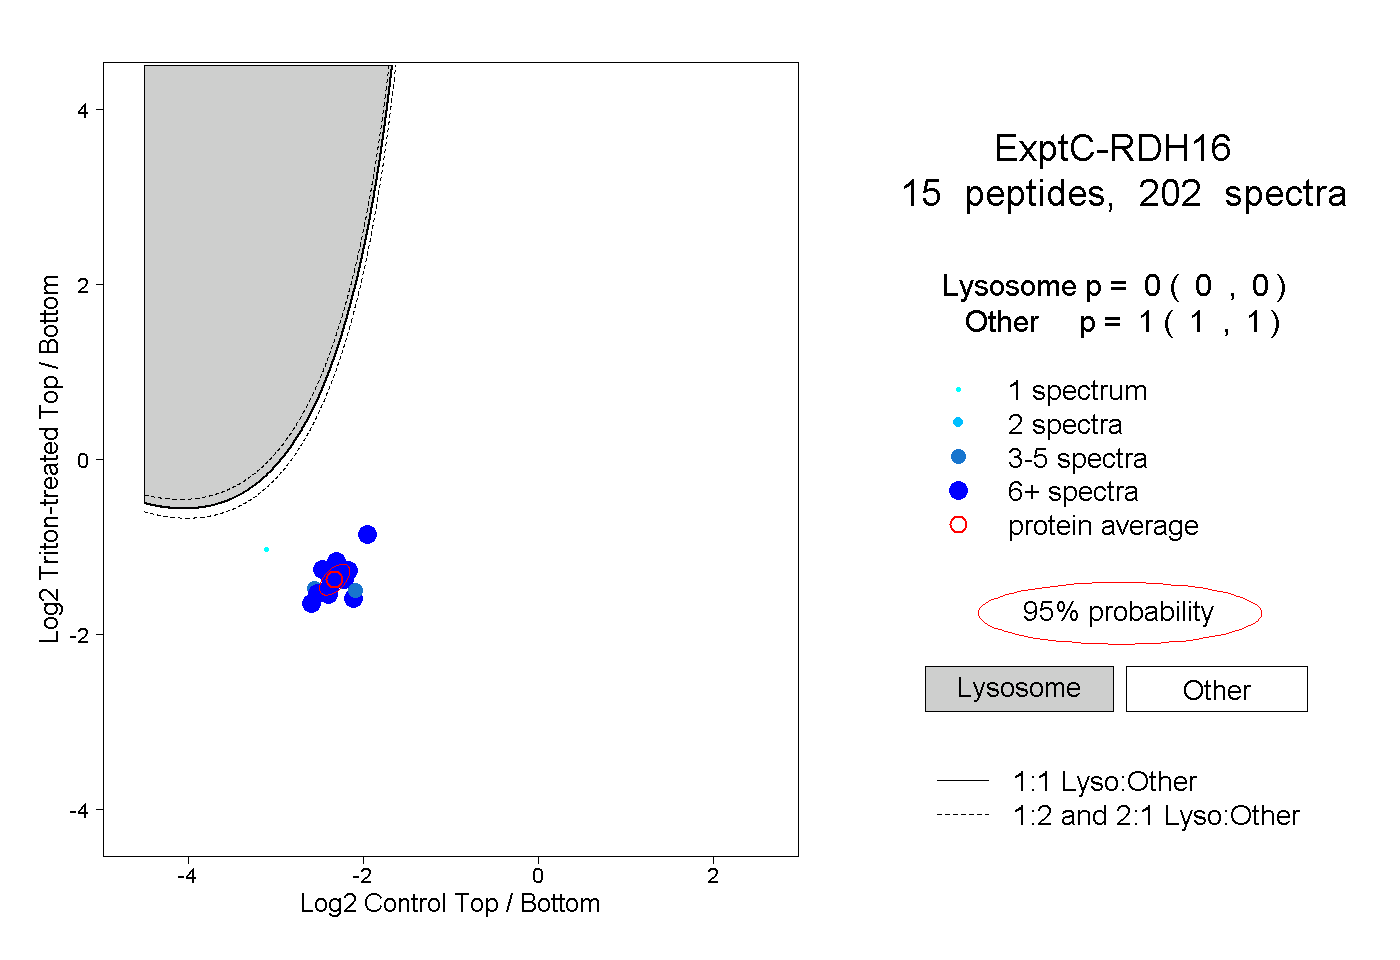
| Expt C |
15
peptides |
202
spectra |
 |
|
0.000
0.000 | 0.000 |
|
|
|
|
|
|
|
1.000
1.000 | 1.000 |
| | | Plot |
|
Lyso |
|
|
|
|
|
|
|
Other |
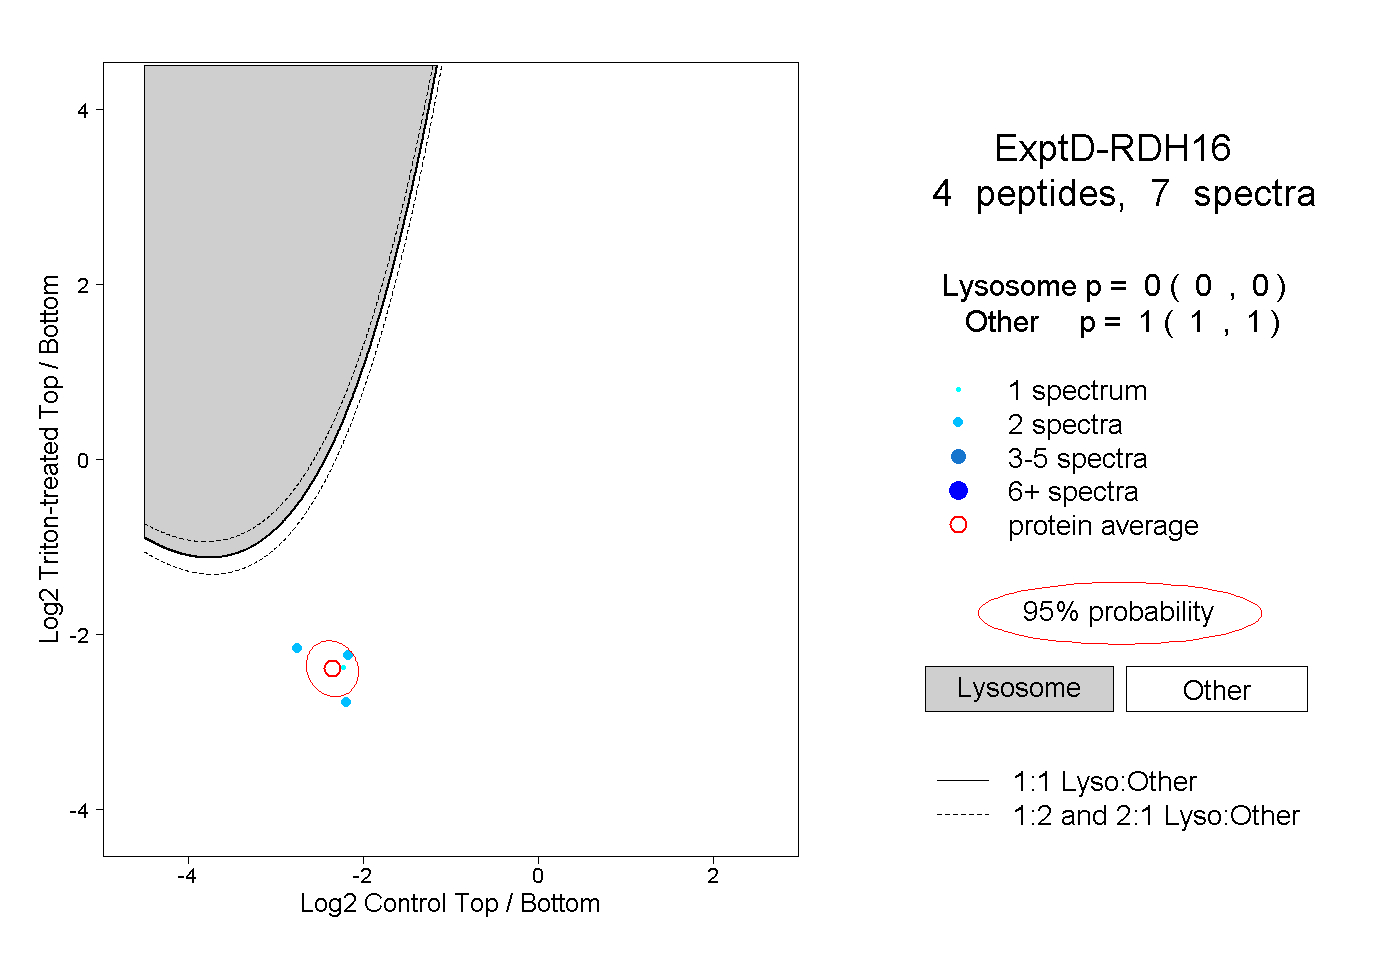
| Expt D |
4
peptides |
7
spectra |
 |
|
0.000
0.000 | 0.000 |
|
|
|
|
|
|
|
1.000
1.000 | 1.000 |