 15
15peptides
spectra
0.000 | 0.000
0.000 | 0.000
0.043 | 0.050
0.090 | 0.107
0.606 | 0.621
0.079 | 0.090
0.152 | 0.157
0.000 | 0.000
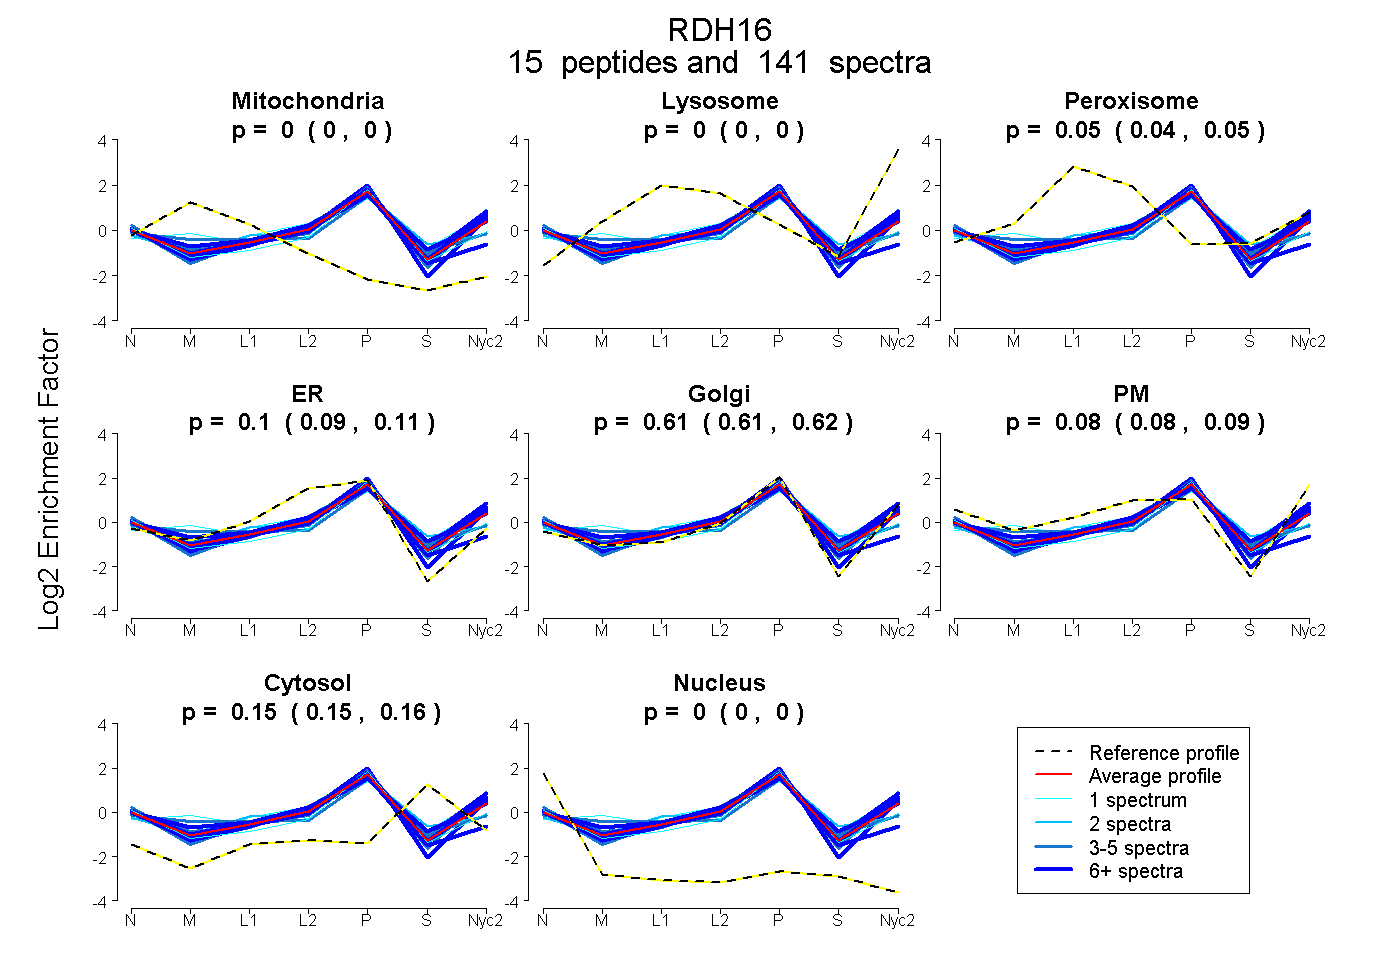
| Plot | Mito | Lyso | Perox | ER | Golgi | PM | Cytosol | Nucleus | |||||
| Expt A |
15 peptides |
141 spectra |
|
0.000 0.000 | 0.000 |
0.000 0.000 | 0.000 |
0.047 0.043 | 0.050 |
0.099 0.090 | 0.107 |
0.614 0.606 | 0.621 |
0.085 0.079 | 0.090 |
0.155 0.152 | 0.157 |
0.000 0.000 | 0.000 |
| 1 spectrum, YVFITGCDSGFGNLLAR | 0.000 | 0.000 | 0.000 | 0.137 | 0.667 | 0.000 | 0.159 | 0.037 | ||
| 17 spectra, YGVEAFSDSLR | 0.000 | 0.000 | 0.037 | 0.020 | 0.702 | 0.096 | 0.145 | 0.000 | ||
| 3 spectra, VAIVEPGFFR | 0.000 | 0.000 | 0.008 | 0.000 | 0.705 | 0.142 | 0.145 | 0.000 | ||
| 4 spectra, TESIVAATQWVK | 0.000 | 0.000 | 0.053 | 0.078 | 0.576 | 0.140 | 0.153 | 0.000 | ||
| 22 spectra, VVSHLQDK | 0.000 | 0.000 | 0.089 | 0.041 | 0.555 | 0.113 | 0.202 | 0.000 | ||
| 20 spectra, VVNVASIAGR | 0.000 | 0.000 | 0.000 | 0.051 | 0.586 | 0.200 | 0.163 | 0.000 | ||
| 2 spectra, LSFCGGGYCISK | 0.000 | 0.000 | 0.103 | 0.222 | 0.418 | 0.000 | 0.256 | 0.000 | ||
| 3 spectra, MVSHLQDK | 0.085 | 0.000 | 0.100 | 0.030 | 0.620 | 0.000 | 0.165 | 0.000 | ||
| 9 spectra, LETVILDVTK | 0.000 | 0.009 | 0.067 | 0.000 | 0.613 | 0.172 | 0.140 | 0.000 | ||
| 1 spectrum, DLSLVTDCMEHALTSCHPR | 0.030 | 0.100 | 0.074 | 0.000 | 0.627 | 0.000 | 0.170 | 0.000 | ||
| 1 spectrum, EVYGENYLASYLK | 0.000 | 0.000 | 0.090 | 0.125 | 0.476 | 0.123 | 0.186 | 0.000 | ||
| 4 spectra, ELSYFGVK | 0.000 | 0.000 | 0.000 | 0.000 | 0.620 | 0.272 | 0.108 | 0.000 | ||
| 27 spectra, GAEQLR | 0.000 | 0.000 | 0.000 | 0.130 | 0.730 | 0.072 | 0.051 | 0.018 | ||
| 7 spectra, YSAGWDAK | 0.000 | 0.000 | 0.075 | 0.000 | 0.726 | 0.080 | 0.119 | 0.000 | ||
| 20 spectra, VLAACLTEK | 0.053 | 0.000 | 0.000 | 0.509 | 0.259 | 0.000 | 0.156 | 0.023 |
| Plot | Mito | Lyso or Perox | ER | Golgi | PM | Cytosol | Nucleus | ||||||
| Expt B |
10 peptides |
70 spectra |
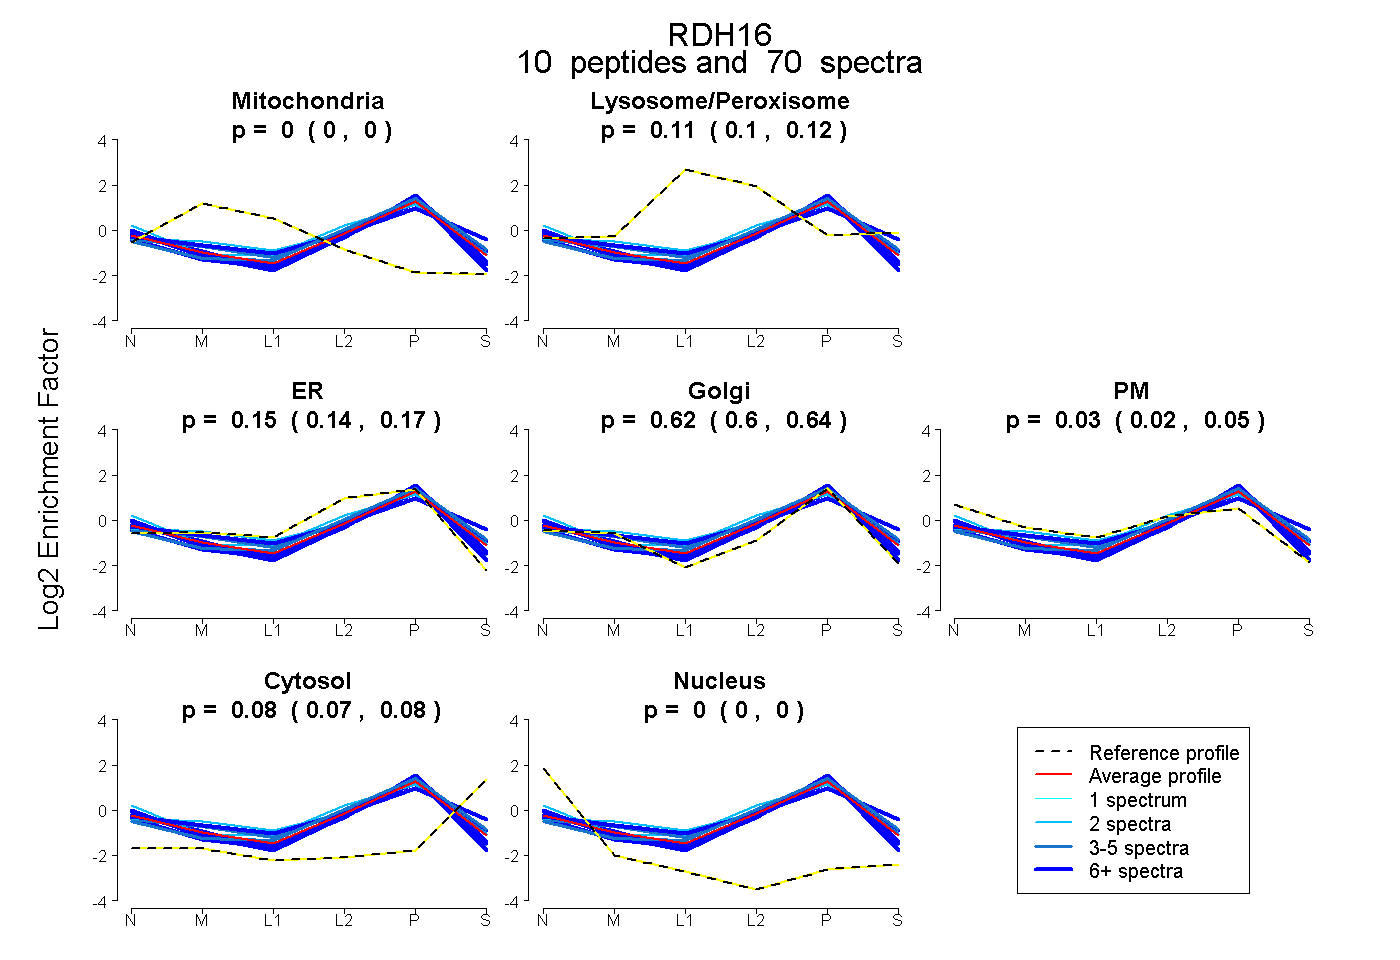 |
0.000 0.000 | 0.000 |
0.112 0.100 | 0.121 |
0.153 0.135 | 0.169 |
0.623 0.603 | 0.640 |
0.034 0.019 | 0.045 |
0.078 0.072 | 0.083 |
0.000 0.000 | 0.000 |
|||
| Plot | Lyso | Other | |||||||||||
| Expt C |
15 peptides |
202 spectra |
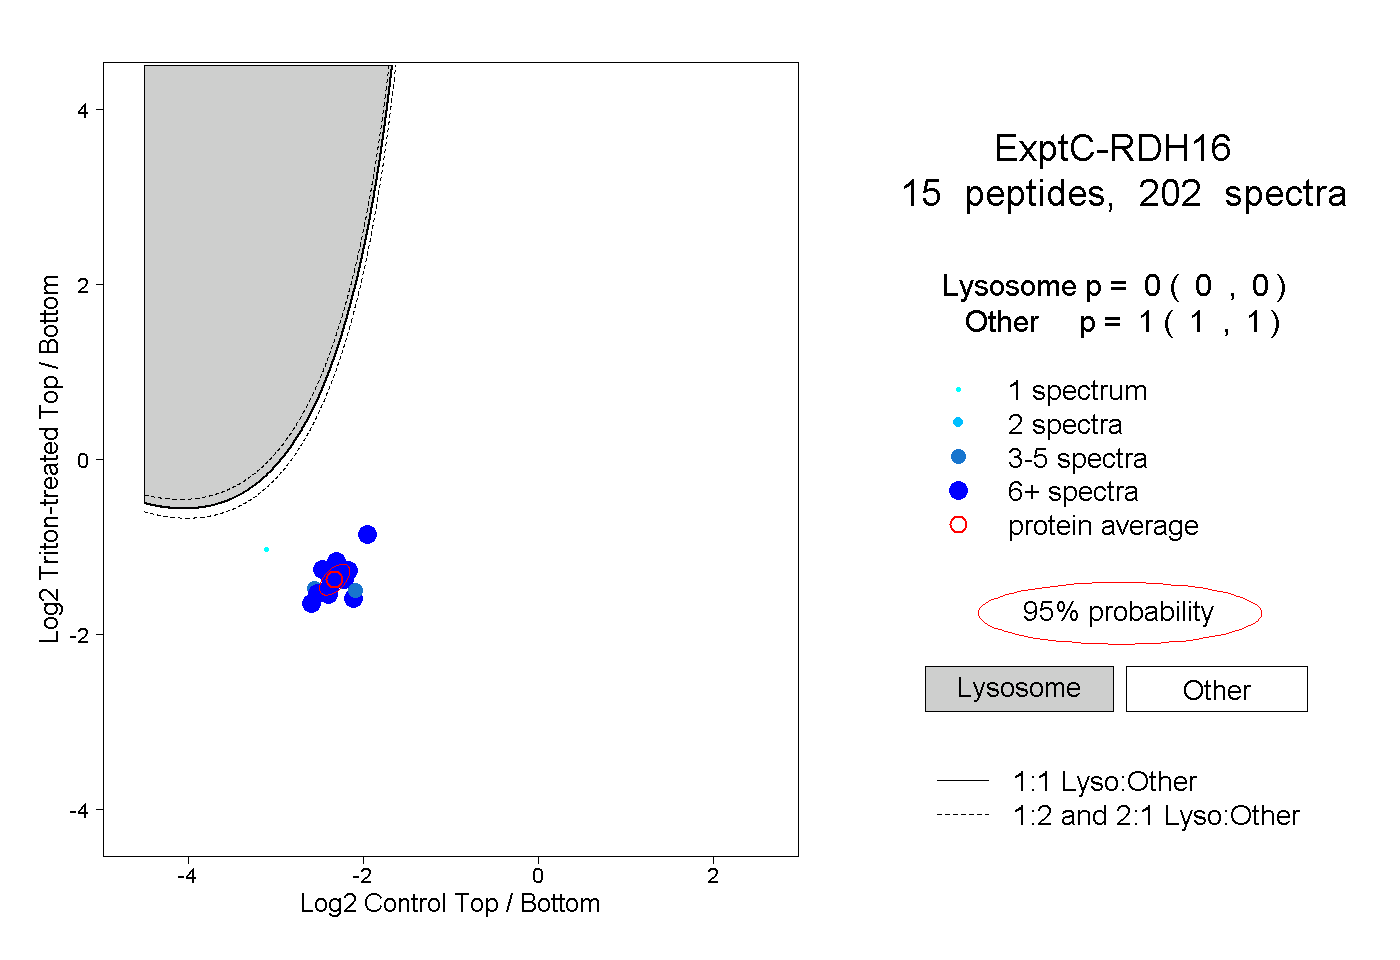 |
0.000 0.000 | 0.000 |
1.000 1.000 | 1.000 |
||||||||
| Plot | Lyso | Other | |||||||||||
| Expt D |
4 peptides |
7 spectra |
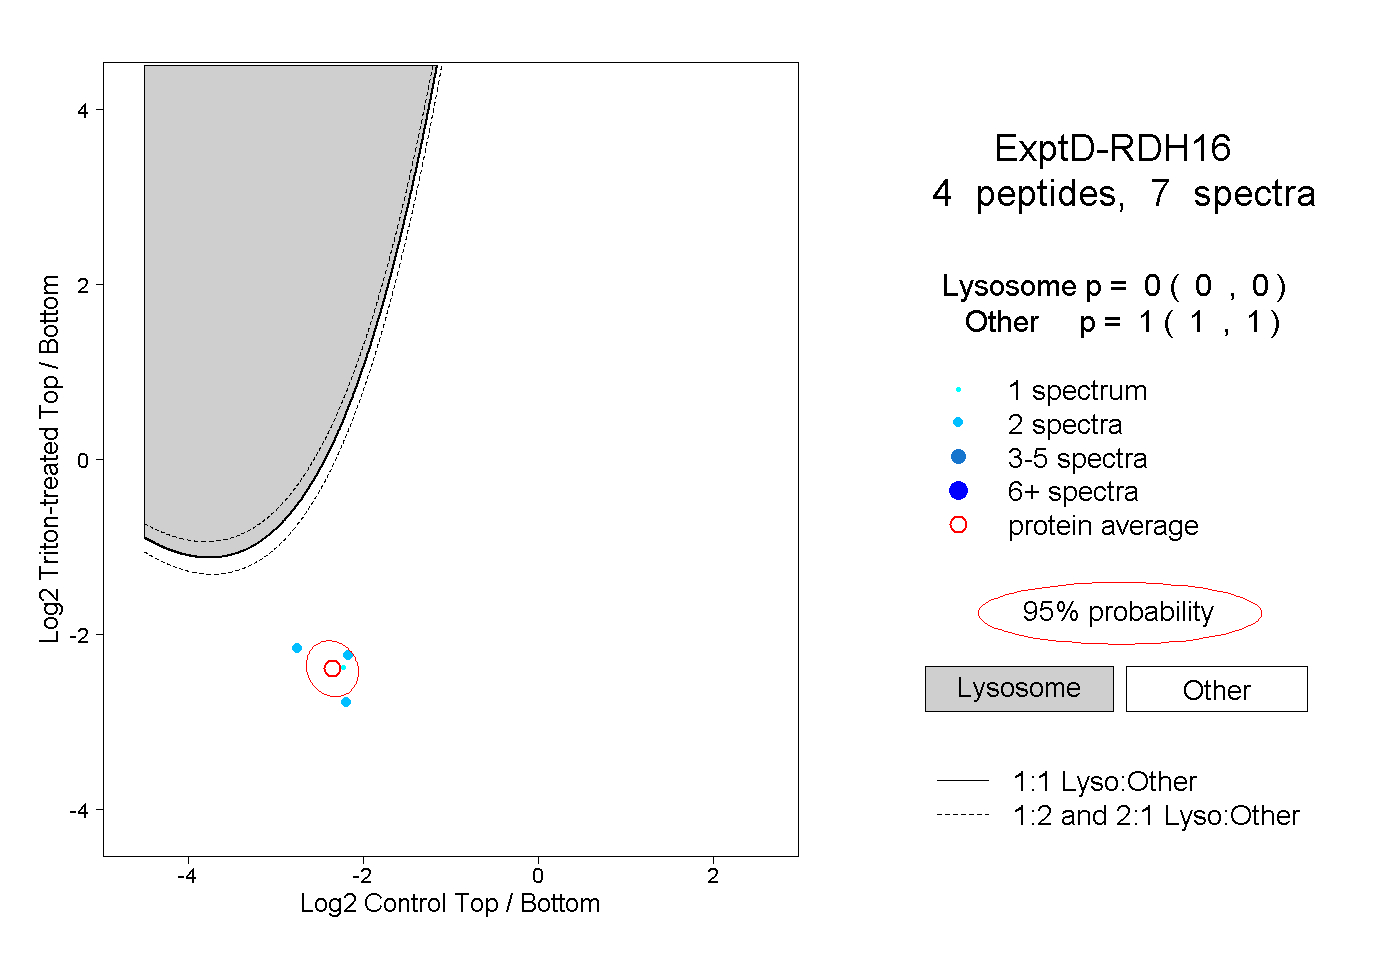 |
0.000 0.000 | 0.000 |
1.000 1.000 | 1.000 |