 14
14peptides
spectra
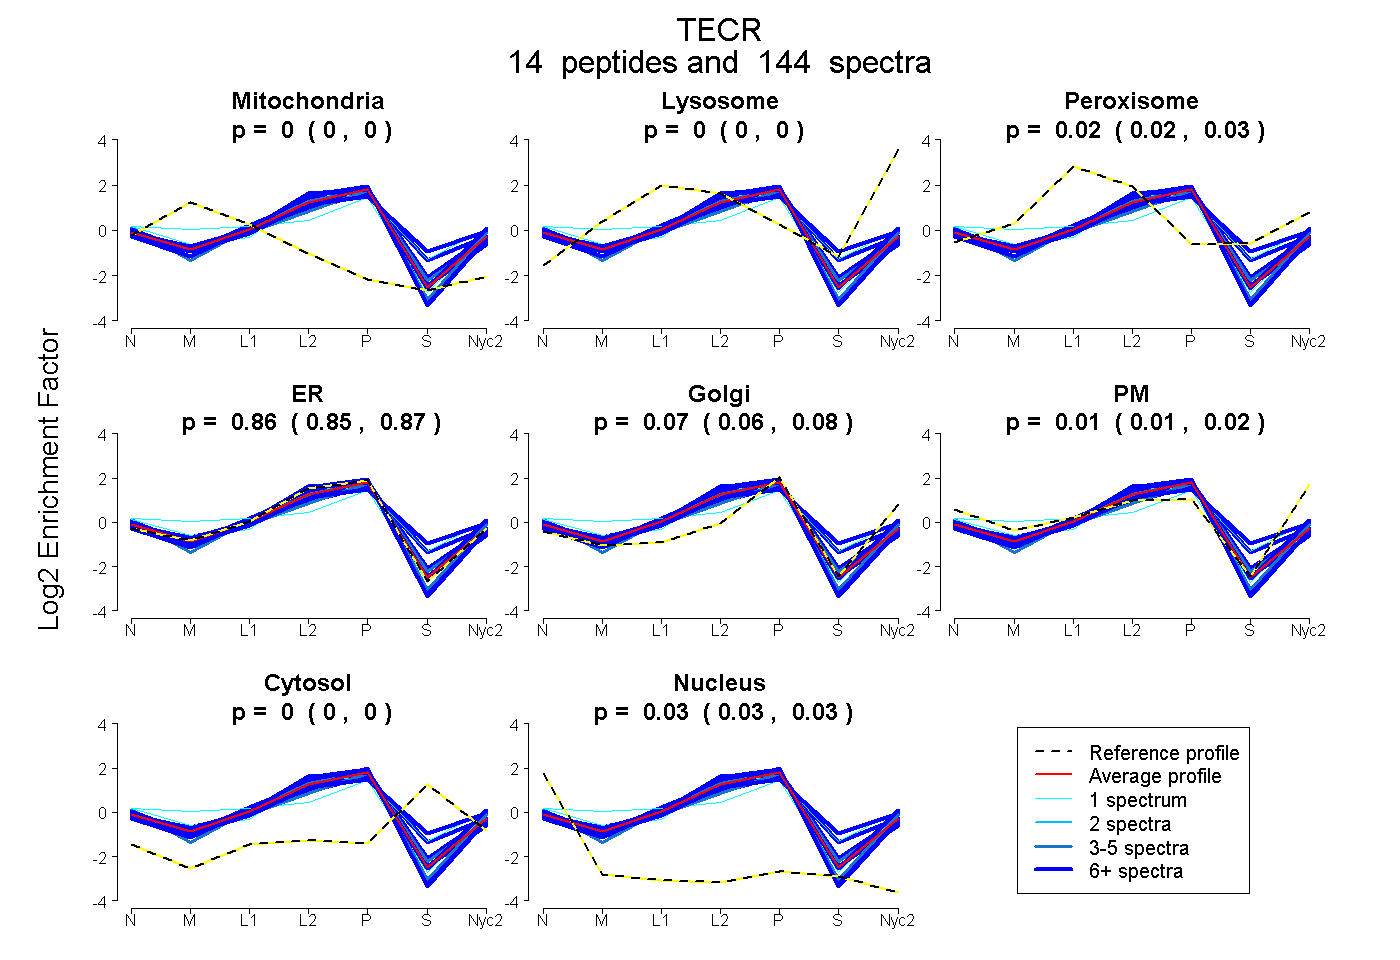
0.000 | 0.000
0.000 | 0.000
0.016 | 0.029
0.850 | 0.868
0.061 | 0.083
0.005 | 0.024
0.000 | 0.000
0.028 | 0.030
10peptides
spectra
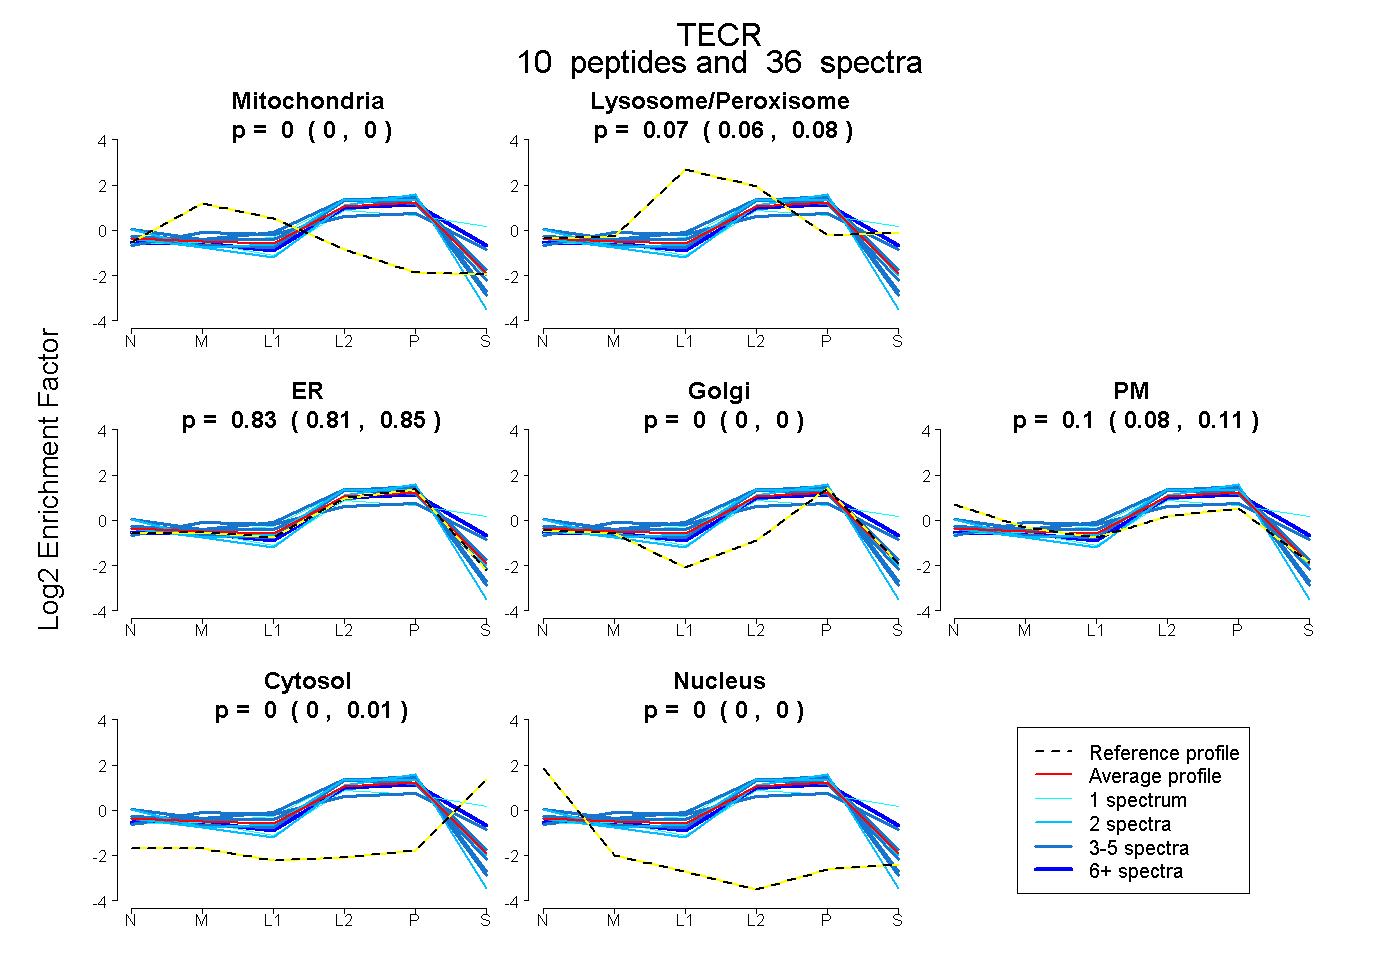
0.000 | 0.000
0.056 | 0.083
0.807 | 0.848
0.000 | 0.000
0.079 | 0.110
0.000 | 0.007
0.000 | 0.000
12peptides
spectra
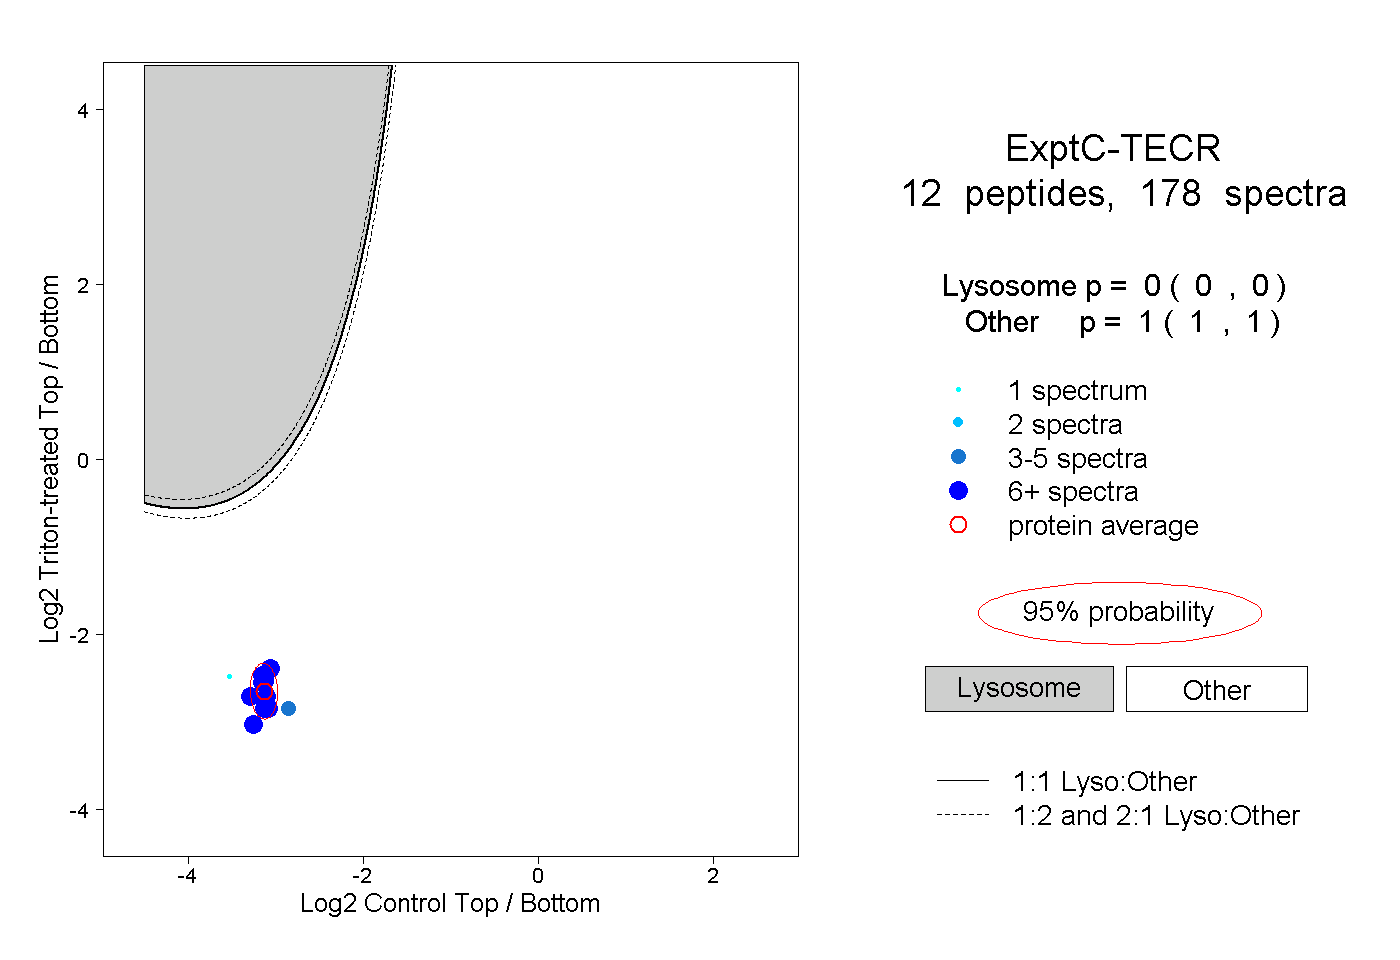
0.000 | 0.000
1.000 | 1.000
8peptides
spectra
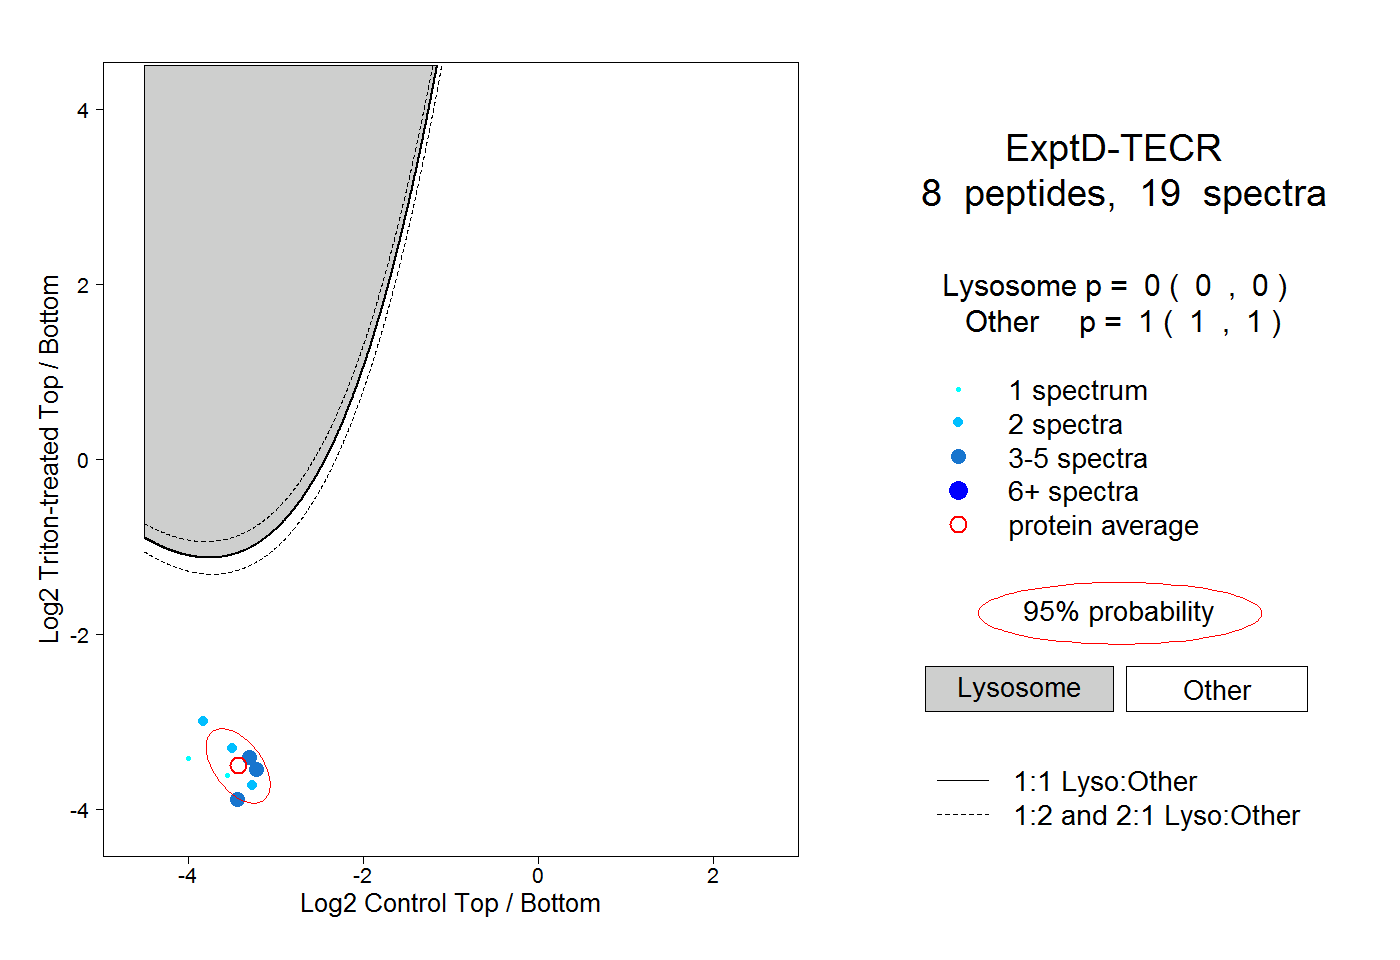
0.000 | 0.000
1.000 | 1.000