TECR
[ENSRNOP00000035416]
Main page
| | | Plot |
Mito |
Lyso |
|
Perox |
ER |
Golgi |
PM |
Cytosol |
Nucleus |
|
| Expt A |
 14
14
peptides |
144
spectra |
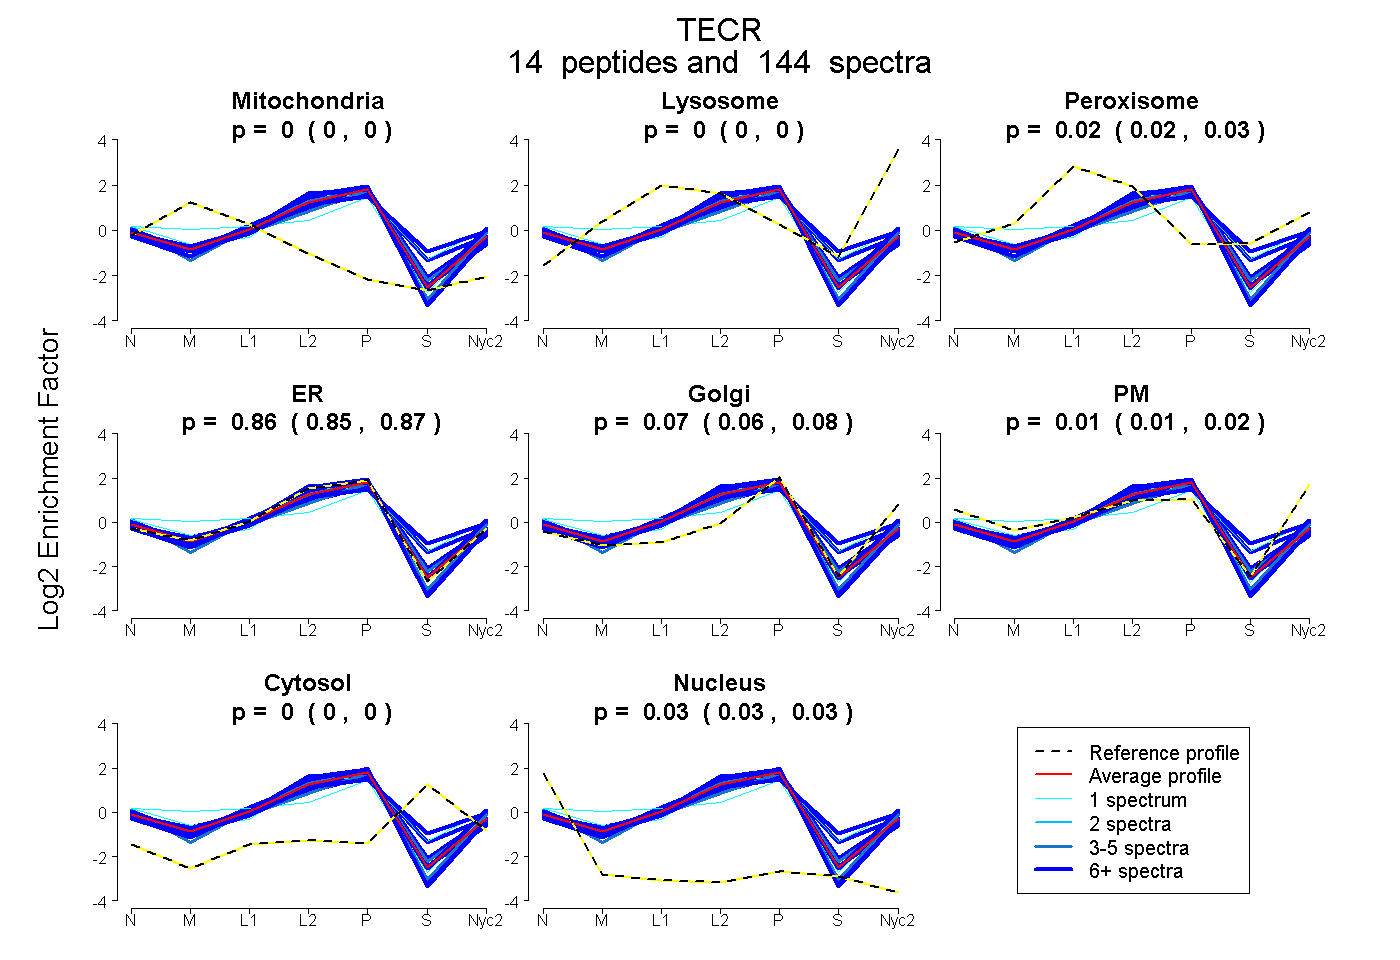 |
0.000
0.000 | 0.000 |
0.000
0.000 | 0.000 |
|
0.024
0.016 | 0.029 |
0.859
0.850 | 0.868 |
0.073
0.061 | 0.083 |
0.015
0.005 | 0.024 |
0.000
0.000 | 0.000 |
0.029
0.028 | 0.030 |
|
| | | Plot |
Mito |
|
Lyso or Perox |
|
ER |
Golgi |
PM |
Cytosol |
Nucleus |
|
| Expt B |
10
peptides |
36
spectra |
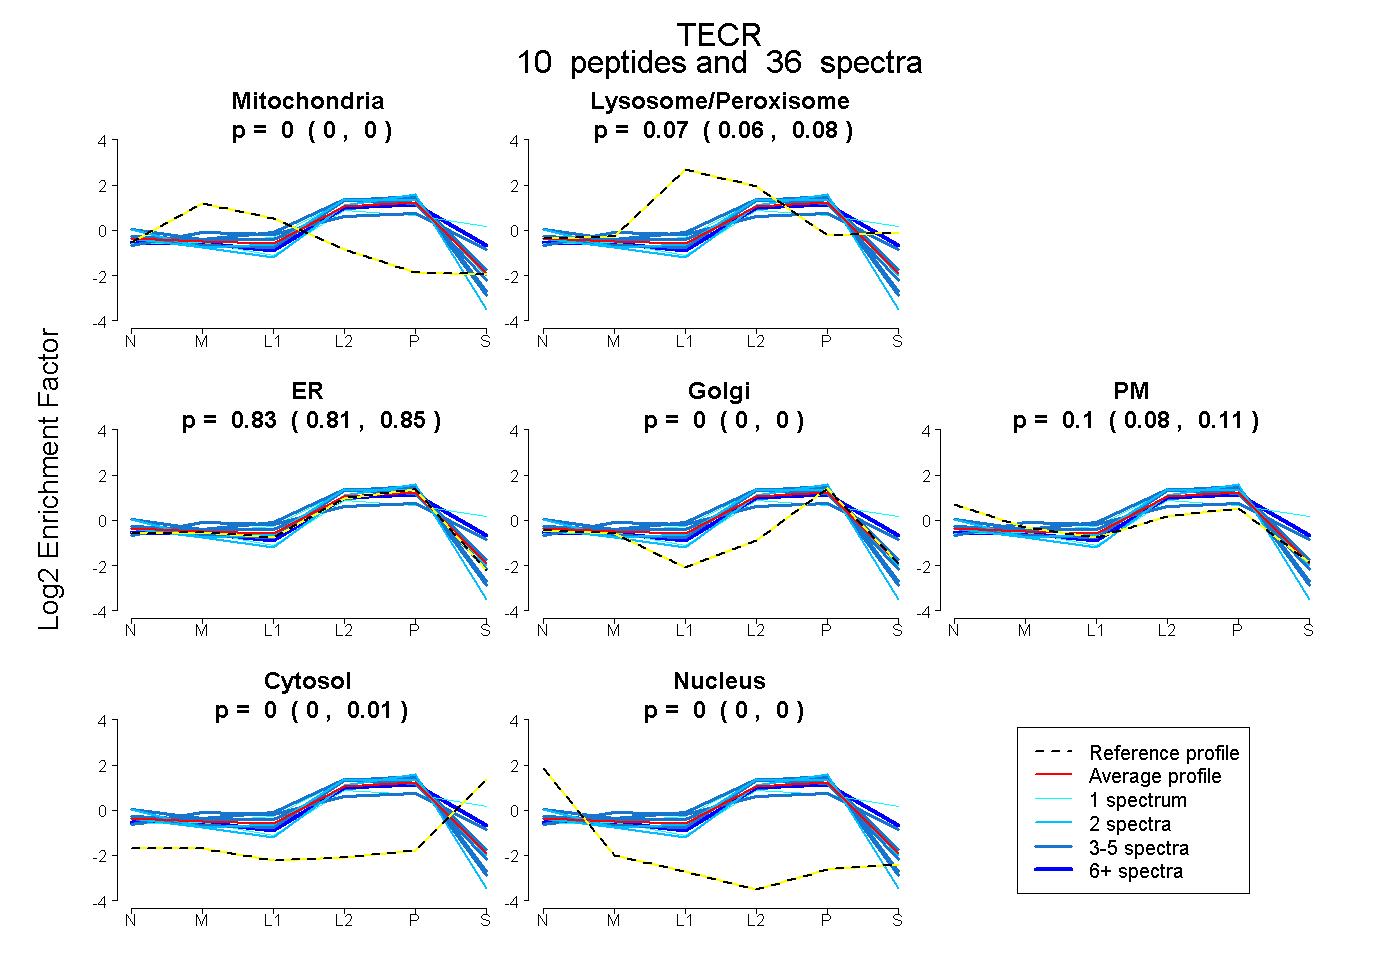 |
0.000
0.000 | 0.000 |
|
0.071
0.056 | 0.083 |
|
0.830
0.807 | 0.848 |
0.000
0.000 | 0.000 |
0.099
0.079 | 0.110 |
0.000
0.000 | 0.007 |
0.000
0.000 | 0.000 |
|
| 2 spectra, YDFTSSR |
0.000 |
|
0.000 |
|
0.989 |
0.000 |
0.000 |
0.000 |
0.011 |
|
| 2 spectra, VPFIYGR |
0.000 |
|
0.060 |
|
0.795 |
0.000 |
0.145 |
0.000 |
0.000 |
|
| 4 spectra, LLETLFVHR |
0.000 |
|
0.146 |
|
0.715 |
0.000 |
0.139 |
0.000 |
0.000 |
|
| 1 spectrum, HYEVEIR |
0.000 |
|
0.182 |
|
0.520 |
0.000 |
0.000 |
0.298 |
0.000 |
|
| 5 spectra, DYPPLR |
0.000 |
|
0.143 |
|
0.750 |
0.108 |
0.000 |
0.000 |
0.000 |
|
| 9 spectra, HYEDLLR |
0.000 |
|
0.126 |
|
0.712 |
0.000 |
0.000 |
0.162 |
0.000 |
|
| 4 spectra, DLRPAGSK |
0.020 |
|
0.000 |
|
0.946 |
0.000 |
0.034 |
0.000 |
0.000 |
|
| 4 spectra, VEPQATISEIK |
0.000 |
|
0.000 |
|
1.000 |
0.000 |
0.000 |
0.000 |
0.000 |
|
| 1 spectrum, DEDVLQK |
0.000 |
|
0.039 |
|
0.961 |
0.000 |
0.000 |
0.000 |
0.000 |
|
| 4 spectra, THPQWYPAR |
0.000 |
|
0.375 |
|
0.201 |
0.363 |
0.000 |
0.061 |
0.000 |
|
| | | Plot |
|
Lyso |
|
|
|
|
|
|
|
Other |
| Expt C |
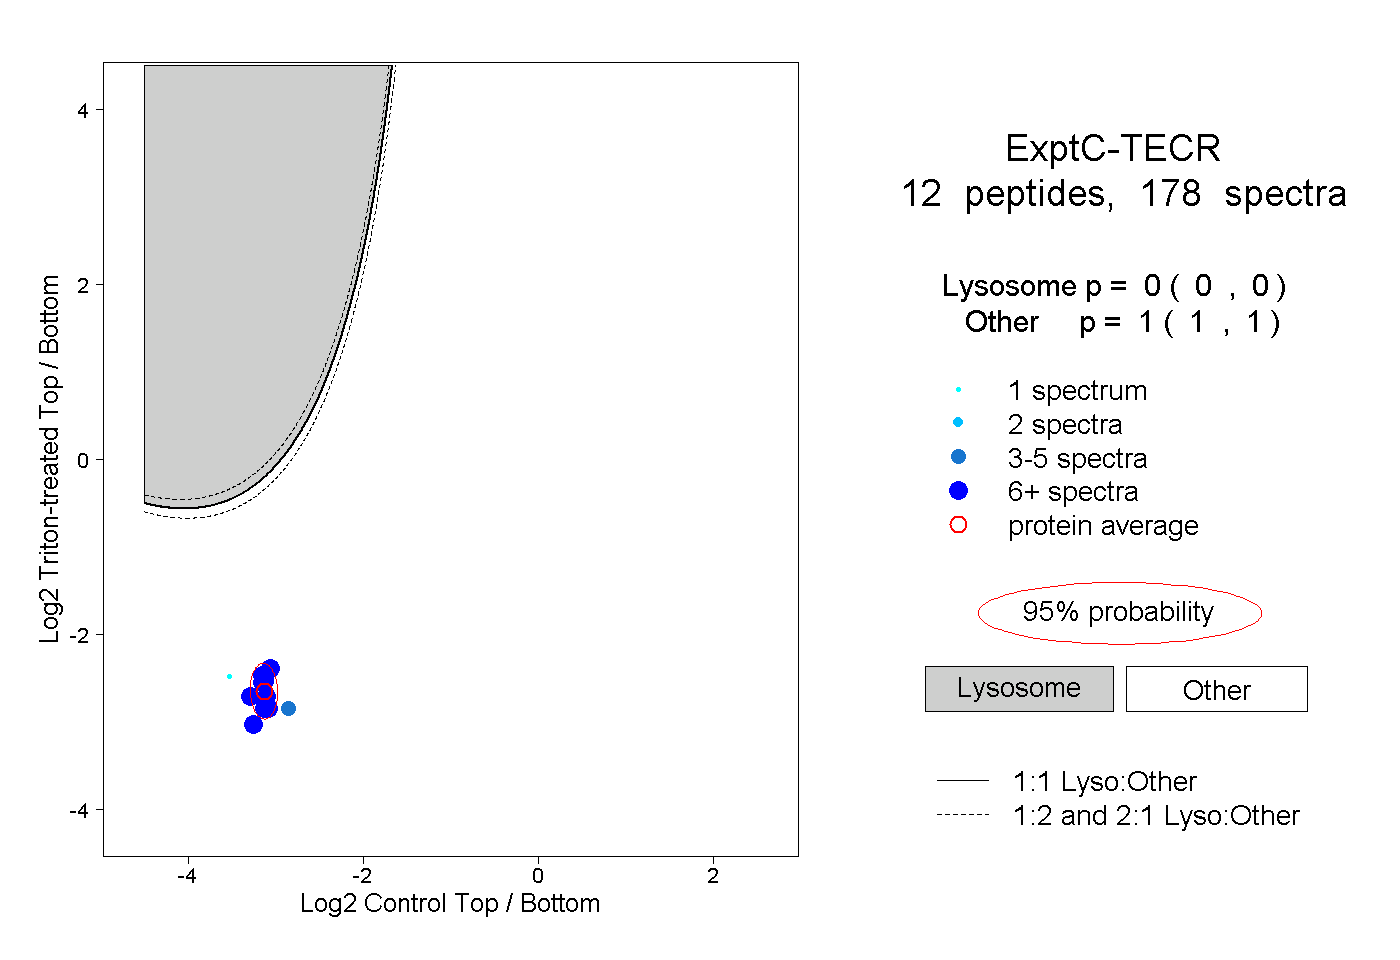
12
peptides |
178
spectra |
 |
|
0.000
0.000 | 0.000 |
|
|
|
|
|
|
|
1.000
1.000 | 1.000 |
| | | Plot |
|
Lyso |
|
|
|
|
|
|
|
Other |
| Expt D |
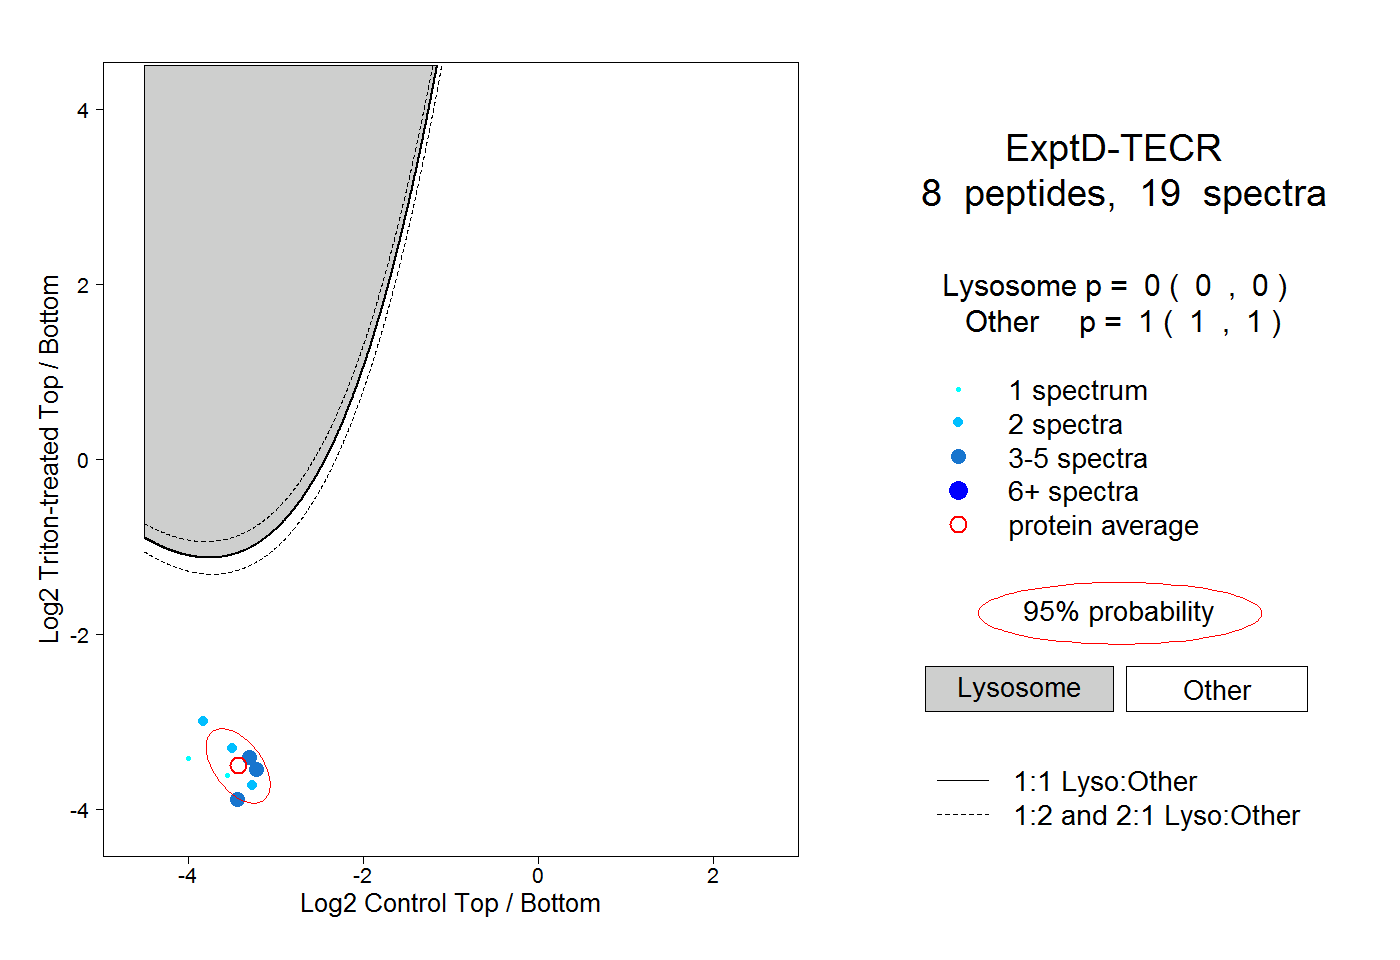
8
peptides |
19
spectra |
 |
|
0.000
0.000 | 0.000 |
|
|
|
|
|
|
|
1.000
1.000 | 1.000 |