 14
14peptides
spectra
0.000 | 0.000
0.000 | 0.000
0.016 | 0.029
0.850 | 0.868
0.061 | 0.083
0.005 | 0.024
0.000 | 0.000
0.028 | 0.030
| Plot | Mito | Lyso | Perox | ER | Golgi | PM | Cytosol | Nucleus | |||||
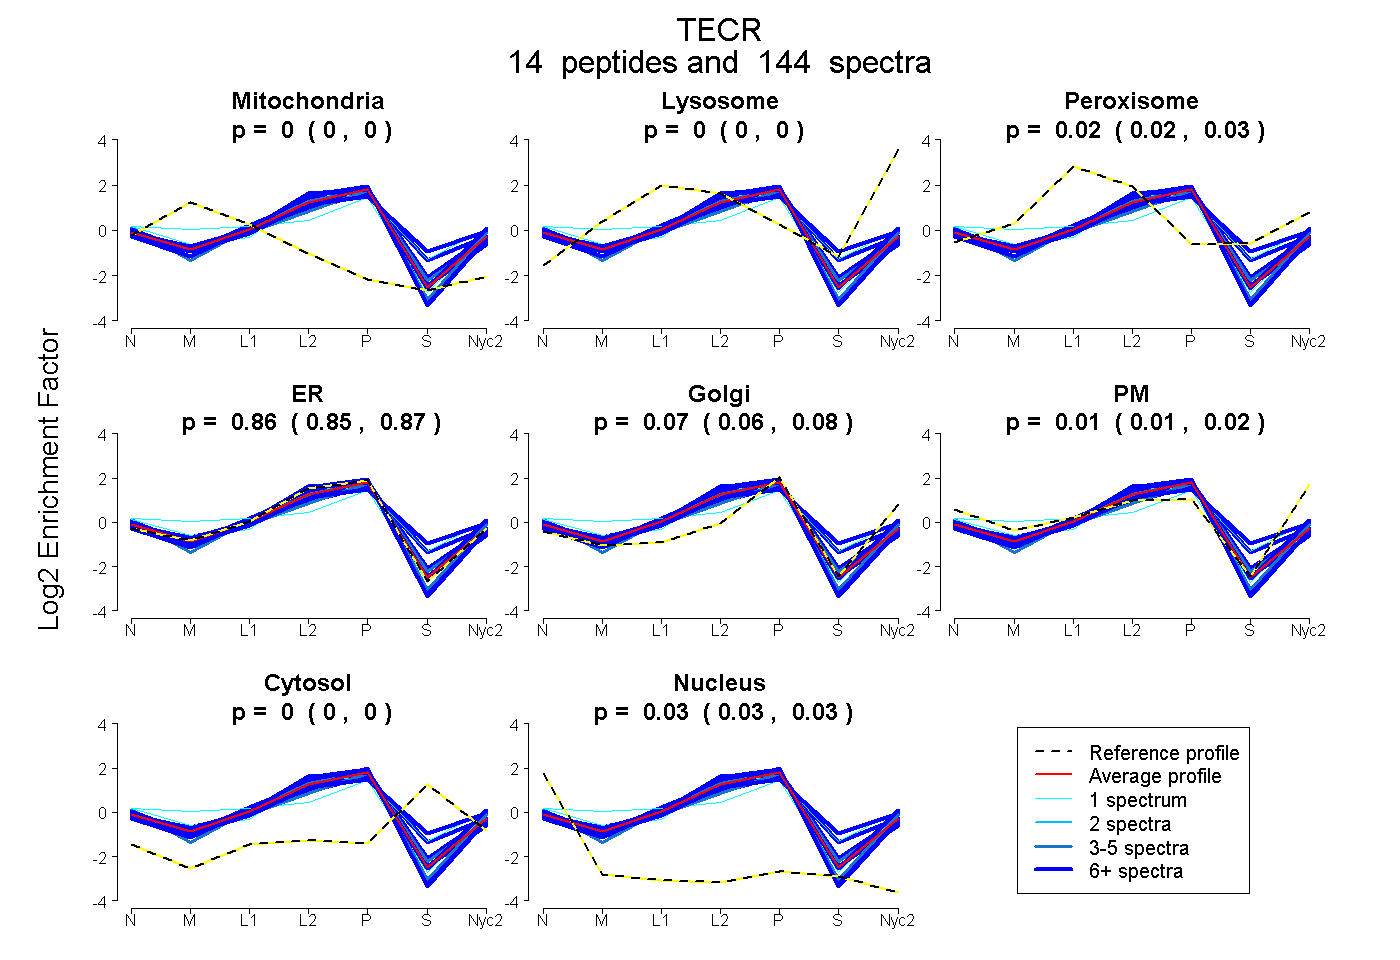
| Expt A |
14 peptides |
144 spectra |
|
0.000 0.000 | 0.000 |
0.000 0.000 | 0.000 |
0.024 0.016 | 0.029 |
0.859 0.850 | 0.868 |
0.073 0.061 | 0.083 |
0.015 0.005 | 0.024 |
0.000 0.000 | 0.000 |
0.029 0.028 | 0.030 |
| 10 spectra, YDFTSSR | 0.000 | 0.000 | 0.004 | 0.838 | 0.000 | 0.158 | 0.000 | 0.000 | ||
| 13 spectra, VPFIYGR | 0.000 | 0.000 | 0.000 | 0.892 | 0.069 | 0.000 | 0.000 | 0.039 | ||
| 18 spectra, LLETLFVHR | 0.006 | 0.000 | 0.000 | 0.990 | 0.000 | 0.000 | 0.000 | 0.005 | ||
| 1 spectrum, HYEVEIR | 0.000 | 0.000 | 0.058 | 0.624 | 0.000 | 0.189 | 0.128 | 0.000 | ||
| 15 spectra, DYPPLR | 0.000 | 0.000 | 0.051 | 0.867 | 0.023 | 0.000 | 0.059 | 0.000 | ||
| 10 spectra, HYEDLLR | 0.055 | 0.000 | 0.000 | 0.805 | 0.103 | 0.000 | 0.005 | 0.033 | ||
| 17 spectra, DLRPAGSK | 0.000 | 0.000 | 0.000 | 0.979 | 0.000 | 0.000 | 0.000 | 0.021 | ||
| 4 spectra, IPYPTK | 0.021 | 0.000 | 0.000 | 0.745 | 0.157 | 0.000 | 0.061 | 0.016 | ||
| 13 spectra, LPVGTTATLYFR | 0.000 | 0.000 | 0.000 | 0.984 | 0.000 | 0.000 | 0.000 | 0.016 | ||
| 6 spectra, FSHGTMPLR | 0.000 | 0.000 | 0.064 | 0.701 | 0.055 | 0.000 | 0.180 | 0.000 | ||
| 4 spectra, VEPQATISEIK | 0.000 | 0.000 | 0.000 | 0.861 | 0.010 | 0.107 | 0.000 | 0.022 | ||
| 27 spectra, THPQWYPAR | 0.000 | 0.019 | 0.089 | 0.621 | 0.053 | 0.014 | 0.205 | 0.000 | ||
| 5 spectra, DEDVLQK | 0.000 | 0.000 | 0.000 | 0.883 | 0.020 | 0.073 | 0.000 | 0.024 | ||
| 1 spectrum, HTVVHLACMCHSFHYIK | 0.179 | 0.000 | 0.000 | 0.433 | 0.167 | 0.222 | 0.000 | 0.000 |
| Plot | Mito | Lyso or Perox | ER | Golgi | PM | Cytosol | Nucleus | ||||||
| Expt B |
10 peptides |
36 spectra |
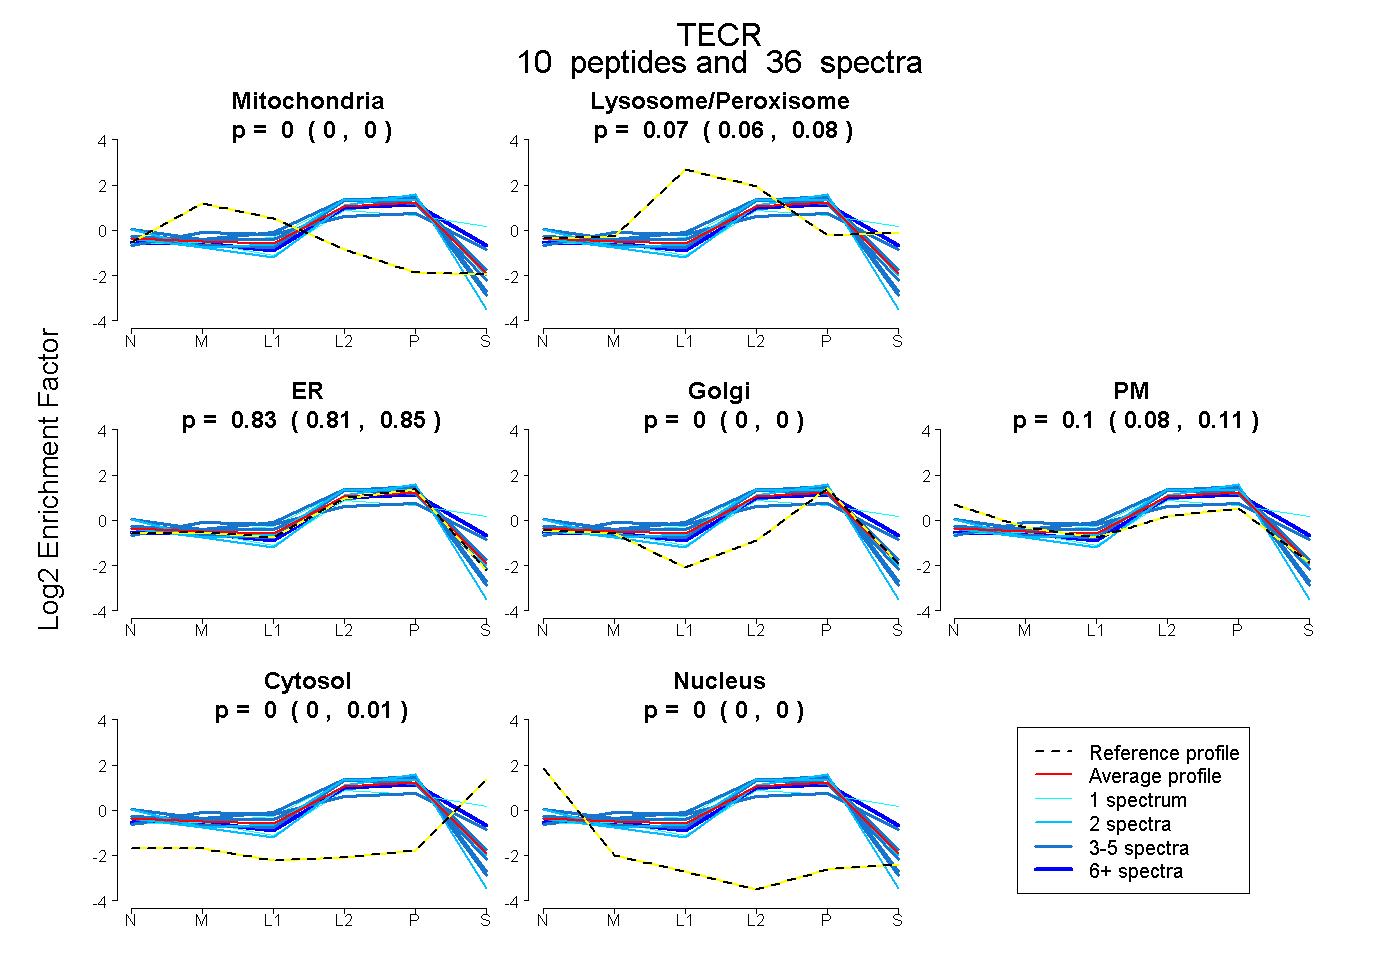 |
0.000 0.000 | 0.000 |
0.071 0.056 | 0.083 |
0.830 0.807 | 0.848 |
0.000 0.000 | 0.000 |
0.099 0.079 | 0.110 |
0.000 0.000 | 0.007 |
0.000 0.000 | 0.000 |
|||
| Plot | Lyso | Other | |||||||||||
| Expt C |
12 peptides |
178 spectra |
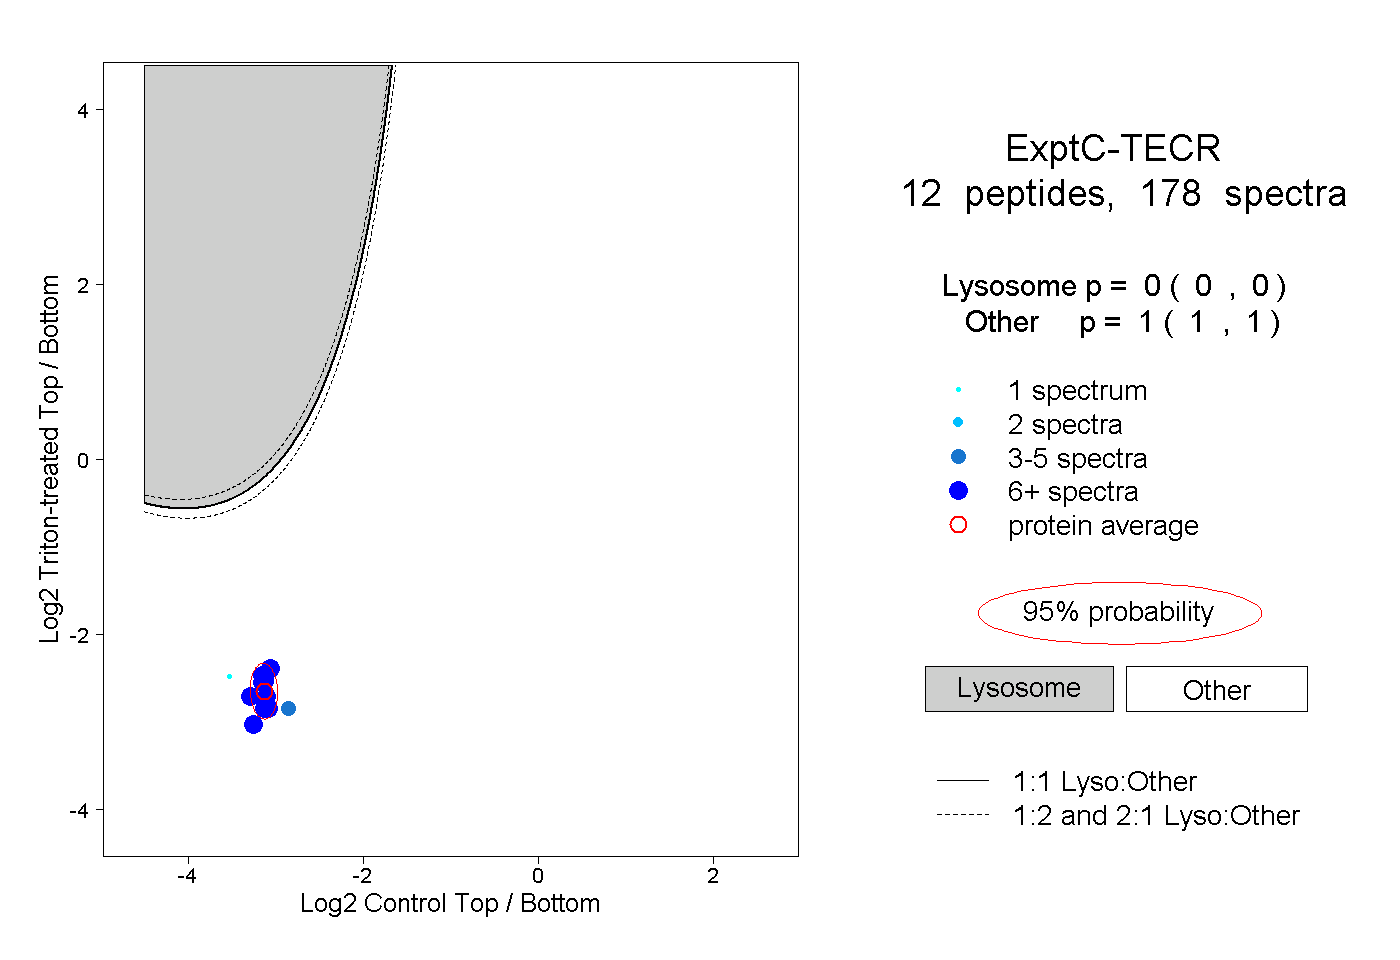 |
0.000 0.000 | 0.000 |
1.000 1.000 | 1.000 |
||||||||
| Plot | Lyso | Other | |||||||||||
| Expt D |
8 peptides |
19 spectra |
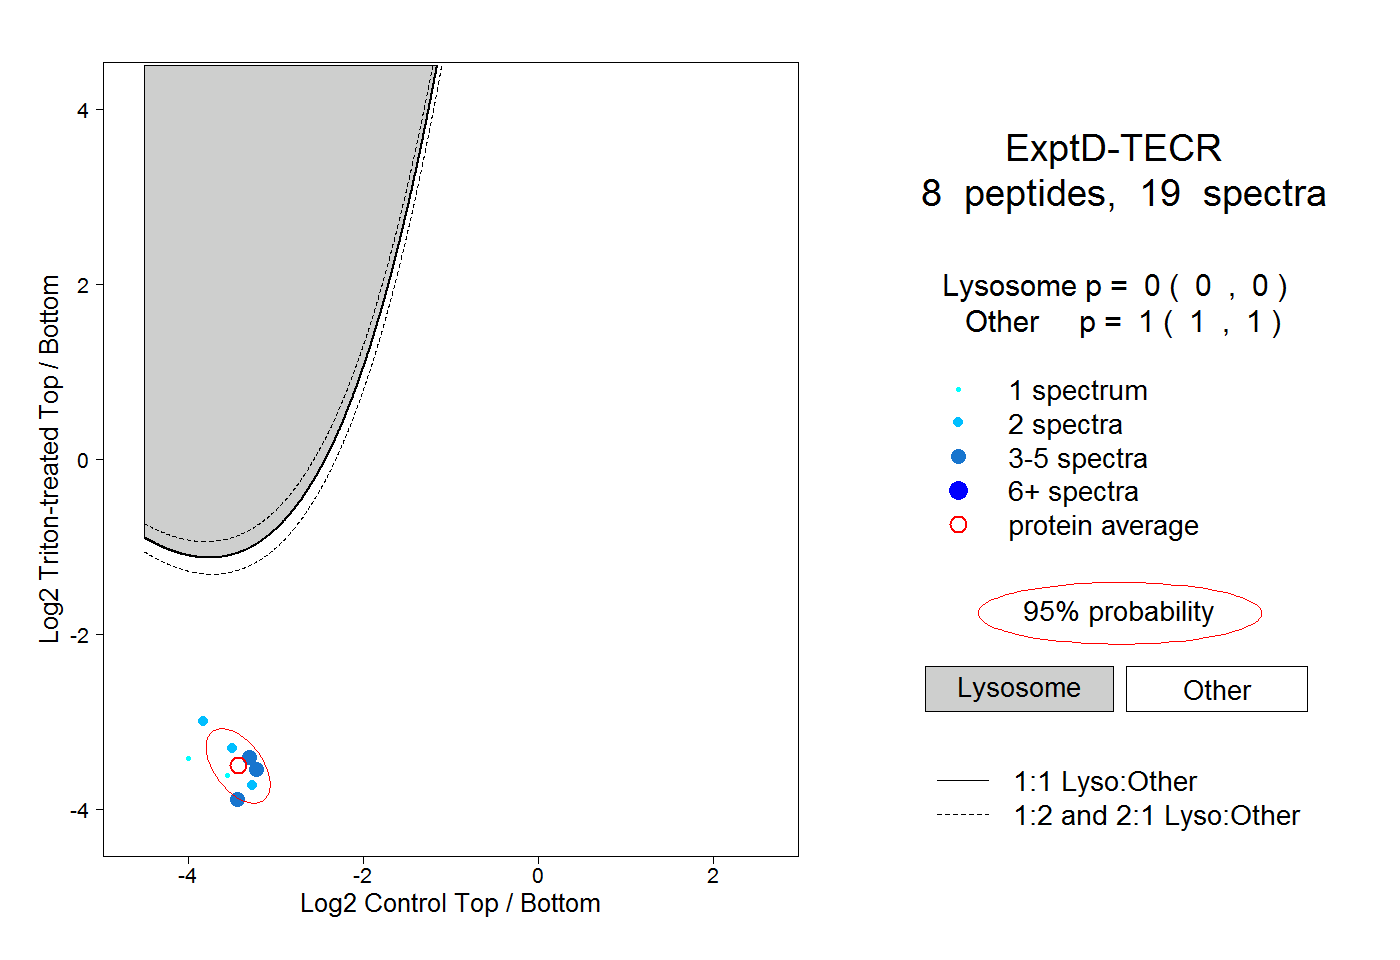 |
0.000 0.000 | 0.000 |
1.000 1.000 | 1.000 |